
Archived - Statement and Impacts Report on Gender, Diversity, and Quality of Life
Download the PDF version

Table of Contents
- Statement on Gender Equality and Diversity in Canada
-
Budget 2022 : Impacts
Report
- Notes on Terms and Fields
- Education and Skills Development
- Economic Participation and Prosperity
- Leadership and Democratic Participation
- Gender-based Violence and Access to Justice
- Poverty Reduction, Health and Well-being
- Gender Equality Around the World
- Chapter 1: Making Housing More Affordable
- Chapter 2: A Strong, Growing, and Resilient Economy
- Chapter 3: Climate and Energy Security
- Chapter 4: Creating Good Middle Class Jobs
- Chapter 5: Canada’s Leadership in the World
- Chapitre 6: Strong Public Health Care
- Chapter 7: Moving Forward on Reconciliation
- Chapter 8: Promoting Canadian Values
- Chapter 9: Tax Fairness and Effective Government
- Budget 2022 Annex Measures
Statement on Gender Equality and Diversity in Canada
In the last century, Canada has seen major advancements in gender equality and diversity. Women, Indigenous peoples, LGBTQ2 people, Black and racialized Canadians, and people with disabilities have increasingly had their voices heard, entered the workforce in growing numbers, shone in all fields, and held positions as leaders in politics, business, academia, and the community. Through deliberate policy choices, the government is advancing efforts that feminist and intersectional activists have championed for years, such as a national early learning and child care system and a National Action Plan to End Gender-Based Violence.
Yet, significant challenges remain, many of which have been amplified by the pandemic. As we move forward, we must build on the important progress that has been made in recent decades, and go even further to strengthen equality, diversity, and inclusion.
If Canada has not won the war against the exclusion of women, we have fought the first important battles. We have rejected the exclusionary politics that once denied women access to the levers of influence, power and full societal participation. We lead other nations in the opportunities we open to women...Yet despite these achievements - and they are not inconsiderable - we still have terrain to take. Women’s equality issues remain very much alive. Few women occupy the highest seats of political office and commerce...we have not achieved pay equity. And violence against women is a persistent problem.
The government remains committed to upholding a decision-making process that considers the impacts of policies, programs, and legislation on all Canadians in a budgetary context, as enshrined in the Gender Budgeting Act. To do that, the government uses two tools: the Gender Results Framework (GRF) and Gender-based Analysis Plus (GBA Plus).
Canada’s GRF is a whole-of-government articulation of Canada’s gender equality priorities and goals with matching indicators to track developments toward these goals. The GRF is also used to present statistics on diverse groups of people, including Indigenous peoples, people with disabilities, racialized Canadians, and LGBTQ2 people.
The Impacts Report, which leverages GBA Plus and Canada’s Quality of Life Framework, provides a summary of the impacts on Canadians for each new measure in Budget 2022.
Gender Equality Goals for Canada
Note on Methodology
Similar to Budget 2021, this Statement uses a dashboard to summarize the status of gender equality and diversity in Canada today. The aggregate narrative in Canada has not changed significantly in the past few years, in large part, because these indicators tend to move slowly over time, without large fluctuations year-over-year.
This year’s Statement puts an emphasis on comparing current outcomes across groups, embracing the concept that no person is composed of a single identity.
Data from many surveys has been leveraged, sometimes from different years. Due to potential differences in methodology and context, small differences across groups should be treated with caution. Additionally, it should be noted that not all Statistics Canada surveys are conducted annually and thus data reflects the most recent available versions.
In this Statement, terminology is largely dictated by the data collection process, which, until recently, continued to reflect binary norms around gender and did not take into account differences between sex at birth and gender identity. With the release of the 2018 Survey on Safety in Public and Private Spaces, Statistics Canada published information on outcomes for transgender and non-binary people for the first time and, in April 2022, Statistics Canada will release its first-ever comprehensive profiles of both transgender and non-binary people in Canada using data from the 2021 Census. Continual investments in disaggregated data, including those in Budget 2021, mean that new statistics on key demographic groups are becoming available. As more data sources become available, future iterations of this report will be able to reflect more details on transgender and non-binary populations.
Statistics for lesbian, gay and bisexual populations in Canada are more frequently available, but due to concerns around small population sizes and protecting privacy, it is not always possible to report on the indicators for each group individually. As a result, lesbian, gay and bisexual populations will often be presented collectively, and occasionally abbreviated as LGB.
This Statement follows Statistics Canada terminology and uses the term "visible minorities" to refer to non-Indigenous racialized Canadians, as it is the official demographic category defined by the Employment Equity Act.
Canada’s Disaggregated Data Action Plan
Budget 2021 announced $172 million over five years, with $36.3 million ongoing, for Statistics Canada for a Disaggregated Data Action Plan (DDAP). This plan aims to provide Canadians with detailed statistical data that highlights the experiences of women, Indigenous peoples, LGBTQ2 people, visible minorities, and Canadians with disabilities, ensuring that fairness and inclusion are a key part of evidence-based policy- and decision-making.
Through the DDAP, Statistics Canada is improving and expanding data collection allowing for greater opportunities for disaggregation by and within key population groups, including in several flagship surveys: the Labour Force Survey (LFS), the Canadian Community Health Survey, and the General Social Survey. These three surveys are heavily used in reporting on the indicators throughout the Gender Results Framework. Due to DDAP-funded expansions of the LFS, for the first time ever, a public table presenting labour market information for visible minority groups will be made available with the April 2022 release. Statistics Canada has also expanded the Canadian Survey on Business Conditions to allow for timely data on business conditions in Canada for businesses majority-owned by women, visible minority sub-populations, Indigenous peoples, persons with a disability, and immigrants to Canada.
A key component of the DDAP is to ensure that the new data and analyses will be easily accessible to the public, policymakers, and data users. To do this, Statistics Canada has expanded its Centre for Gender, Diversity and Inclusion Statistics. It now includes a wide range of indicators, research, and analytical reports on diverse population groups to promote intersectional analyses.

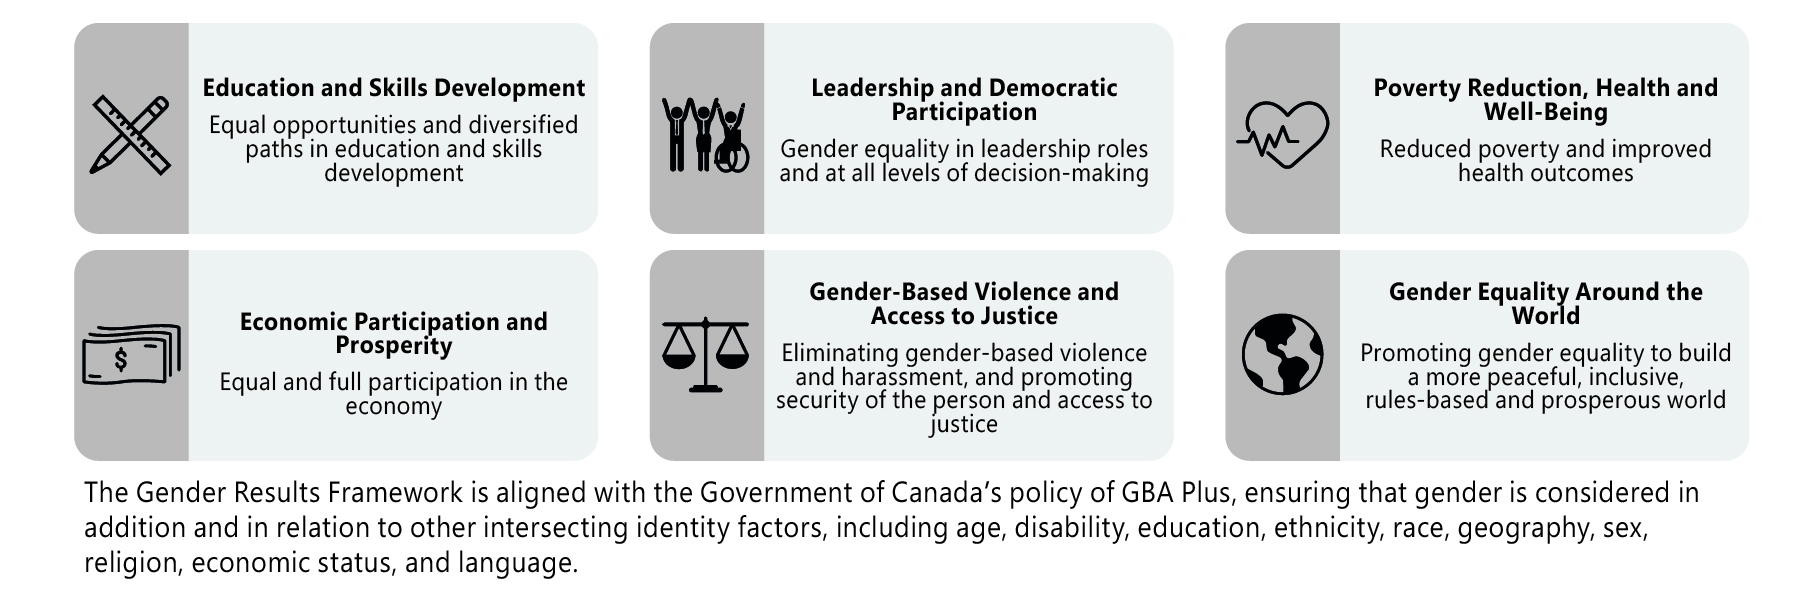
Gender Results Framework
Pillar: Education and Skills Development
Goal: Equal opportunities and diversified paths in education and skills development
Educational paths should not be limited by discrimination, norms, stereotypes, or other barriers to access.
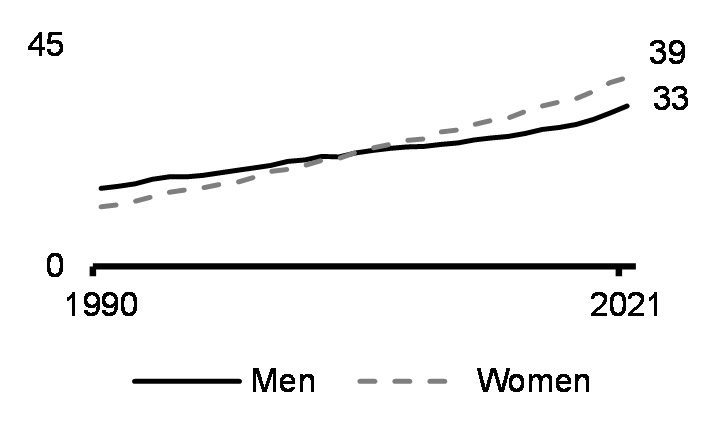
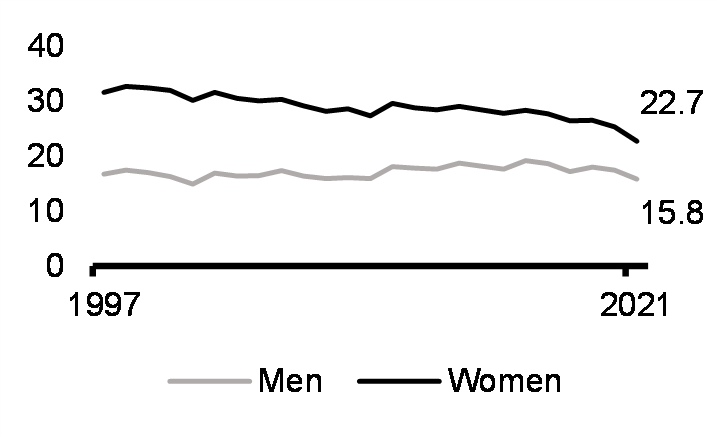
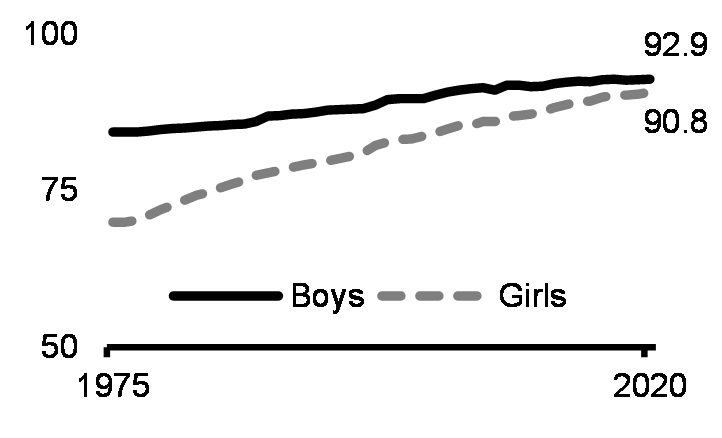
Educational attainment
(highest education, 25-64 yrs, %)
(highest education, 25-64 yrs, %, ~2016)*
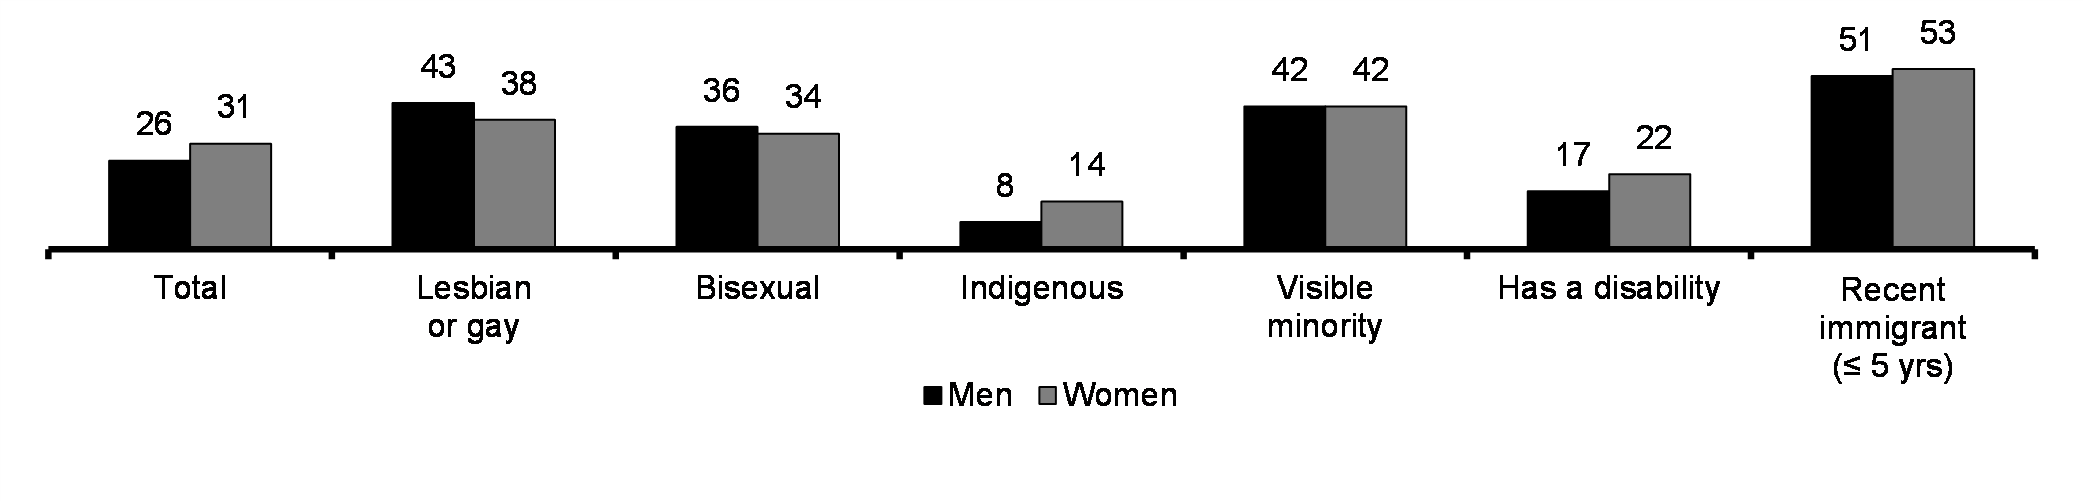
Tradespeople
(highest education, 25-64 yrs, %, ~2016)*
| Men | Women | |
|---|---|---|
| Total | 15 | 7 |
| Indigenous | 19 | 8 |
| Visible minority | 6 | 4 |
| Has a disability | 15 | 7 |
| Recent immigrant (≤ 5 yrs) | 6 | 4 |
| Lesbian, gay or bisexual | 9** | 7 |
granted to women (%, 2020)
| Total | 12 |
|---|---|
| Early childhood educators and assistants | 97 |
| Hairstylists and estheticians | 91 |
| Community and social service workers | 91 |
| Heavy duty equipment mechanics | 2 |
| Plumbers, pipefitters and steamfitters | 2 |
| Refrigeration and air conditioning mechanics | 1 |
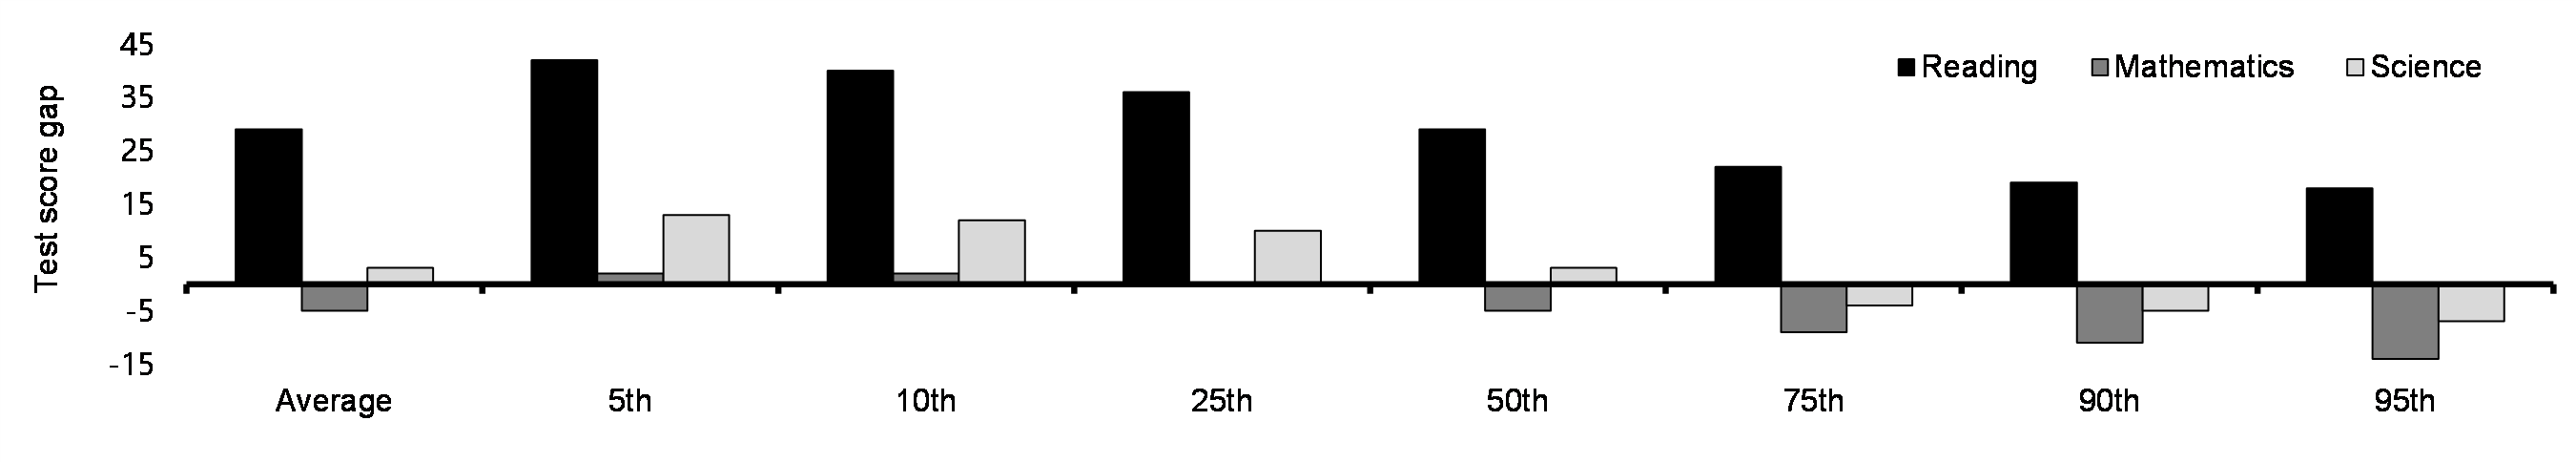
Gender gap (girls minus boys) in test scores
(mean score around 500 pts, selected percentiles, 15 yrs, 2018)
Test score gap relative to non-Indigenous people
(mean score around 270 pts, 16-65 yrs, 2012)
Proportion of bachelor's students
who were women (%, 2019-20)
| Health and related fields | 76 |
|---|---|
| Education | 75 |
| Social and behavioural sciences and law | 69 |
| Mathematics, computer and information sciences | 26 |
| Architecture and engineering | 25 |
Note: * indicates the use of different surveys within the same chart; use with caution. ** indicates a high coefficient of variation; use with caution.
Sources: Labour Force Survey, 2016 Census, Canadian Survey on Disability, Canadian Community Health Survey, Registered Apprenticeship Information System, Programme for International Student Assessment, Programme for the International Assessment of Adult Competencies, Postsecondary Student Information System.
As the dashboard above shows, barriers remain to equal opportunities and diversified paths in education and skills development for some Canadians.
- Indigenous peoples and persons with disabilities are significantly less likely to obtain a university education.
- Indigenous men are overrepresented among apprenticeship and trades certificate holders, while women and visible minority men are underrepresented.
- Despite only small differences by gender in average test scores for science and math, there are important differences across the distribution, with high-achieving boys significantly outperforming high-achieving girls. These differences at the top of the distribution are cited as one of the reasons for gender disparities in science- and math-based fields of study and occupations. Girls and boys show no cognitive differences in mathematical ability during infancy and early childhood across multiple tasks. Differences appear only at older ages.
- Indigenous peoples, especially Inuit, have lower average scores on tests of numeracy and literacy than non-Indigenous people.
- Men continue to be underrepresented in fields related to health and education, while women are underrepresented in programs related to math, computer and information sciences, architecture, and engineering, which contributes to the gender wage gap and can perpetuate harmful gender norms.
To cultivate diversified educational paths and break down barriers limiting options for women, Indigenous, Black and racialized Canadians, and persons with disabilities, the government has invested in programs that support the increasing demand for skills in science, technology, engineering and mathematics (STEM). The government also continues to support targeted measures that remove participation barriers which prevent women, Indigenous youth, and other marginalized groups from accessing lifelong learning opportunities.
Actions to Support Education and Skills Development
- Indspire has provided over 49,000 scholarships and bursaries since its inception in 2004 to support Indigenous students in their educational goals. In 2020-21, more than $20 million was disbursed to 6,245 Indigenous students. Indspire bursaries have a proven track of success with 90 per cent of recipients graduating and 89 per cent finding employment after graduation.
- As of March 6, 2022, over 9,100 Apprenticeship Incentive Grants for Women had been issued since its inception in 2018, helping women to pursue careers in the trades, a field traditionally dominated by men.
- In 2019-20, 550 women were directly supported through Women in Construction Fund projects, and over 319,800 women were reached through a project that promoted awareness of the skilled trades as a career choice.
- Funding through the Equitable Access to Reading Program to support the production and distribution of alternative format materials for Canadians with print disabilities, creating more learning opportunities for adults.
- Targeted scholarships and fellowships for promising Black student researchers to ensure equal opportunities for those currently underrepresented.
- Modernizing Part II of the Employment Insurance Act to ensure more workers are eligible for help before they become unemployed, and that employers can receive direct support to re- train their workforce to ensure diversified paths in skills development.
*Please refer to the Impacts Report to see other Budget 2022 investments that are expected to advance this pillar.

Gender Results Framework
Pillar: Economic Participation and Prosperity
Goal: Equal and full participation in the economy
An economy that includes everyone and improves the standards of living of all Canadians creates strong economic growth for all.
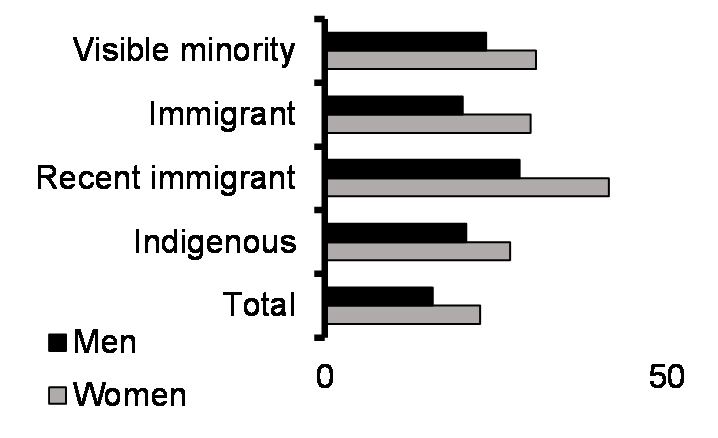
Labour force
(25-64 yrs, %)
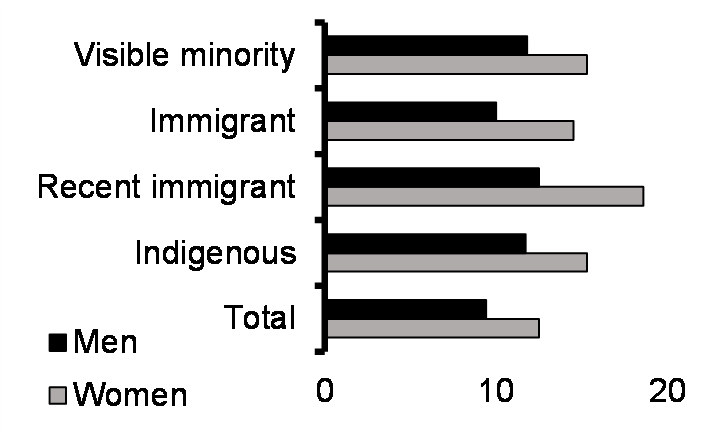
Earnings
(25-54 yrs, %)**
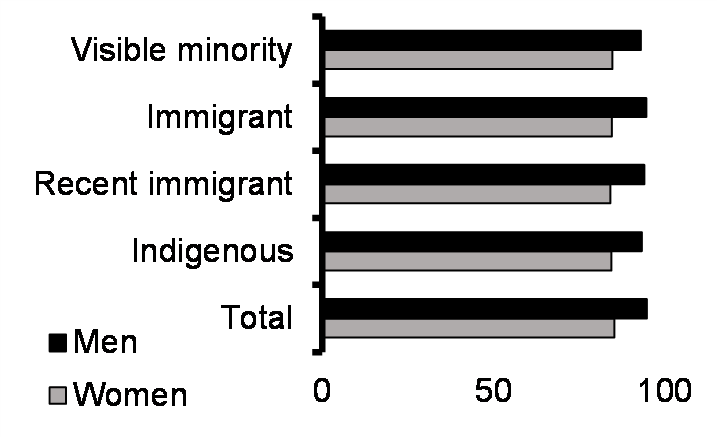
Type and hours of work
(25-54 yrs, %, 2021)***
(25-54 yrs, %, 2021)***
(25-54 yrs, 2015)
Workers who were women (%, 2021)
| Nursing | 91 |
|---|---|
| Health services support | 86 |
| Legal, social, community and education services | 86 |
| Trades and construction helpers and labourers | 6 |
| Maintenance and equipment operation trades | 5 |
| Industrial, electrical and construction trades | 5 |
Average proportion of after-tax income spent on child care (%, 2019)
Note: * indicates the use of different surveys within the same chart; use with caution. ** Low-wage work is defined as two-thirds of the median hourly wage of full-time, permanent employees aged 25-54 years. *** Indigenous includes only off-reserve Indigenous peoples, and recent immigrants are defined as those who obtained permanent residence in the last five years or less. **** indicates a high coefficient of variation; use with caution.
Sources: Labour Force Survey, 2016 Census, Canadian Survey on Disability, Canadian Community Health Survey,
Canadian Income Survey, General Social Survey.
As the dashboard above shows, barriers remain to full and equal participation for some Canadians.
- Women, especially recent immigrant and visible minority women, continue to be less likely to participate in the labour market than men. Indigenous peoples and persons with disabilities are also less likely to be in the labour force.
- Gender gaps in earnings have closed steadily in recent decades, but women continue to make up a disproportionate share of low-wage workers. Indigenous, visible minority, and recent immigrant women are also overrepresented among low-wage workers.
- Women are more likely to work in temporary or part-time positions, including involuntarily, reflecting, in part, greater unpaid household work responsibilities. Visible minority and immigrant women report the highest hours of unpaid household work.
- Career choices for both women and men are limited by gendered norms and expectations. These social factors, which hold back women and men from achieving their full potential, can also reduce economic growth and standards of living.
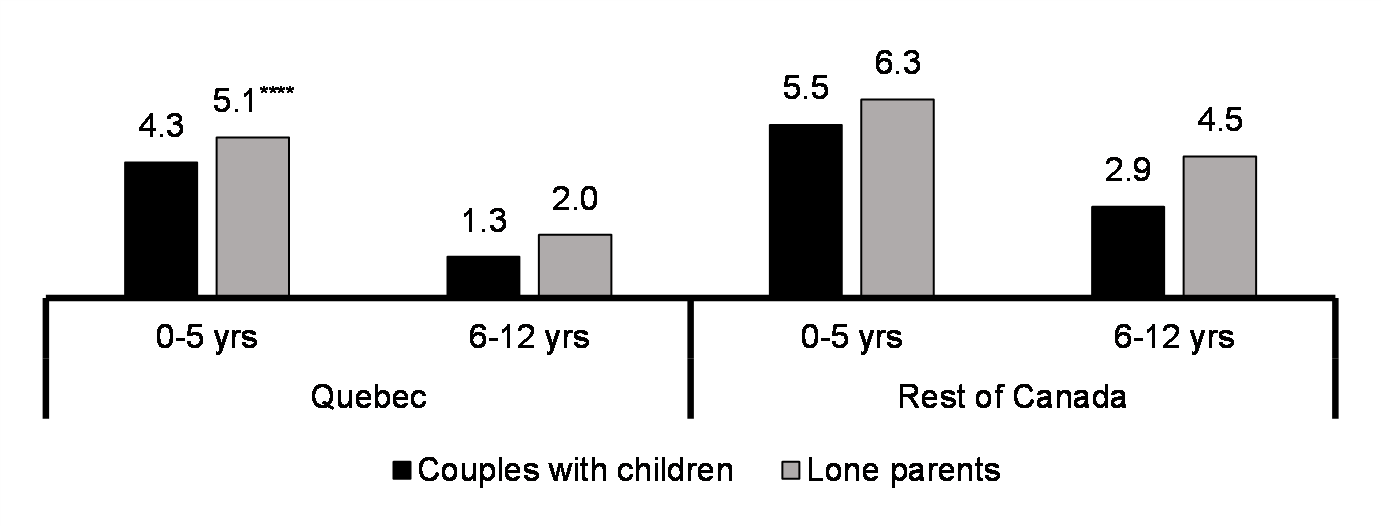
- Child care costs are a significant barrier to mothers’ labour force participation. In Quebec, child care costs are a smaller share of after-tax income than in the rest of Canada, and women with children under three in Quebec have some of the highest employment rates in the world.
Recognizing that varying socio-cultural factors and systemic discrimination may impede equal and full participation in economic activities, continued investments in reducing the wage gap, improving accessibility of affordable high-quality child care, and expanding community-based programming will support the government’s efforts for all Canadians to prosper.
Actions to Support Economic Participation and Prosperity
- Agreements to build a Canada- wide early learning and child care system have now been signed by all 13 provinces and territories. Each agreement commits to reach an average fee of $10 per day by 2025-26, and most provinces and territories are moving faster than anticipated with initiatives to accelerate fee reductions and support access to affordable high-quality child care.
- Since the introduction of the EI Parental Sharing Benefit, the number of men receiving benefits has grown by 40 per cent.
- The Canada Labour Code was amended to establish a federal minimum wage of $15 that rises with inflation to help address the cost of living. On April 1, 2022, the federal minimum wage increased to $15.55.
- Investing $625 million for an Early Learning and Child Care Infrastructure Fund to provide support to each province and territory for the implementation of Canada-wide child care, which helps parents with child care responsibilities and increases the labour force participation of women.
- Employment strategy for persons with disabilities through the Opportunities Fund, including funding to Ready, Willing and Able to help persons with Autism Spectrum Disorder or intellectual disabilities find employment.
- Supporting foreign credential recognition in the health sector will help skilled newcomers secure meaningful, well-paying jobs.
*Please refer to the Impacts Report to see other Budget 2022 investments that are expected to advance this pillar.

Gender Results Framework
Pillar: Leadership and Democratic Participation
Goal: Gender equality in leadership roles and at all levels of decision-making
All Canadians should be able to see themselves in their economic, political, and judicial leaders.
Economic leadership
(%, 2020)*
(%, 2016)
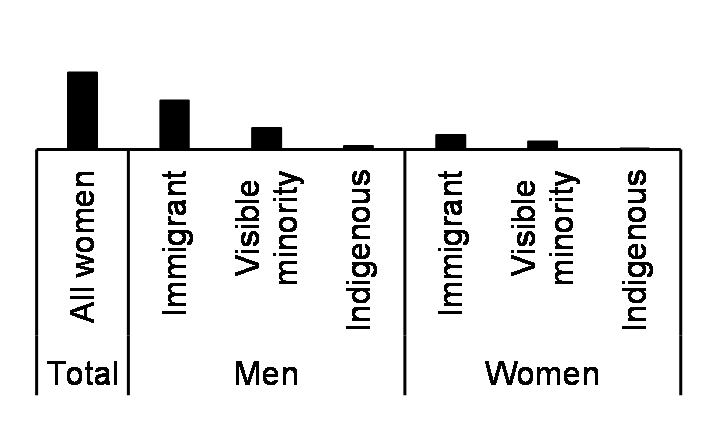
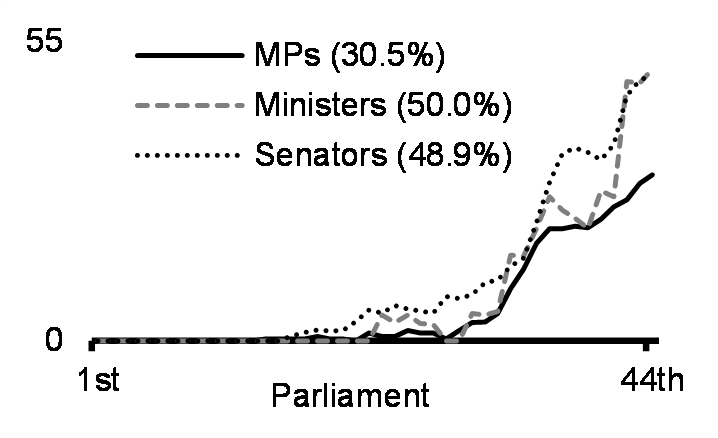
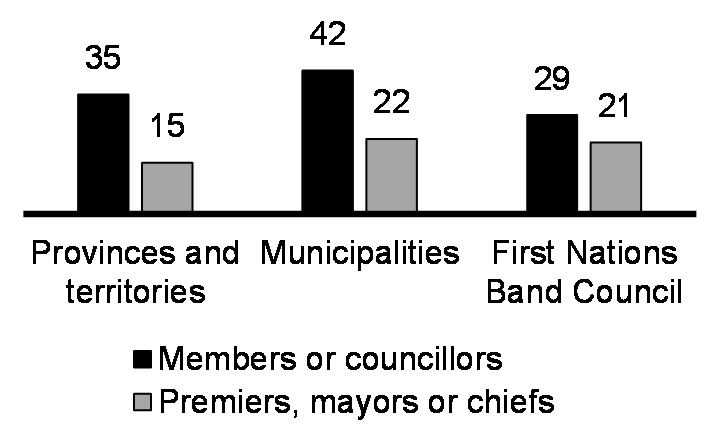
Political leadership
(%, 2021-22)*
Judicial representation
Law enforcement
Note: * indicates that estimates of population shares are from a different year (i.e. 2016). ** Estimates for municipalities only include those municipalities with over 200,000 residents in the 2021 Census.
Sources: 2016 Census, 2021 Census, Canadian Survey on Disability, Survey on Financing and Growth of Small and Medium Enterprises, Corporations Returns Act, Policy Options, Xtra Magazine, Parliament of Canada, Library of Parliament, provincial, territorial, and municipal websites, Indigenous Services Canada, Office of the Commissioner for Federal Judicial Affairs, Police Administration Survey.
As the dashboard above shows, hurdles remain to diversity and inclusion in positions of leadership in politics, business, justice, and law.
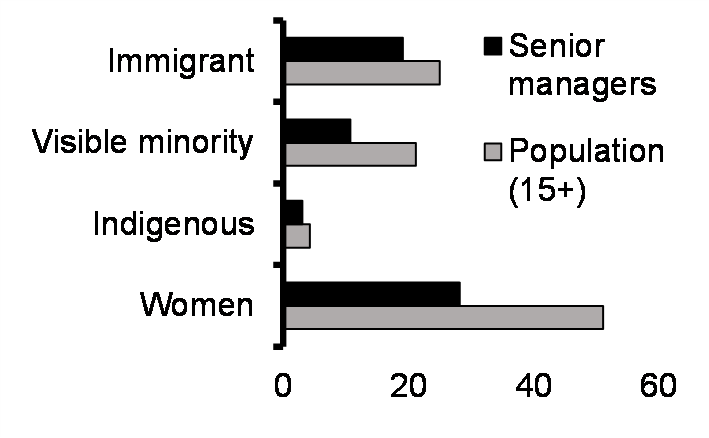
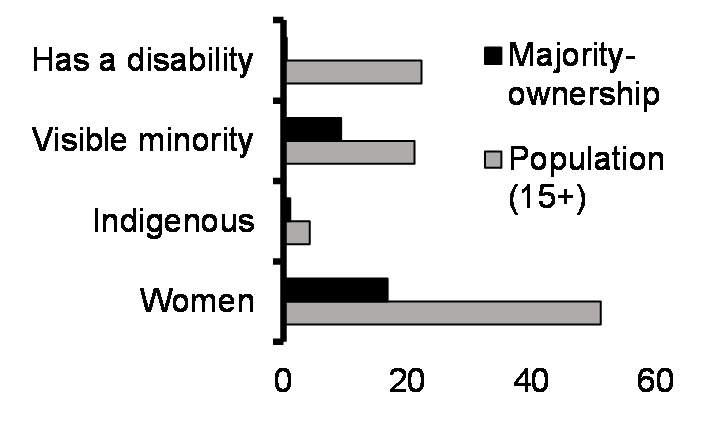
- Senior management, business ownership, and corporate leadership continue to be heavily dominated by men and lacking in diversity.
- Despite gradual increases in the number of women in politics, they continue to be underrepresented, as are Indigenous peoples, immigrants, and visible minorities.
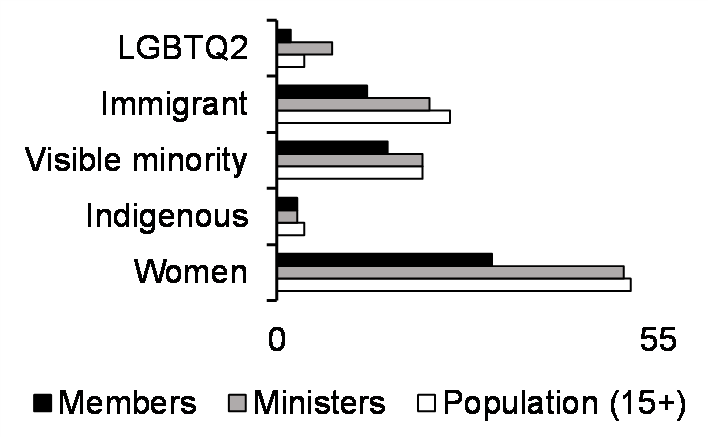
- Almost half of federal judges are women, and recent appointments have mirrored population shares for many groups, yet gaps in recent appointments remain for people with disabilities and visible minorities.
- Police forces across Canada are lacking in their representation of women, Indigenous peoples, visible minorities, and immigrants, and as a result, police forces may not represent the communities they police, though representation may vary within individual police services.
Women and diverse groups need to be integrated into leadership roles at all levels of decision-making in all sectors to ensure that our economy, democracy, law enforcement, and judicial systems reflect our communities. To support this goal, the government has invested and continues to invest in key measures to help women and diverse groups succeed in governance and economic opportunities.
Actions to Support Leadership and Democratic Participation
- As of March 8, 2022, there were 1,485 organizations participating in the 50-30 Challenge, an initiative that asks organizations to aspire to gender parity (50 per cent) and significant representation (30 per cent) of other equity-deserving groups on their boards and in senior management positions.
- Women and Gender Equality Canada has invested $55 million since 2015 to fund 115 projects supporting women and girls in leadership and decision-making roles. As a result, more than 1.4 million women and girls gained access to services and supports that resulted in better opportunities for leadership positions in various spheres.
- The Women Entrepreneurship Knowledge Hub (WEKH) participated in, or co-sponsored, more than 1,400 events in 2020–21, including 90 events related to the impacts of the COVID19 pandemic on women entrepreneurs as well as webinars on supports for women entrepreneurs during the pandemic.
- Creating a more diverse, responsive and open climate within the Department of National Defence and the military as well as enhancing health care and fitness programming for women and gender diverse members of the Canadian Armed Forces to encourage greater representation of women and underrepresented groups in senior leadership.
- The creation of 24 new judicial positions in federal and provincial and territorial superior courts across the country through the superior courts’ judicial appointment process will continue to help increase the share of federally appointed judges who are women or who are members of underrepresented groups.
- Providing additional funding for the Supporting Black Canadian Communities Initiative to continue empowering Black community organizations promote inclusiveness among Black Canadians.
*Please refer to the Impacts Report to see other Budget 2022 investments that are expected to advance this pillar.

Gender Results Framework
Pillar: Gender-Based Violence and Access to Justice
Goal: Eliminating gender-based violence and harassment, and promoting security of the person and access to justice
All Canadians should be safe and free from physical, emotional or sexual violence, discrimination, and harassment, regardless of where they live or who they are.
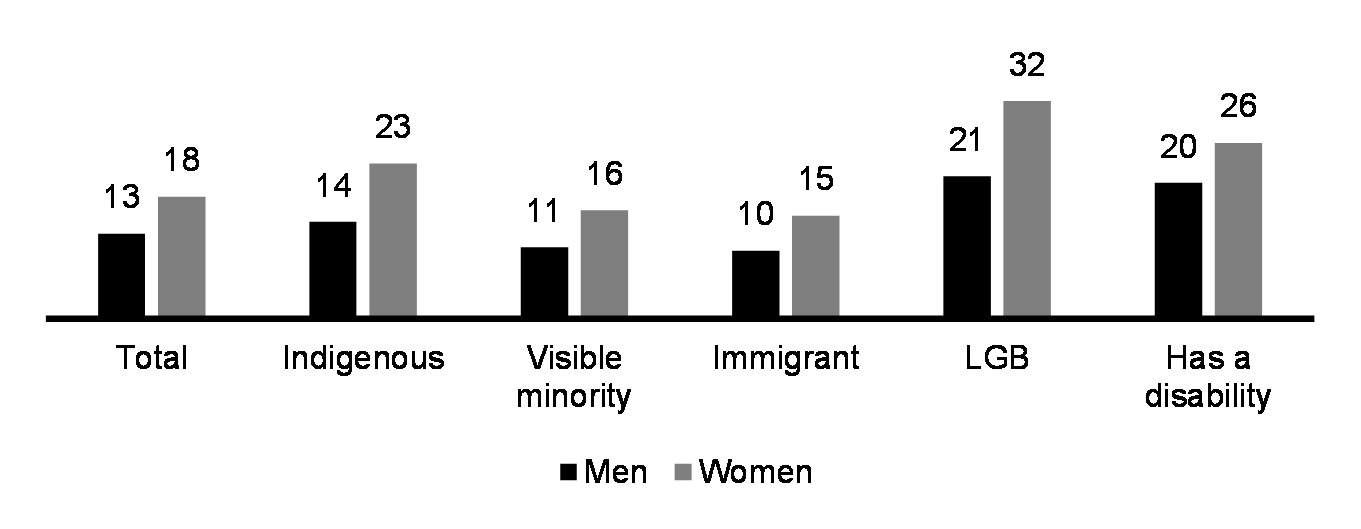
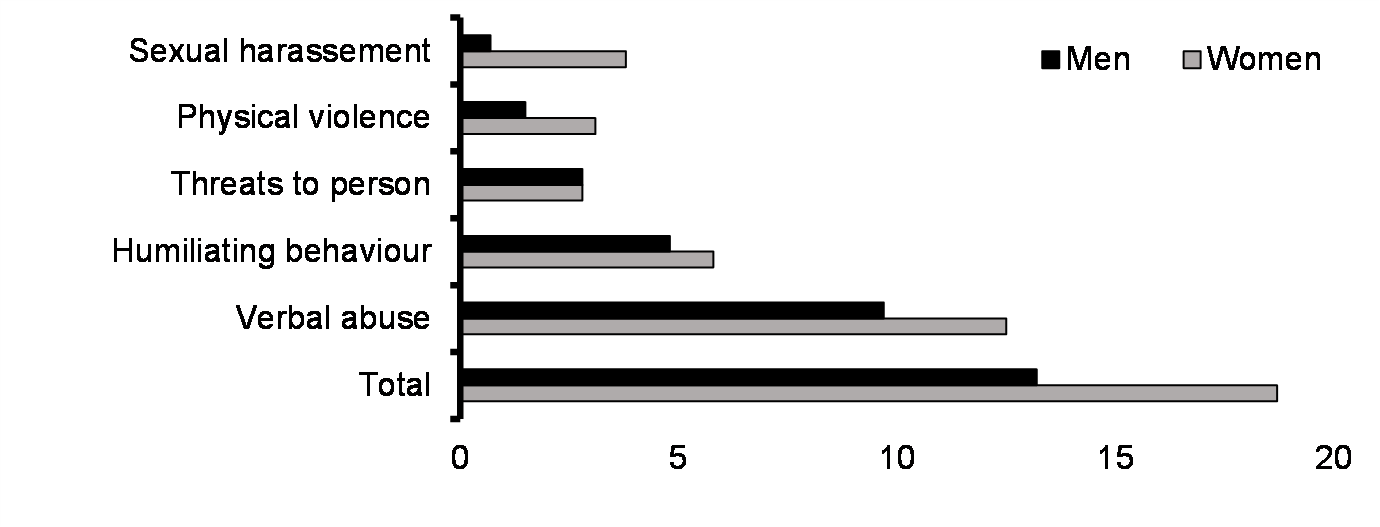
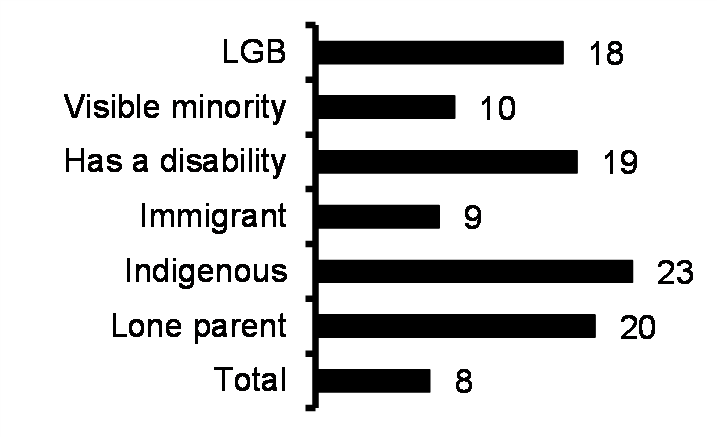
Workplace harassment
Self-reported sexual assault
(since age 15, %, 2018)
Incidents of self-reported violent crime reported to police (%, 2019)
| Sexual assault | 6 |
|---|---|
| Robbery | 47 |
| Physical assault | 36 |
| Household victimization | 35 |
| Personal property theft | 28 |
| All crimes | 29 |
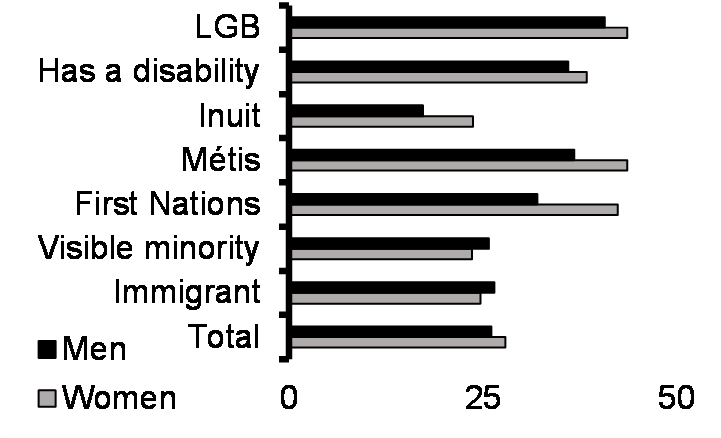
Self-reported childhood abuse (%, 2018)
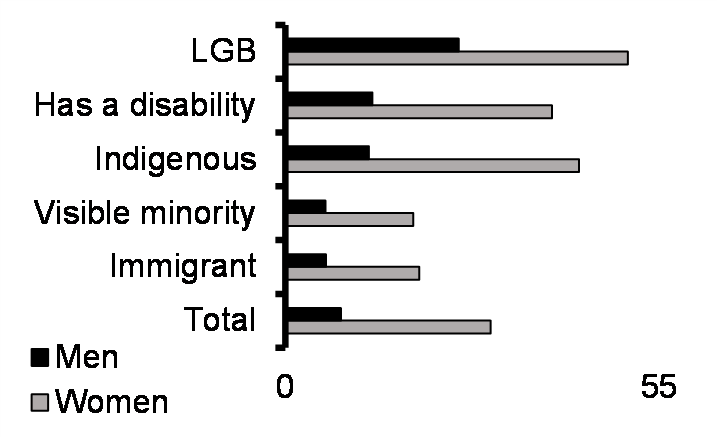
Intimate partner violence (IPV)
Homicide
Sources: General Social Survey, Survey of Safety in Public and Private Spaces, Homicide Survey, Uniform Crime Reporting Survey.
Experiences of gender-based violence—defined as violence that is committed against someone based on their gender identity, gender expression, or perceived gender—persist in Canada, and range from harassment to homicide. Other acts of physical, sexual, or psychological harm or suffering based on identity, such as race-based hate crimes, also exist. As the dashboard
above shows:
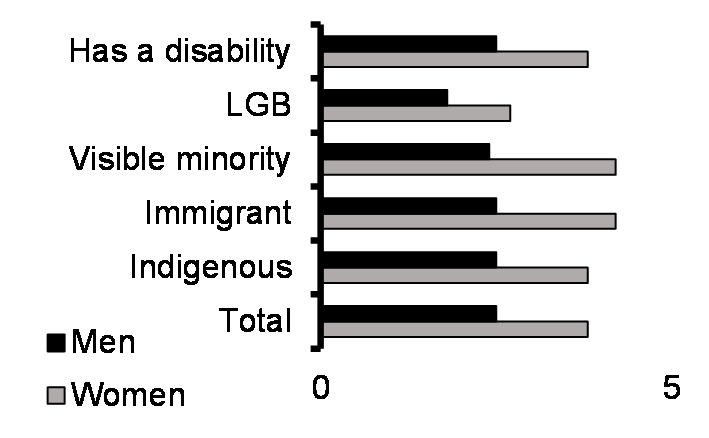
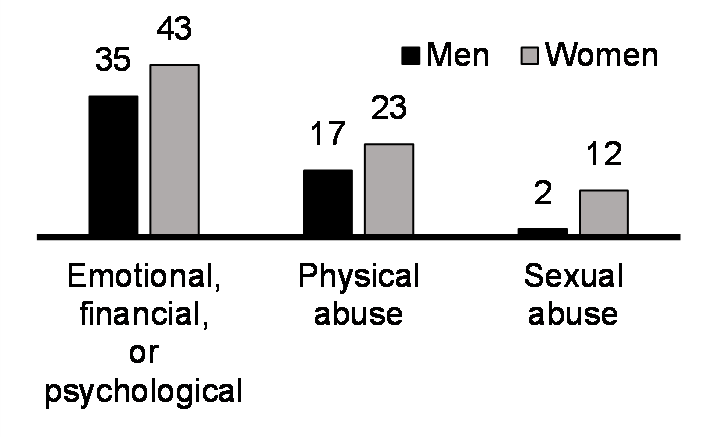
- Women are more likely to experience workplace harassment, especially verbal abuse, physical violence, and sexual harassment. Women with disabilities, Indigenous women, and lesbian or bisexual women report higher rates of workplace harassment.
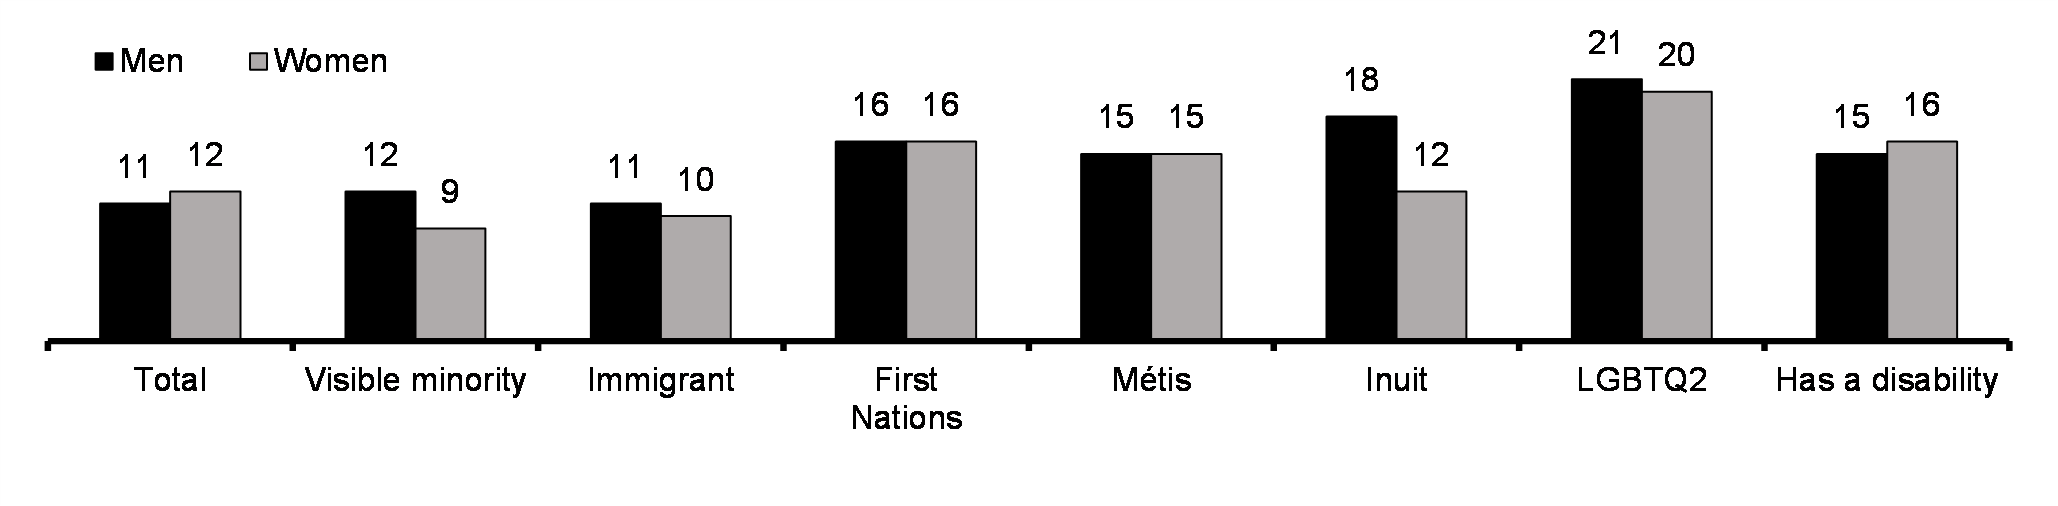
- People with disabilities, Indigenous peoples, and LGBTQ2 people report the highest rates of intimate partner violence in the past 12 months. Women are more likely than men to report experiencing intimate partner violence since age 15, especially sexual abuse.
- Experiences of violence as children and as adults are more common for persons with disabilities, First Nations people, Métis people, and LGBTQ2 people. For nearly all groups, except visible minorities and immigrants, women are more likely to report experiences of childhood abuse.
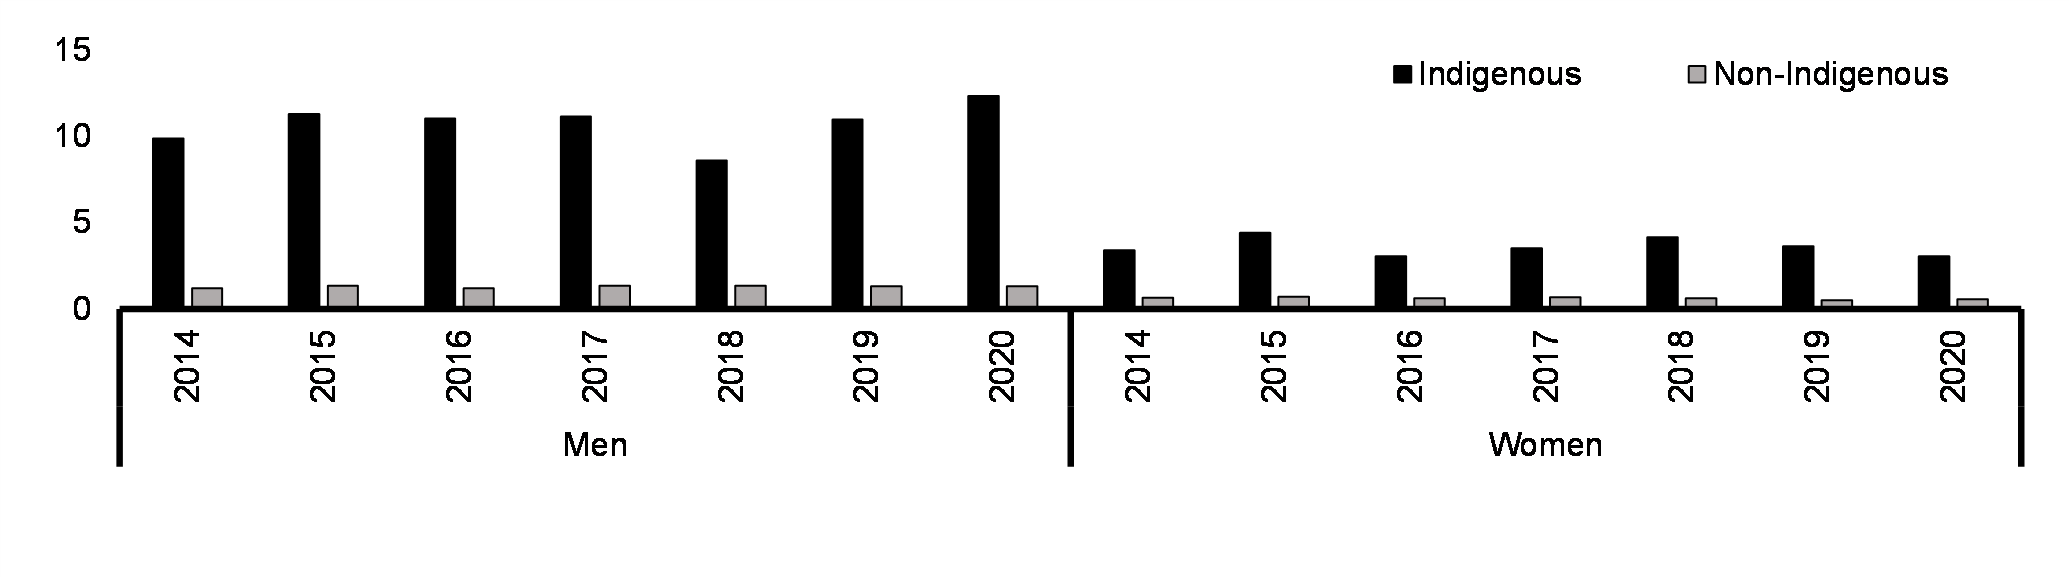
- Homicide rates for Indigenous men are about 8-9 times higher than those for non-Indigenous men, while homicide rates for Indigenous women are about 5-7 times higher than those for non-Indigenous women and 2-3 times higher than those for non-Indigenous men.
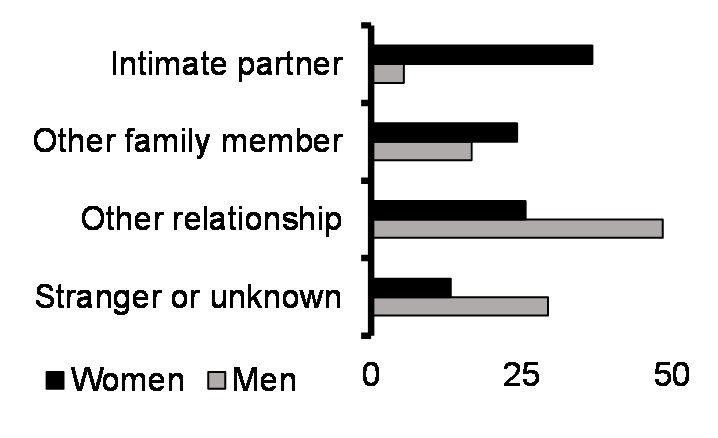
- Murdered women are more likely to be intimately related to their killer or to have another type of familial relationship.
Gender- and identity-based violence against vulnerable groups is a systemic problem that reinforces unequal power relationships. To work toward eliminating such violence and harassment, the government has made and continues to make a number of investments to support victims and survivors through improved access to and confidence in the justice system.
Actions to Support Gender-Based Violence and Access to Justice
- The RCMP has established a Sexual Assault Review Team, which has reviewed over 30,000 files from 2015-17 sexual assault investigations that were not cleared by charge.
- As part of the government’s COVID-19 response, over 1,200 organizations across Canada received funding to ensure front line services and shelters continued to provide essential supports for women and families fleeing violence. Since April 2020, more than 1.3 million people experiencing gender-based violence have had a place to turn to thanks to the organizations supported through this funding.
- On June 21, 2021, Bill C-15, the United Nations Declaration on the Rights of Indigenous Peoples Act received Royal Assent and became law. This Act requires that the government develop an action plan by June 2023 to achieve the objectives of the Declaration.
- Investments to support provinces and territories in advancing a National Action Plan to End Gender-Based Violence
- Support the work underway to launch a new Anti-Racism Strategy and National Action Plan to Comb at Hate to reduce systemic racism, discrimination, and hate in Canada.
- An increase in Federal Criminal Legal Aid funding to provinces and territories will improve the responsiveness of the Canadian criminal justice system and help to ensure everyone receives a fair hearing, including Indigenous peoples, Black Canadians, and vulnerable individuals, who are overrepresented before criminal courts.
- Actions to address the shameful legacy of residential schools, including supporting community-led responses to unmarked burial sites, will increase the accountability and responsiveness of the Canadian criminal justice system.
* Please refer to the Impacts Report to see other Budget 2022 investments that are expected to advance this pillar.

Gender Results Framework
Pillar: Poverty Reduction, Health and Well-Being
Goal: Reduced poverty and improved health outcomes
All Canadians should be free from poverty, have access to quality health care, and have opportunities to improve their well-being.
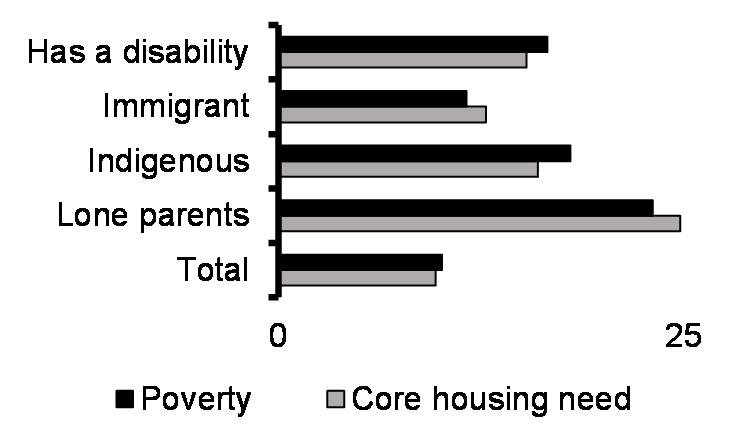
Official poverty rate (%)
Official poverty rate and core housing need (%, ~2018)*,**
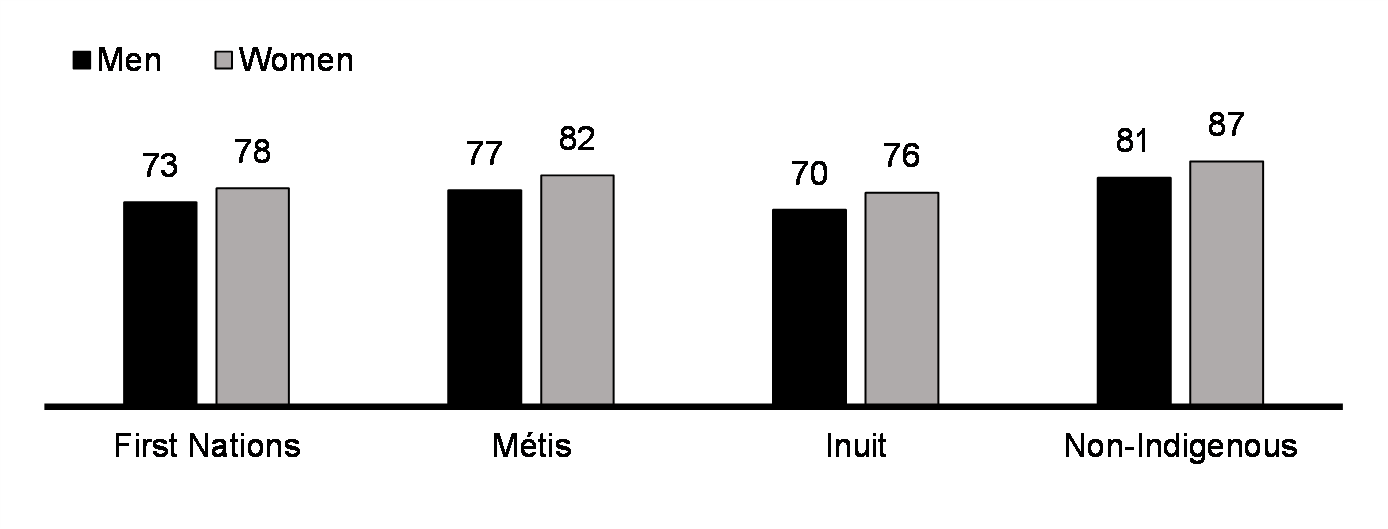
Life expectancy at age 1 (yrs, 2011)
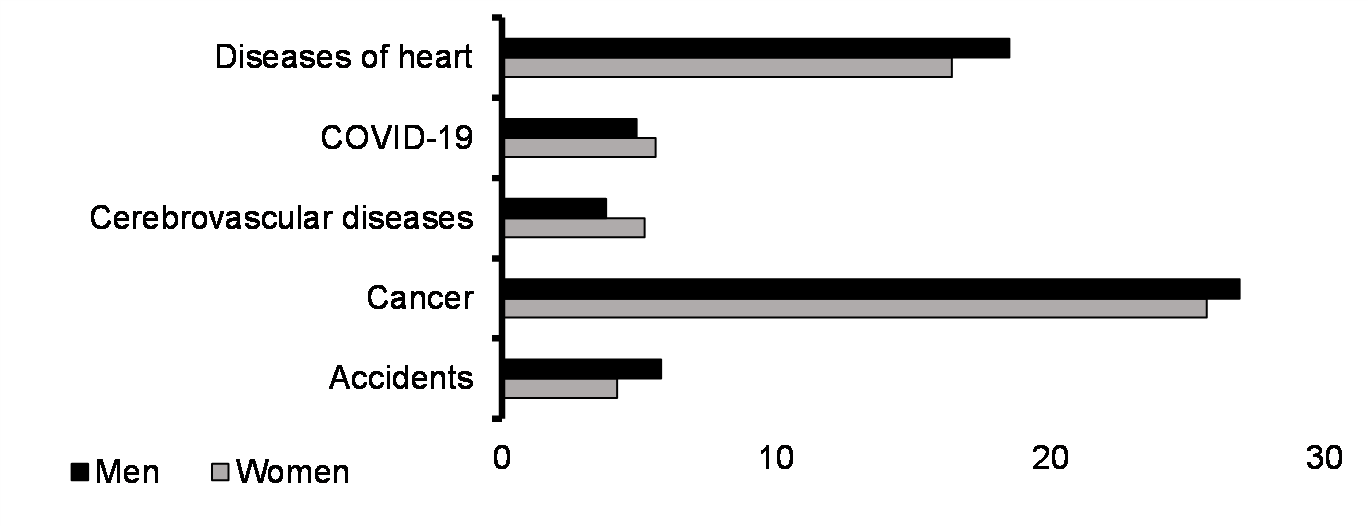
Distribution of leading causes of death (%, 2020)
Regular participation in sports (%, 2016)
Excellent or very good mental health (15+ yrs, %, 2017-18)
Sexually active and not using contraception (15-49 yrs, %, 2015-16)
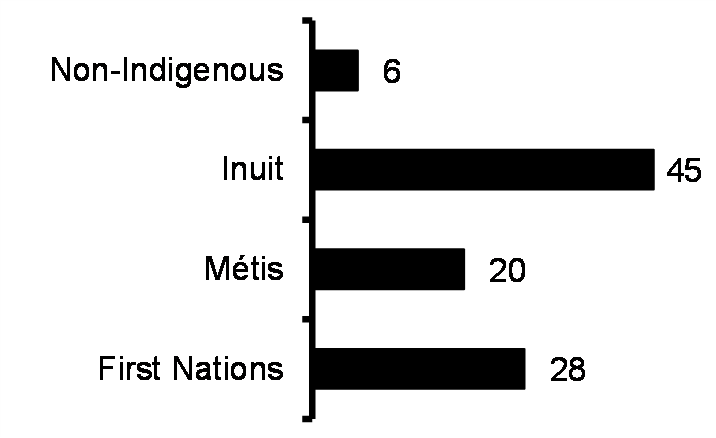
Live births (rate per 1,000, women aged 15-19 yrs)
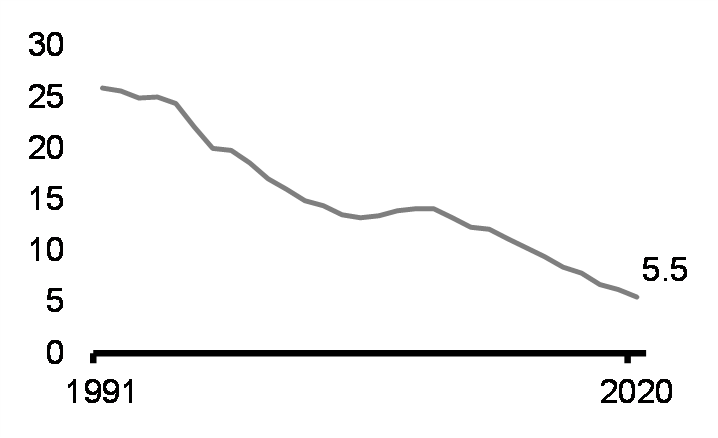
Mother before age 20 (%, 2011-12)***
Note: * indicates the use of different surveys within the same chart; use with caution. ** Indigenous includes only off- reserve Indigenous peoples. *** First Nations includes only off-reserve First Nations and non-Indigenous includes only Canadian born non-Indigenous.
Sources: Canadian Income Survey, Canadian Survey on Disability, Canadian Community Health Survey, Vital Statistics Death Database, General Social Survey, Vital Statistics Birth Database.
Poverty and poor health are challenges faced by many Canadians that have deep and wide-ranging impacts. As the dashboard above shows:
- Persons with disabilities, Indigenous peoples, and lone parents are more likely to face poverty, and related challenges, such as food insecurity and core housing need.
- Life expectancy in Canada is among the highest in the world, but Indigenous Canadians, especially Inuit men, face rates that are markedly lower.
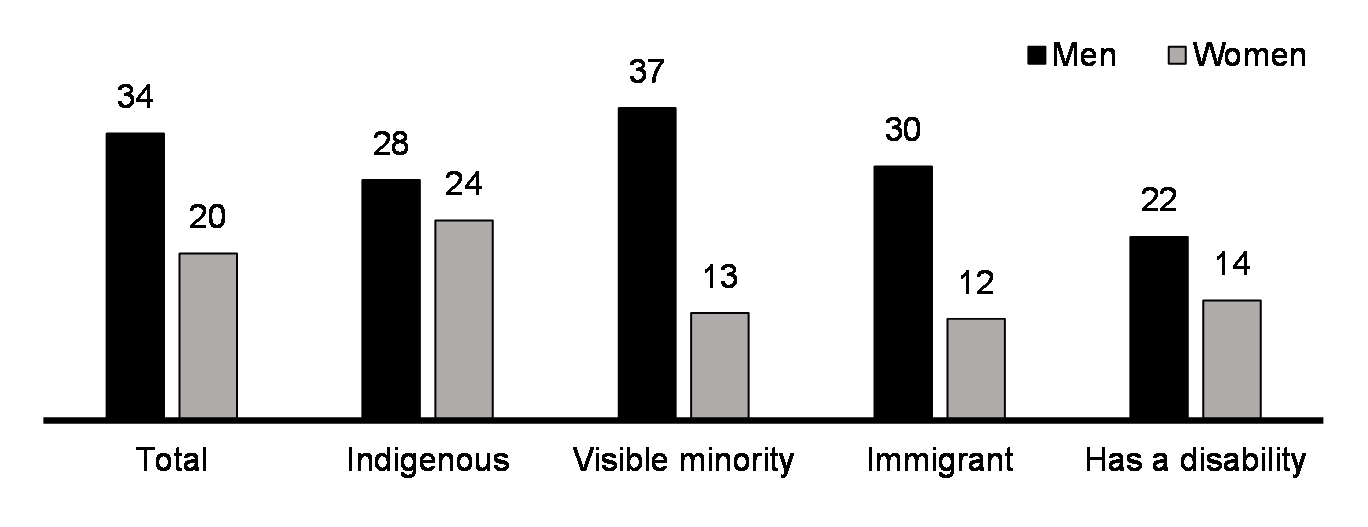
- Women are less likely to report regular participation in sports than men. Gaps between women and men are especially large for immigrant and visible minority women.
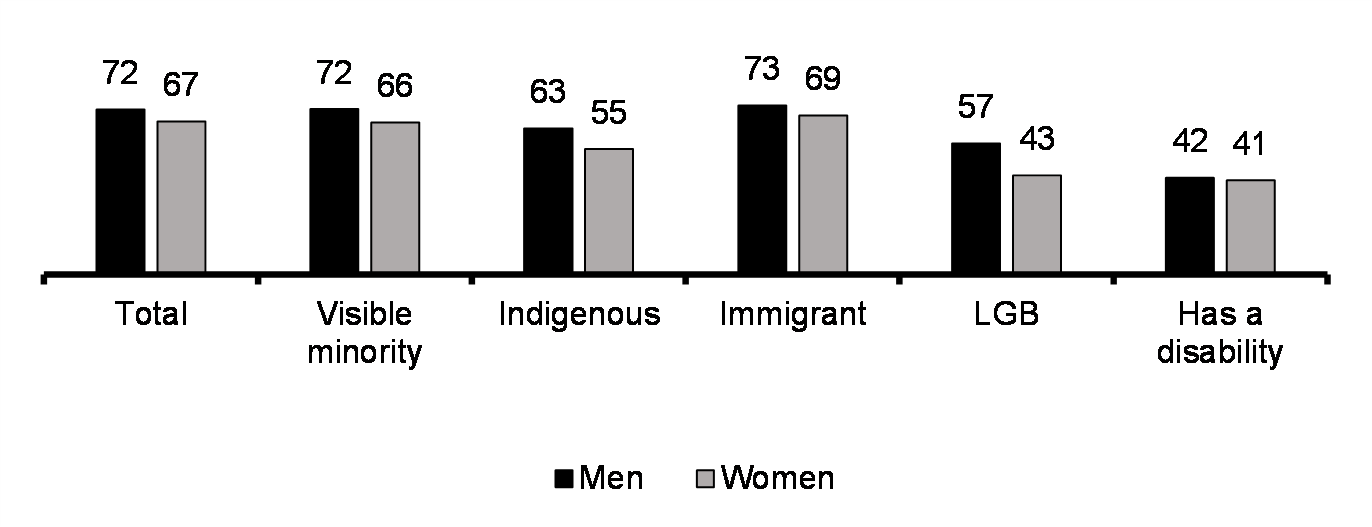
- Lesbian, gay, and bisexual people, Indigenous peoples, and people with disabilities are much less likely to report positive mental health. In all groups, positive mental health is reported less frequently among women.
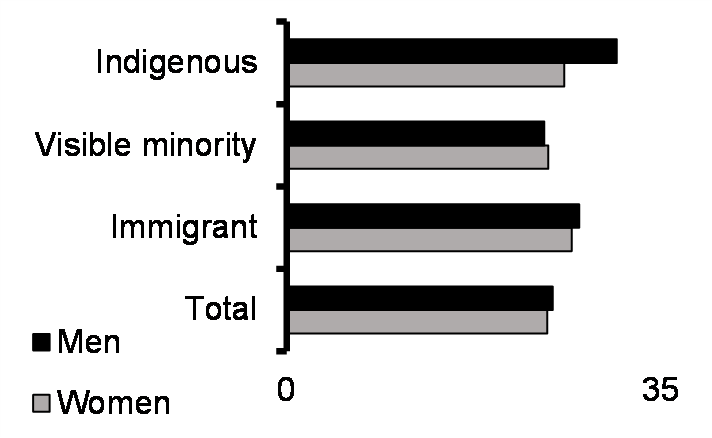
- Rates of early motherhood have declined significantly in the past three decades, but Indigenous women continue to face elevated rates of teenage pregnancy, especially Inuit women.
To reduce poverty and support the health and well-being of Canadians, the government has introduced a number of important investments for vulnerable individuals that improve access to food, housing and health resources, including mental health. The combination of these measures responds to the multidimensional nature of poverty.
Actions to Support Poverty Reduction, Health and Well-Being
- Between 2015 and 2020, more than two and a half million Canadians were lifted out of poverty. Reductions between 2015 and 2019 reflected economic growth and a number of measures like the Canada Child Benefit, an increase to the Guaranteed Income Supplement top- up for single seniors, and the Canada Workers Benefit. Reductions between 2019 and 2020 overwhelmingly reflect unprecedented and temporary government income support measures during the pandemic.
- As of December 2021, funding made available through the National Housing Strategy had been committed to create over 91,000 units, to repair over 209,000 units, and to provide affordability support to over 172,000 households, prioritizing those in greatest need, including seniors, Indigenous peoples, people experiencing or at risk of homelessness, and women and children fleeing violence. More than 26 per cent of funding committed to date has been for projects focused on meeting the housing needs of women and their children.
- Since November 2015, 131 long- term drinking water advisories have been lifted and 212 short- term drinking water advisories have been prevented from becoming long-term.
- Beginning the development of a mental health fund for Black public servants, and improving cultural sensitivity of existing mental health supports for Black employees and other equity- deserving groups.
- Introducing a national pilot project for a Menstrual Equity Fund to make it easier for people who menstruate to fully participate in school, work, and society.
- Advancing the National Housing Co-Investment Fund to accelerate the creation of up to 4,300 new units and the repair of up to 17,800 units.
- Introducing significant investments in affordable housing and reducing homelessness, including through the Rapid Housing Initiative and Reaching Home.
- Maintaining trauma-informed, culturally appropriate, Indigenous- led services to improve mental wellness for Indigenous peoples and their communities and supporting continued efforts to co-develop distinctions-based mental health and wellness strategies.
*Please refer to the Impacts Report to see other Budget 2022 investments that are expected to advance this pillar.

Gender Results Framework
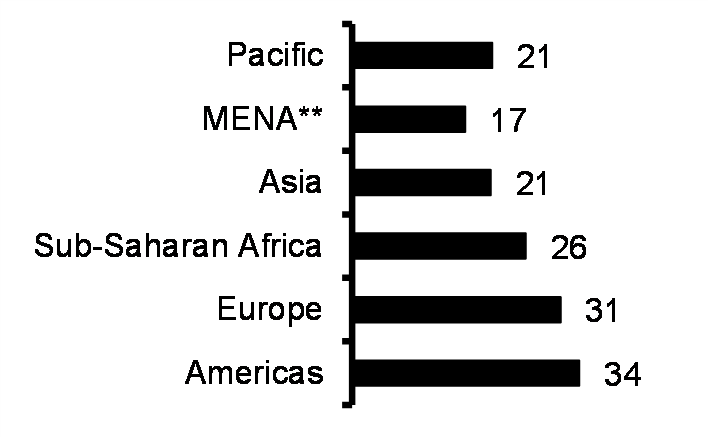
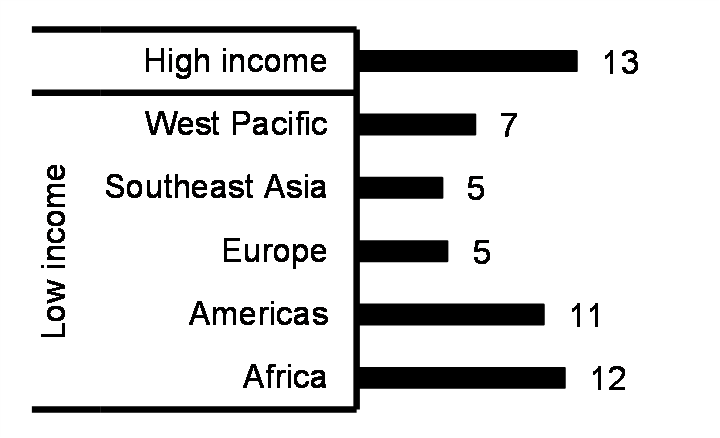
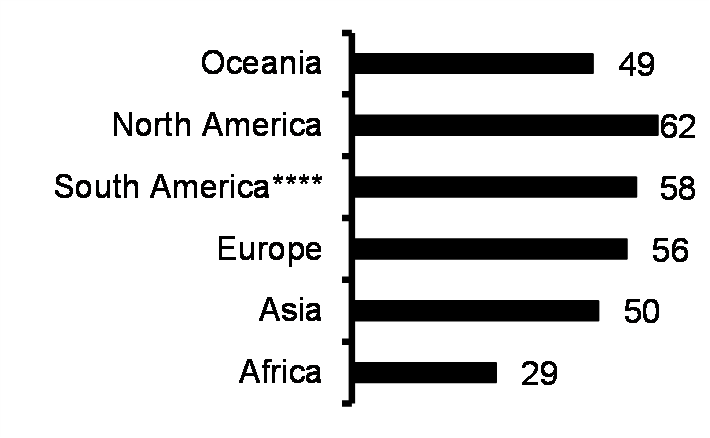
Pillar: Gender Equality Around the World
Goal: Promoting gender equality to build a more peaceful, inclusive, rules-based, and prosperous world
Canada believes that women and girls are powerful agents of change. With the proper resources and opportunities, they can improve their own lives and the lives of their families, communities, and countries.
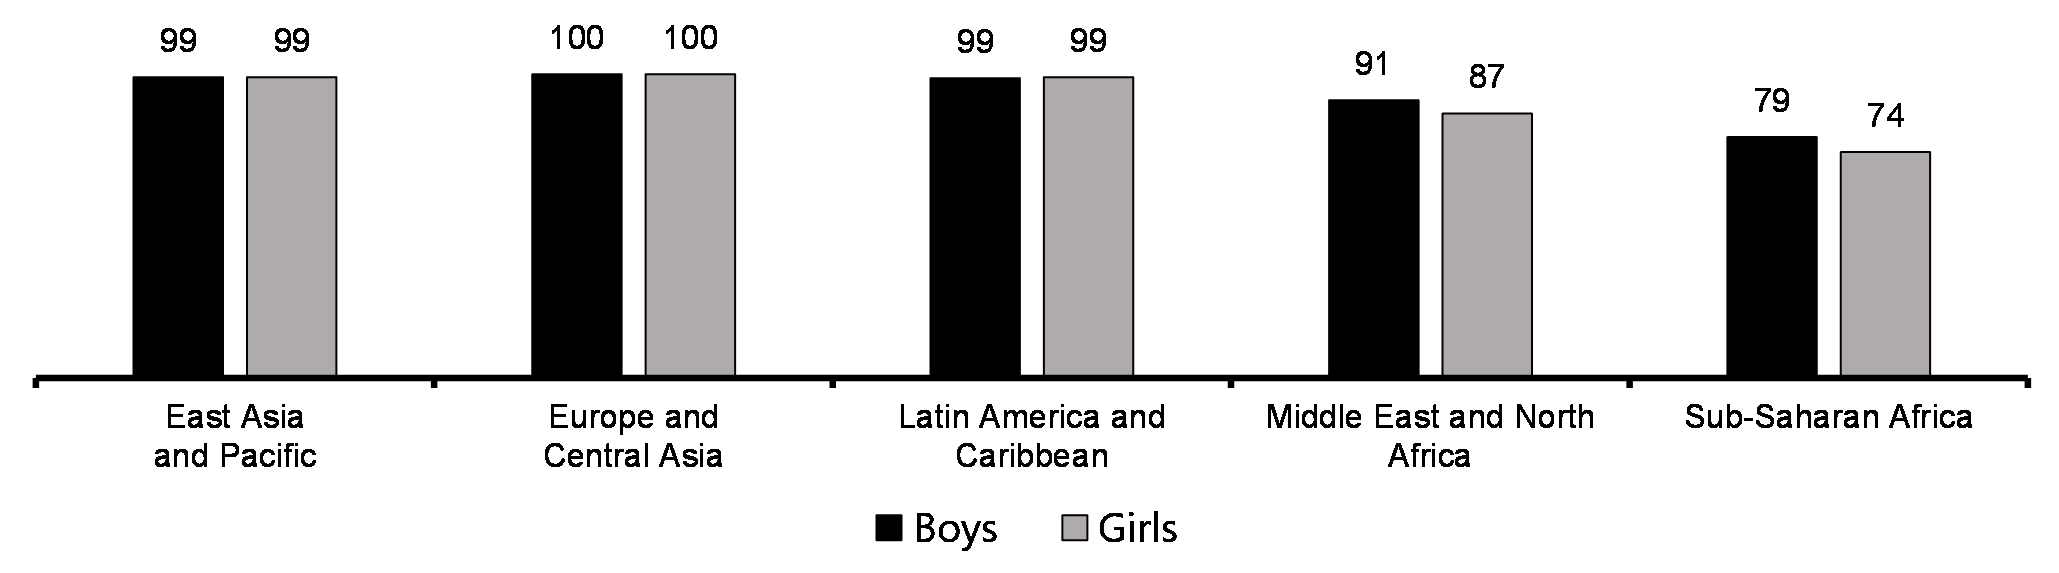
Education and skills
(15-24 yrs, %, excl. high income countries, 2020)
Economic participation and prosperity
Leadership and democratic participation
Female genital mutilation (0-14 yrs, %, 2020 or latest)***
Non-partner sexual violence (15-69 yrs, %, 2010)
Contraceptive prevalence (women, 15-49 yrs, %, 2019)
Note: * Data for Oceania exclude New Zealand and Australia. ** MENA indicates Middle East and North Africa. *** Data represent a weighted average of 19 countries with shares over 3 per cent. **** South America includes Latin America and the Caribbean.
Sources: United Nations Peacekeeping, Inter-Parliamentary Union, UNICEF, World Bank, World Health Organization, International Labour Organization, United Nations.
Although gender equality around the world has dramatically improved over time, there is much work to do. As the dashboard above shows:
- Literacy rates remain lower for girls than for boys, especially in certain regions.
- Women in all regions of the world participate less in the labour force than men and remain underrepresented in national parliaments.
- In many countries, women have no legal protection against dismissal due to pregnancy, sexual harassment, or gender discrimination, and they have no recourse to legislation guaranteeing them equal pay for work of equal value.
- Large numbers of women and girls continue to experience female genital mutilation and sexual violence.
To promote gender equality and build more peaceful, inclusive and rules-based societies, women and girls need to be afforded meaningful opportunities to participate in the economy and society. To support this, Canada’s investments both domestically and abroad have targeted the elimination of economic and social barriers that impede women’s meaningful participation in the labour market, politics, business, and leadership.
Actions to Support Gender Equality Around the World
- The Women’s Voice and Leadership Program supports more than 800 local women’s rights organizations working to advance gender equality and empowers women across 31 developing countries and regions.
- Canada's diplomatic representation has made progress towards gender balance. In 2021, 47 per cent of heads of missions were women, up from 32 per cent in 2015—
this includes ambassadors, high commissioners, and consuls general. - Business Women in International Trade led 19 trade missions in 2020-21 involving 254 participants from women-owned businesses and business support organizations. This compares to 8 trade missions involving 85 participants in 2018-19.
- Supporting vulnerable persons in Ukraine through humanitarian assistance.
- Providing further support to the Access to COVID-19 Tools Accelerator to ensure that Canada continues to provide its fair share in support of global efforts to improve access to vaccines, therapeutics, and other tools to fight COVID-19.
- Providing support to address global health security priorities, such as infectious disease prevention and response.
*Please refer to the Impacts Report to see other Budget 2022 investments that are expected to advance this pillar.
Canada’s Quality of Life Framework
The Quality of Life Framework supports inclusive and sustainable growth, ensuring that the government’s focus on the quantity of growth is complemented with consideration of the quality of growth; that is, ensuring that the purpose of growth is to meaningfully improve the well-being of people who live in Canada.
Public opinion research commissioned by the Department of Finance in August 2020 to inform framework development found that 86 per cent of respondents believed it was either very important (71 per cent) or somewhat important (15 per cent) for the federal government to move beyond solely traditional economic measurements.
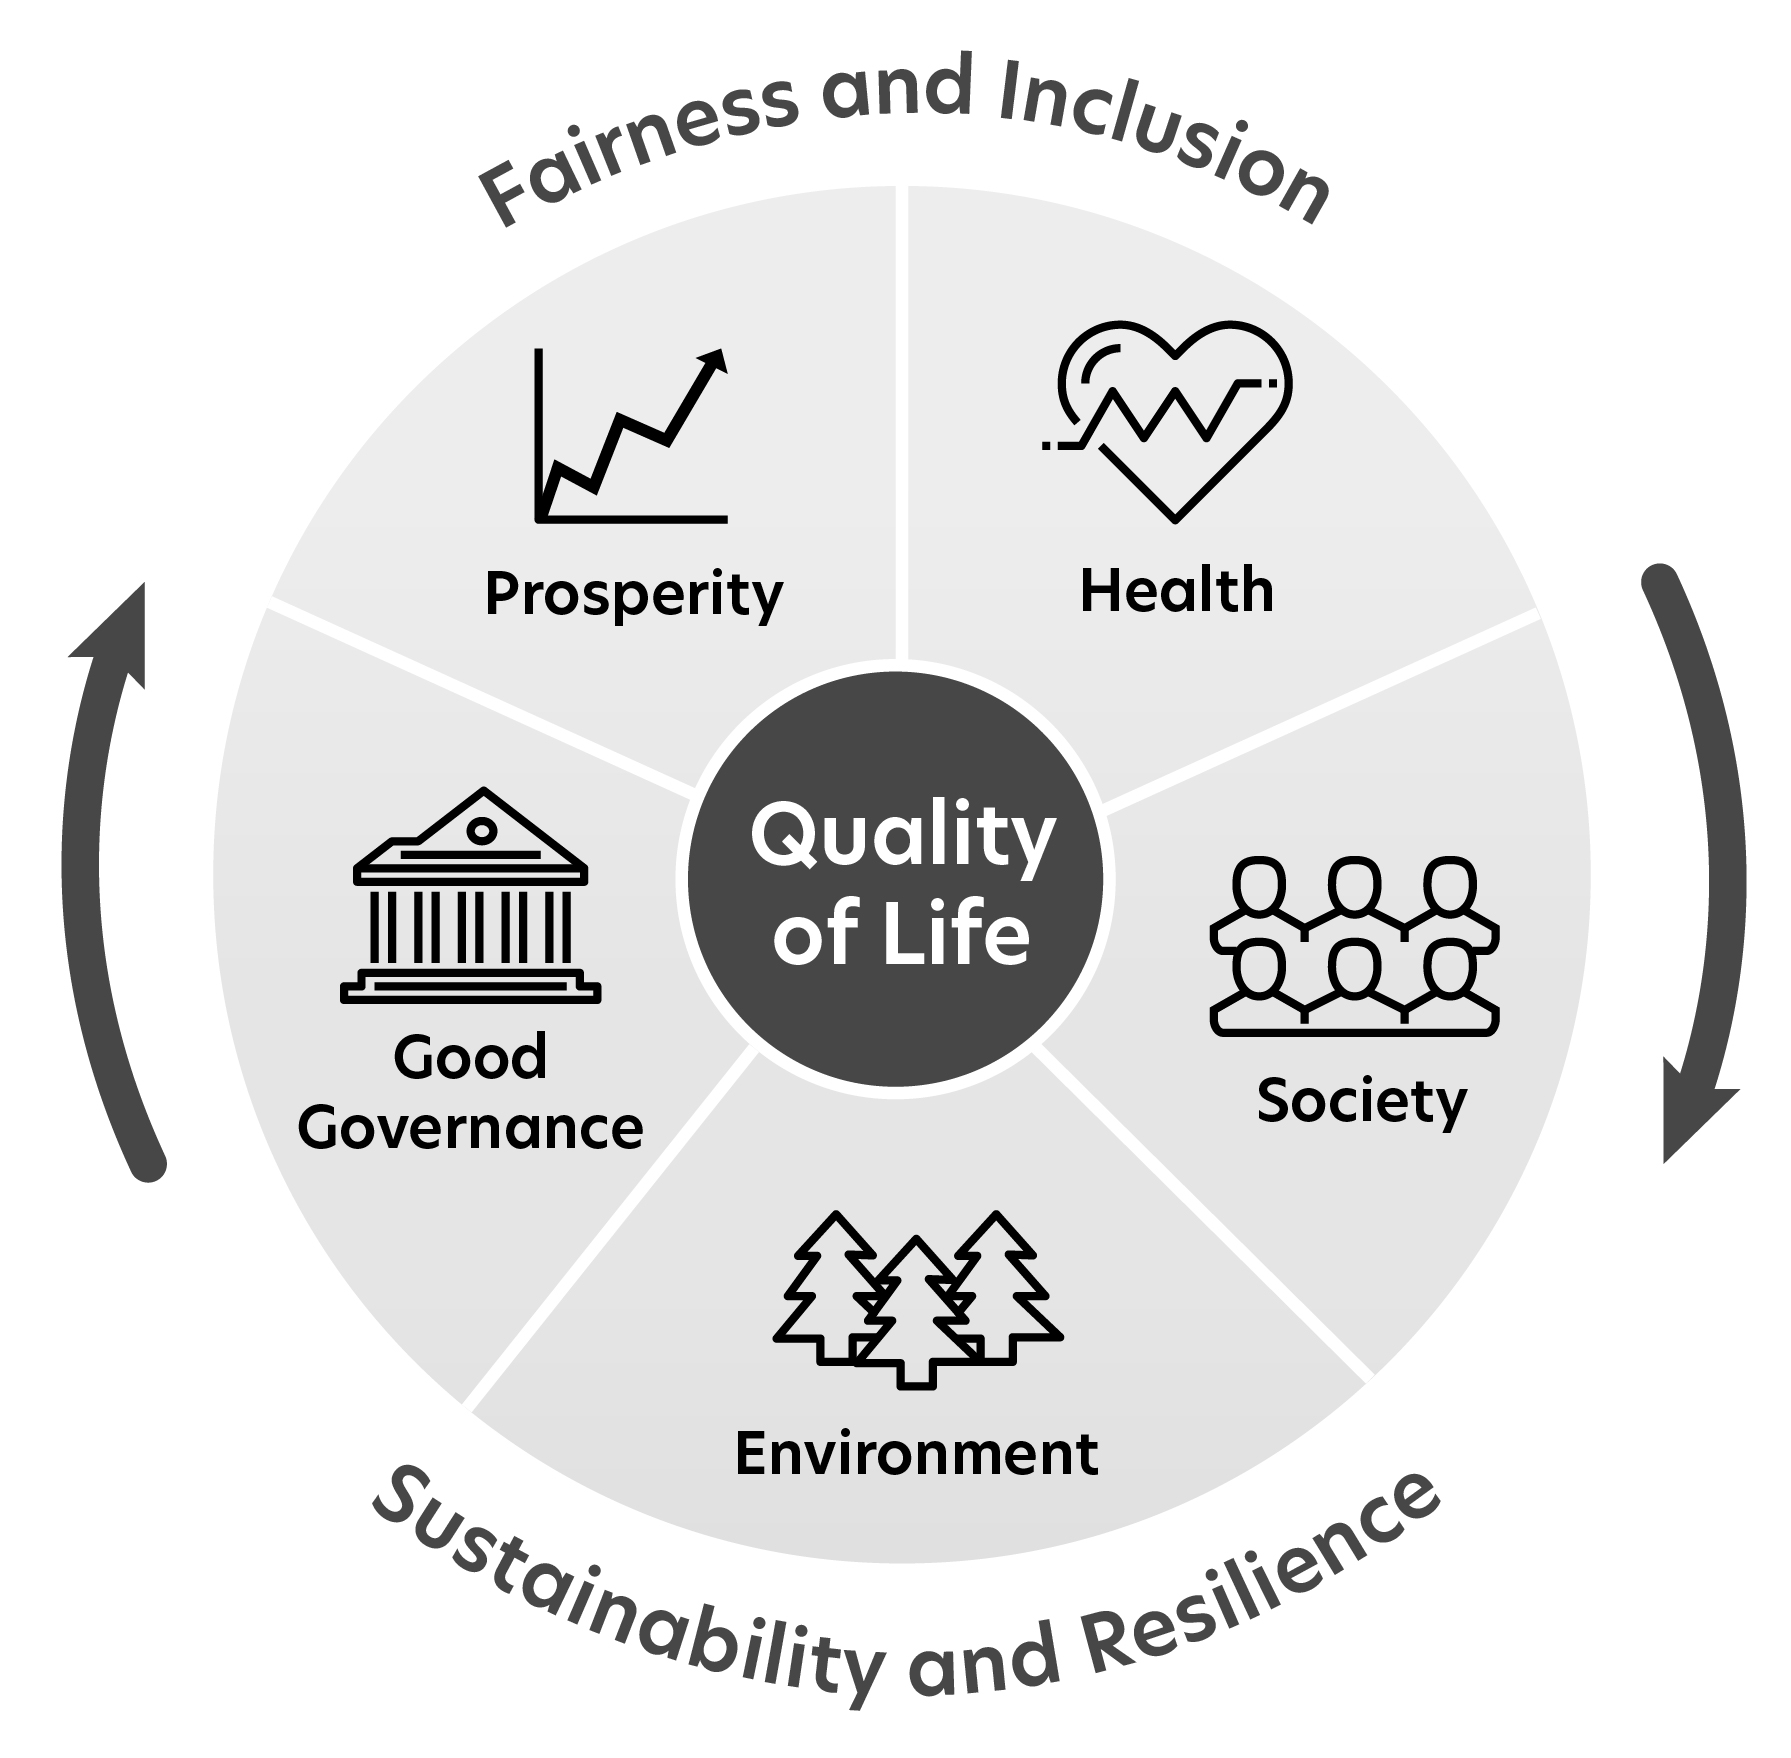
Drawing on the evidence of what makes for a good quality of life, the Framework is composed of five interrelated domains— prosperity, health, society, good governance, and environment— along with two cross-cutting lenses, the fairness and inclusion lens, and the sustainability and resilience lens. Taken as whole, the Framework provides a structured means for the government to think in an integrated, inclusive, and long- term way about how its decisions impact the lives of Canadians.
Fundamentally, the Framework is about measuring what matters most to Canadians through a suite of 85 indicators that take a holistic view of societal progress. With this in mind, Budget 2021 made a series of significant investments aimed at improving federal data sets. One year later, these investments are helping fill key gaps in our knowledge about how Canadians have been experiencing their lives, including through tools like Statistics Canada’s quarterly Canadian Social Survey. These investments help to better understand important issues like the experience of loneliness among Canadians, unpaid work and family time, and the extent to which Canadians experience meaning and purpose in their lives.
On March 30, Statistics Canada launched the beta version of its new Quality of Life Hub, a first step towards bringing together key economic, social, and environmental datasets with a simple and intuitive user interface. Concurrently, historic investments in disaggregated data will ensure that breakdowns of these and other key data are available for different groups. Investments in Indigenous-led data strategies are an enabler for self-determination. Moreover, a Census of the Environment will catalogue all ecosystems in Canada.
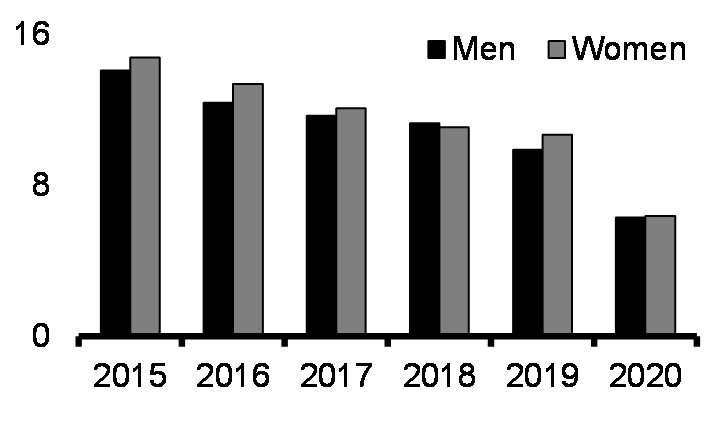
Selected Indicators of Well-Being Before and During COVID-19
While economic indicators have rebounded from the pandemic shock relatively quickly, some well-being outcomes are recovering more slowly, including self-reported mental health. Budget 2022 builds on previous investments to help Canadians access mental health supports and services.
Charts 1 and 2
Mental Health, Life Satisfaction, and Overall Health, Population Aged 15 Years and Over, Per Cent
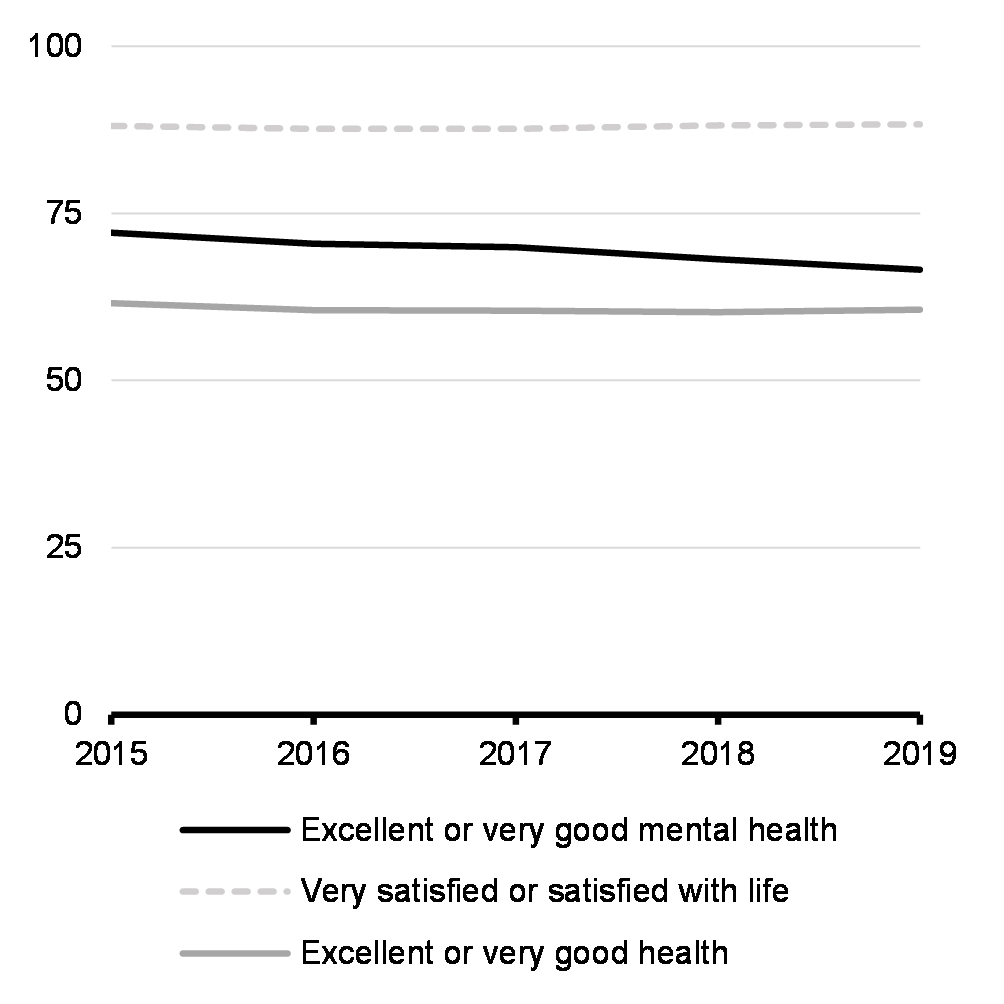
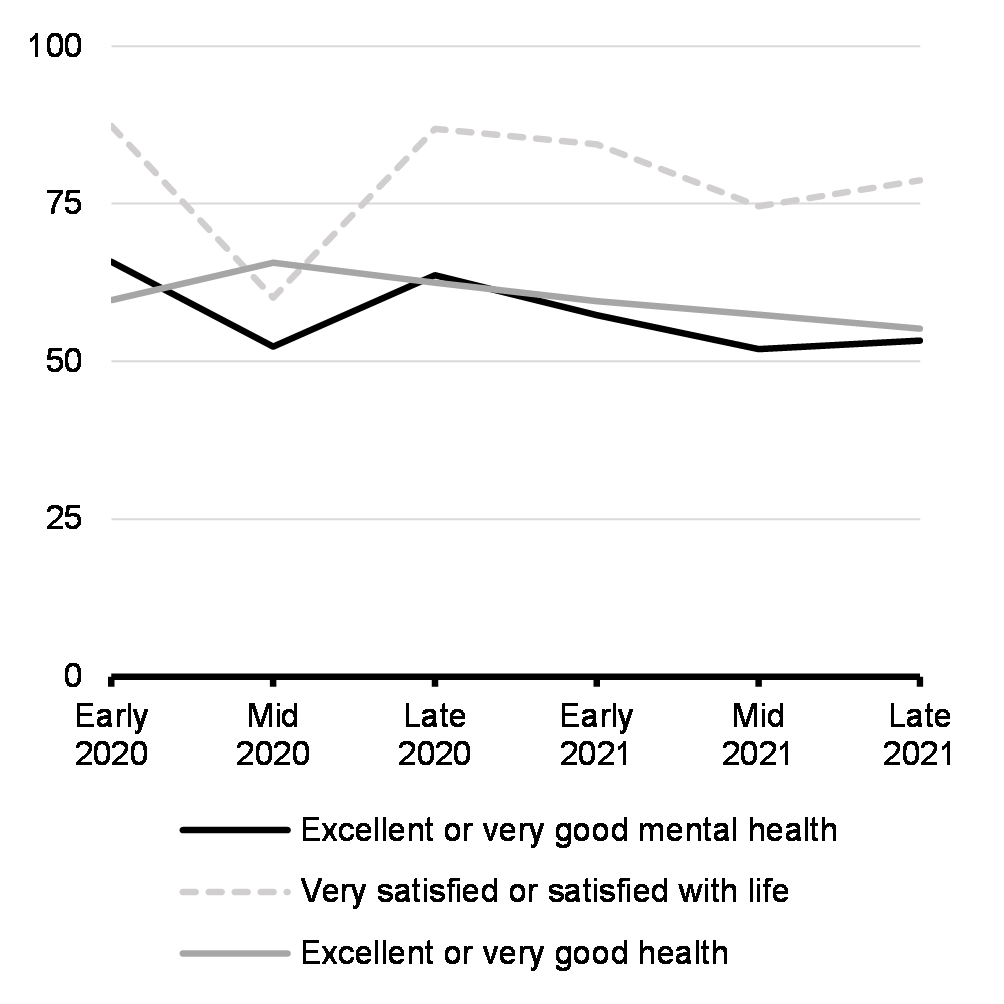
Combined, these and other quality of life indicators paint an overall picture of how Canadians are doing that can inform priority-setting for policy
development. The Quality of Life Framework builds on Canada’s world-leading Gender-based Analysis Plus approach by introducing a standardized set of domains and indicators to bring a more structured and consistent approach to assessing the nature as well as the distribution of impacts.
Summary of Budget 2022’s Gender, Diversity, and Quality of Life Impacts
The government is committed to applying Gender-based Analysis Plus (GBA Plus) and quality of life indicators in decision-making, to ensure that policies and programs take into account impacts on people from a variety of perspectives. Results of this analysis are included in the Impacts Report, and summarized in this section.
Timing of GBA Plus and Responsive Approaches
When GBA Plus Was First Performed
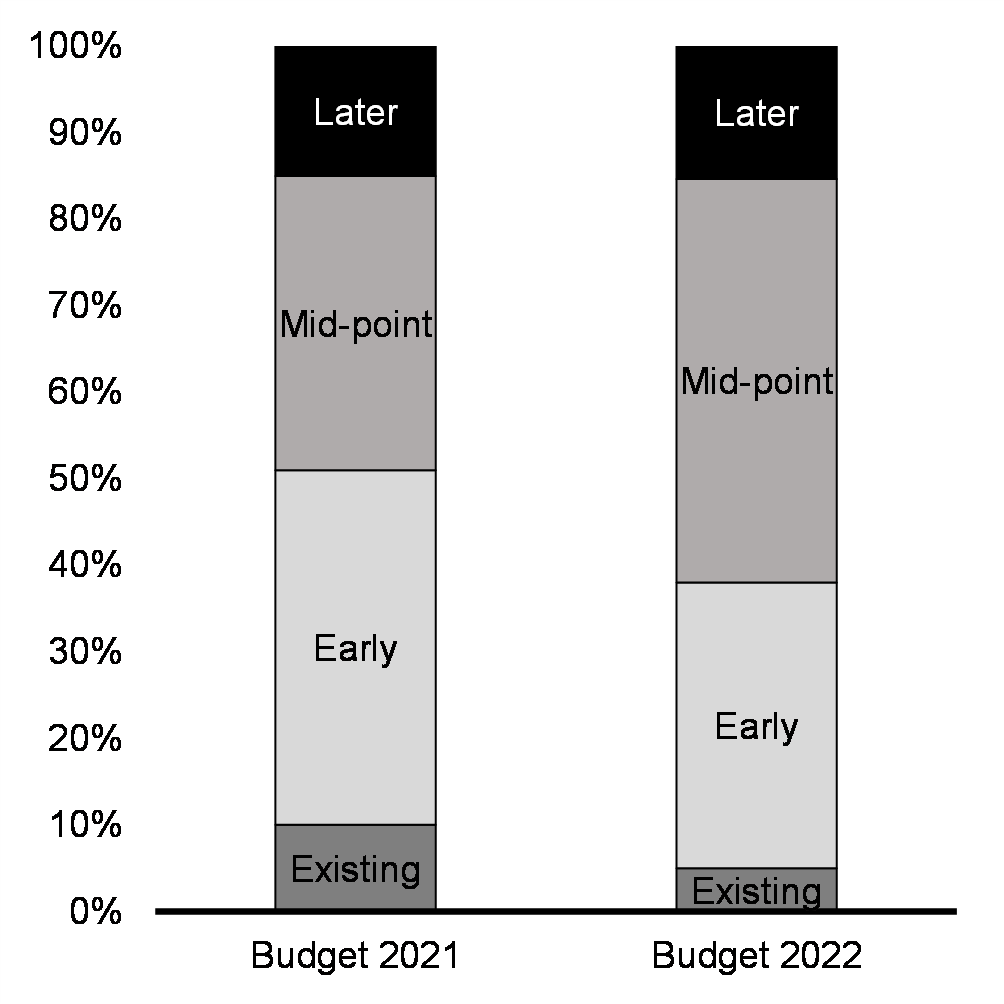
GBA Plus for Budget 2022 measures were conducted in a timely manner overall, with this analysis being performed either early or at the mid- point of policy development. The timing of such analysis reflects the change in the GBA Plus landscape across the federal government over the last few years, as demonstrated by the experiences of Budget 2021 and the current budget, where gender and diversity analysis has been increasingly integrated at earlier stages of the policy process. Of note, the greater share of analysis performed at the mid-point stage in this budget is due to a number of measures which are extensions of existing programs. In these cases, the existing analysis was relied upon and updated as necessary. Women and Gender Equality Canada will continue to provide training, tools, and resources to foster best practices in GBA Plus, including timely analysis.
Responsive Approaches
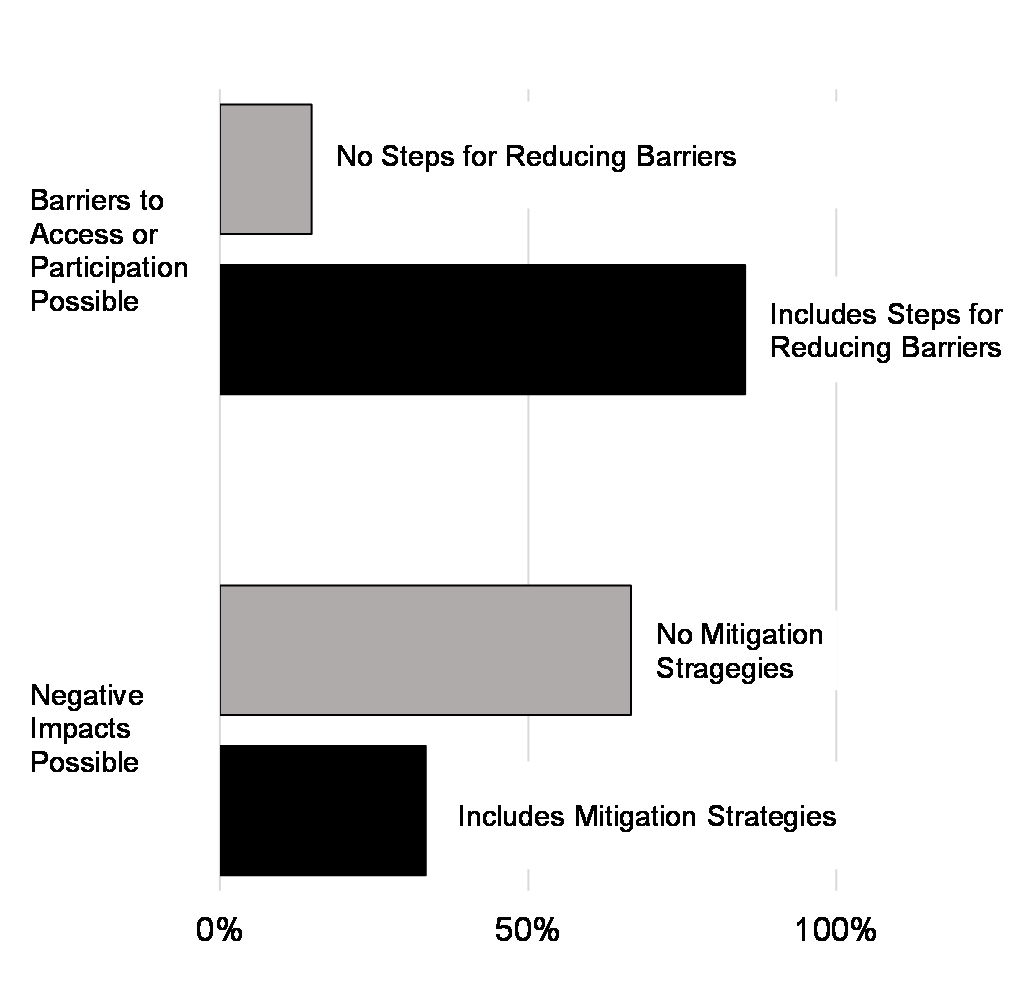
Gender and diversity analysis helps identify barriers to access or participation, as well as unintentional negative impacts. Where identified, program design should incorporate steps to lower these barriers, or mitigate negative impacts (if unintentional). 12 per cent of Budget 2022 measures identified a potential barrier to access or participation for a specific demographic group. Of these, the majority (85 per cent) included steps towards reducing these barriers. Only 10 per cent of Budget 2022 measures identified possible negative impacts on a specific population. Of these, nearly one third included mitigation strategies. In cases where no mitigation strategy was included, this was often as a result of a policy designed to level the playing field or create greater equity by addressing unproductive or unequitable practices, in areas such as the tax system. An example of this are the new rules to ensure profits from flipping properties are subject to full taxation.
Target Population
Share of Budget 2022 Investments
($ value of measures*)
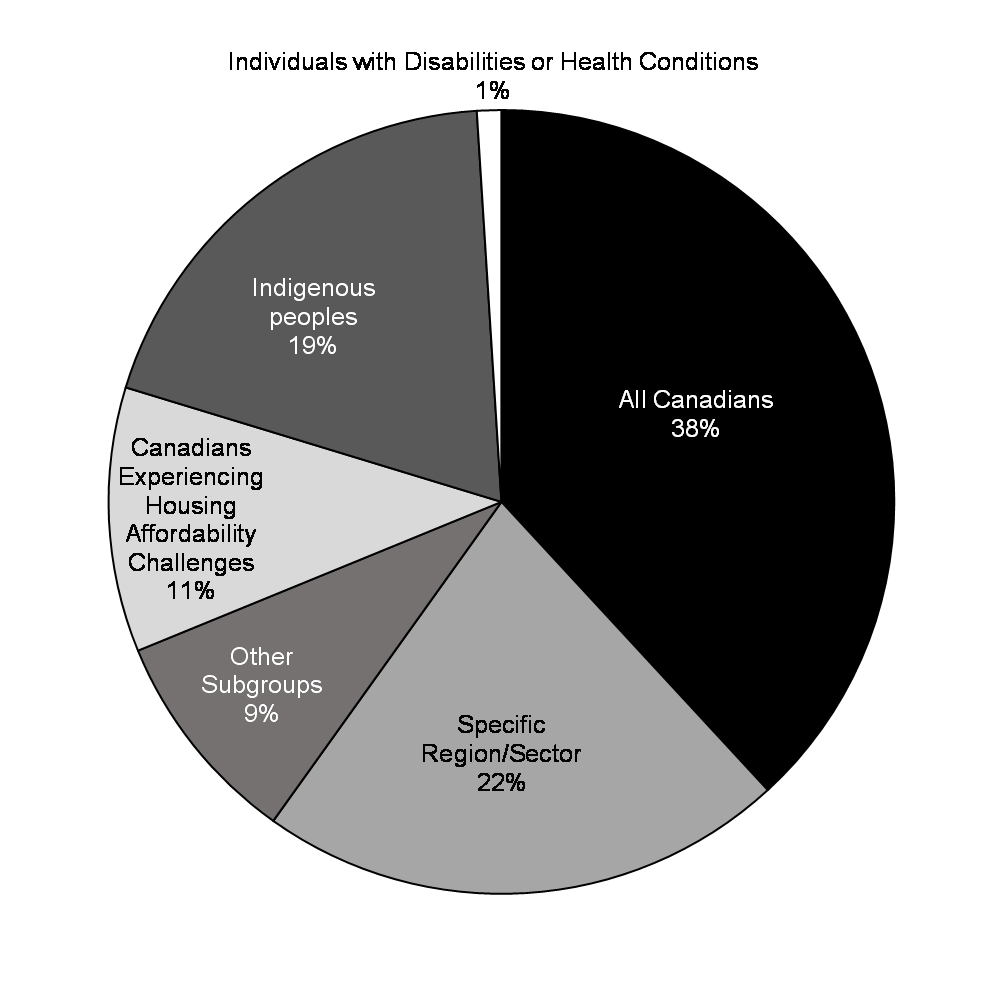
A sizable share of Budget 2022 investments target all Canadians (38 per cent of the budget). Other measures target a region or sector (22 per cent of the budget), or a specific group of the population (40 per cent of the budget)—including Indigenous peoples, people with disabilities or health conditions, Canadians experiencing housing affordability challenges, and other groups. Some measures target more than one group. For example, Renewing and Expanding the Oceans Protection Plan is expected to target specific regions and Indigenous peoples. Targeted support is often aimed at challenges or opportunities unique to subgroups of Canadians. For example, targeted support for Indigenous peoples is expected to address housing in Indigenous communities and critical community infrastructure on reserves including water and wastewater systems, and the launch of a new Veteran Homelessness Program will provide services and rent supplements to veterans experiencing homelessness.
Expected Benefits: Gender
Share of Budget 2022 Investments
($ value of measures*)
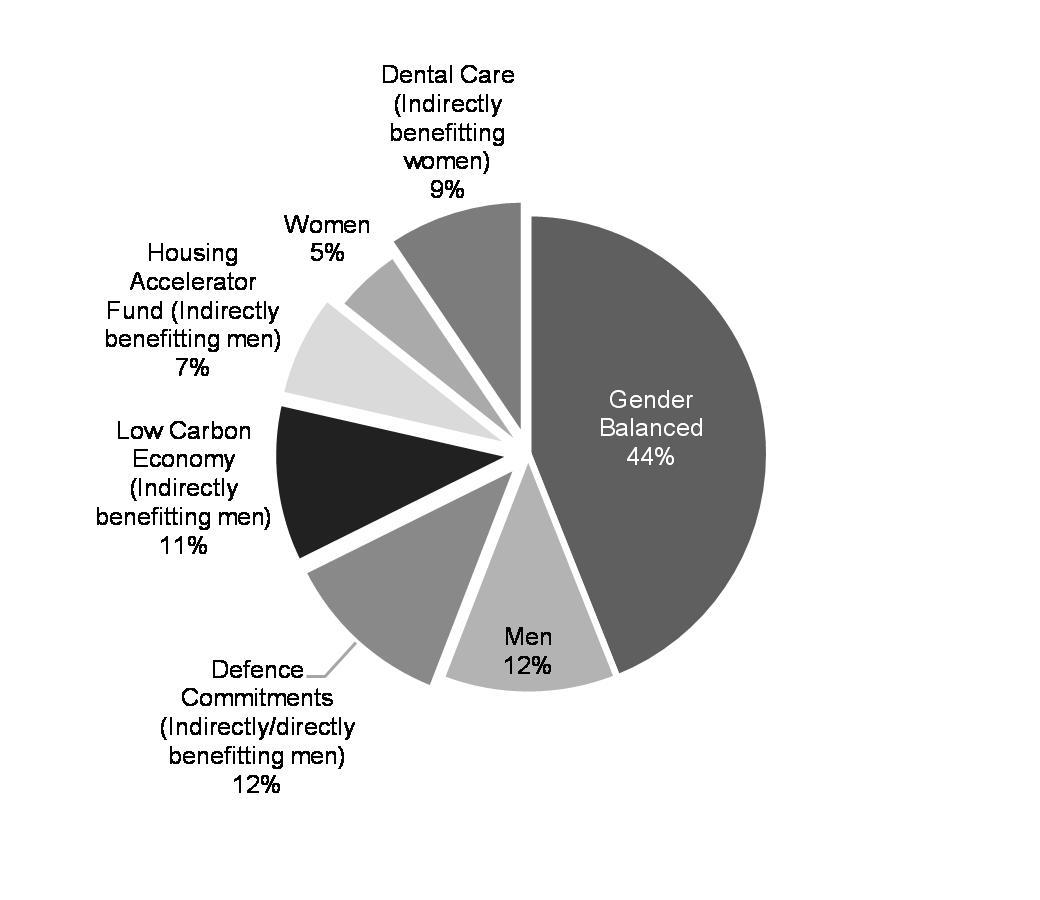
Nearly half of Budget 2022 measures are expected to benefit women and men in equal proportions (44 per cent). The remaining measures (42 per cent) are expected to directly or indirectly benefit men, while a smaller share (14 per cent), would directly or indirectly benefit women. This relative disparity reflects the fact that men are overrepresented in certain sectors benefitting from many of the climate and infrastructure related measures in this budget. Although these measures will ultimately benefit all Canadians, the workforce in these sectors are predominantly men, who, in turn, will indirectly benefit from the increased economic opportunities associated with these investments. For example, the construction and clean technology sectors are indirectly benefitting from the Low Carbon Economy Fund Expansion, while the agricultural sector is directly benefitting from the expansion of the Agricultural Clean Technology Program.
Workers in all three of these sectors are predominantly men. Similarly, all Canadians will benefit from enhanced safety and security resulting from increased defence spending, and these investments will also directly enhance the capabilities and capacity of members within the Canadian Armed Forces. Overall, however, the Canadian military is still predominantly men—in 2020 for instance, the representation of women in the Canadian Armed Forces was only 16 per cent for Regular Force and Primary Reserve members.
This disparity also arises from the fact that on average men continue to have higher income levels than women. For example, for zero-emission vehicles, income is one of the factors driving adoption. Men are therefore more likely to benefit the Incentives for Zero- Emission Vehicles Program. Finally, a lack of gender parity among certain sectoral business owners and shareholders results in men disproportionately benefitting from certain measures including the Investment Tax Credit for Carbon Capture, Utilization, and Storage and the Critical Mineral Exploration Tax Credit. This highlights that gender segregation in the workforce and an imbalance in control of and ownership over resources is still prevalent in Canada.
That said, many of the Budget 2022 investments are expected to directly or indirectly benefit women given the composition of the workforce. For example, women comprise nearly eight out of ten workers in the dental sector and are therefore expected to indirectly benefit from investments in Dental Care for Canadians. Other Budget 2022 measures include features that will serve to achieve greater gender equality over time. For example, the doubling of the Union Training and Innovation Program is expected to increase the number of women and other equity-deserving groups in high-paying skilled trade jobs. Additionally, funding to Support Cultural Change in the Canadian Armed Forces is expected to create a healthier, more diverse, responsive, and open climate within the Canadian military. This is expected to ultimately translate to greater representation of women and other underrepresented groups across the Canadian Armed Forces and in leadership positions. Where women face barriers to entry, retention, or advancement in the sectors being funded there are, for a number of measures, program or policy design elements that will be introduced, or are already in place, to address these barriers. These are highlighted in the Impacts Report. For example, each of Canada’s Innovation Clusters undertakes ecosystem building activities that support the economic inclusion of underrepresented groups. Similarly, the development of the Canada Green Buildings Strategy will include training and capacity- building support specifically for equity-deserving groups, including women, in order to try to increase representation in the energy efficiency workforce. Lastly, the CAN Health Network recognizes that its support to scale-up health focused small and medium-sized businesses will not directly address the challenges women and other underrepresented groups face in working in or owning businesses in the health technology and life sciences sectors. CAN Health Network will therefore support women and other underrepresented groups through development opportunities, and provide information to participating companies about government programs to help them diversify their workforces.
Finally, Budget 2022 builds on the foundational investments towards greater gender equality introduced in Budget 2021, including additional funding to support the implementation of the Canada-wide Early Learning and Child Care System, which is expected to increase women’s labour market participation. This budget also invests funding to support provincial and territorial governments in advancing the National Action Plan to End Gender-Based Violence and introduces a pilot for a Menstrual Equity Fund to make it easier for people who menstruate to fully participate in school, work, and society.
Expected Benefits: Additional Characteristics
Expected Direct and Indirect Benefits by Subgroup, Number of Measures
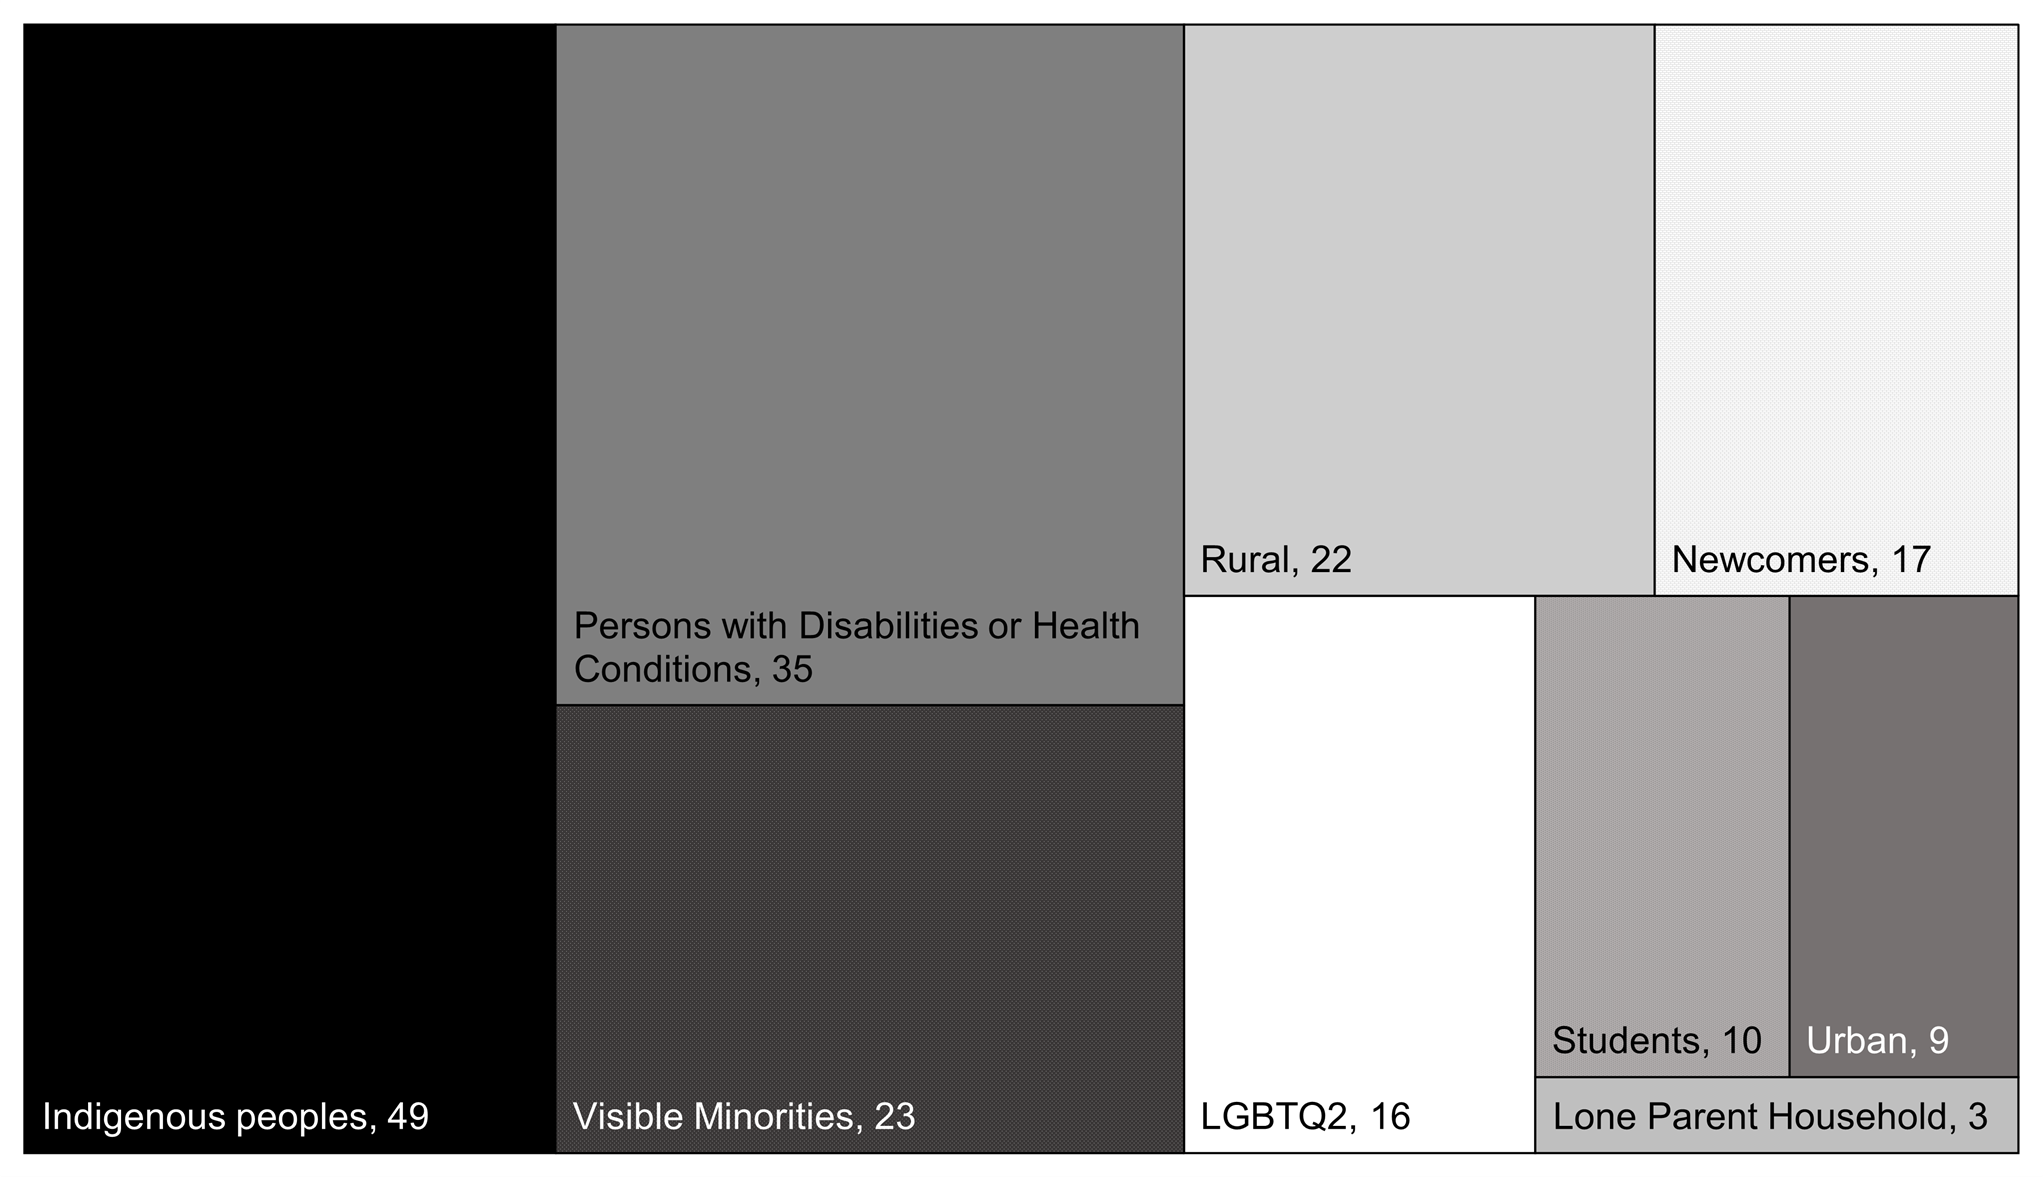
Budget 2022 measures were assessed in terms of expected direct and indirect benefits for various subgroups of Canadians, which are highlighted in Chart 7. A number of measures in this budget are identified as benefitting persons with disabilities, most notably the Employment Strategy for Persons with Disabilities, which is designed to address the labour market barriers faced by persons with disabilities. Similarly, Indigenous peoples are expected to directly benefit from a large number of measures, including support for Distinctions-based Mental Health and Wellness strategies, to improve housing and access to clean water, and help Indigenous communities build sustainable revenue streams for the future. Budget measures can also benefit more than one group or a subgroup with intersecting identities. For example, Speeding up Housing Construction and Repairs for Vulnerable Canadians will benefit Canadians experiencing housing affordability challenges. There is evidence that women-led households have a higher incidence of core housing need compared to men-led households. This gap becomes larger when intersecting factors are taken into account—e.g., whether a single parent, or a member of a racialized group. Additionally, certain subgroups who experience greater challenges accessing affordable housing will disproportionately benefit from this measure. These subgroups include persons with disabilities and Indigenous peoples.
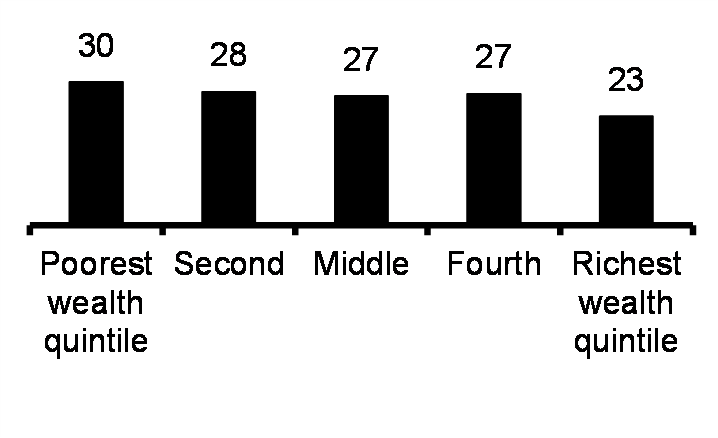
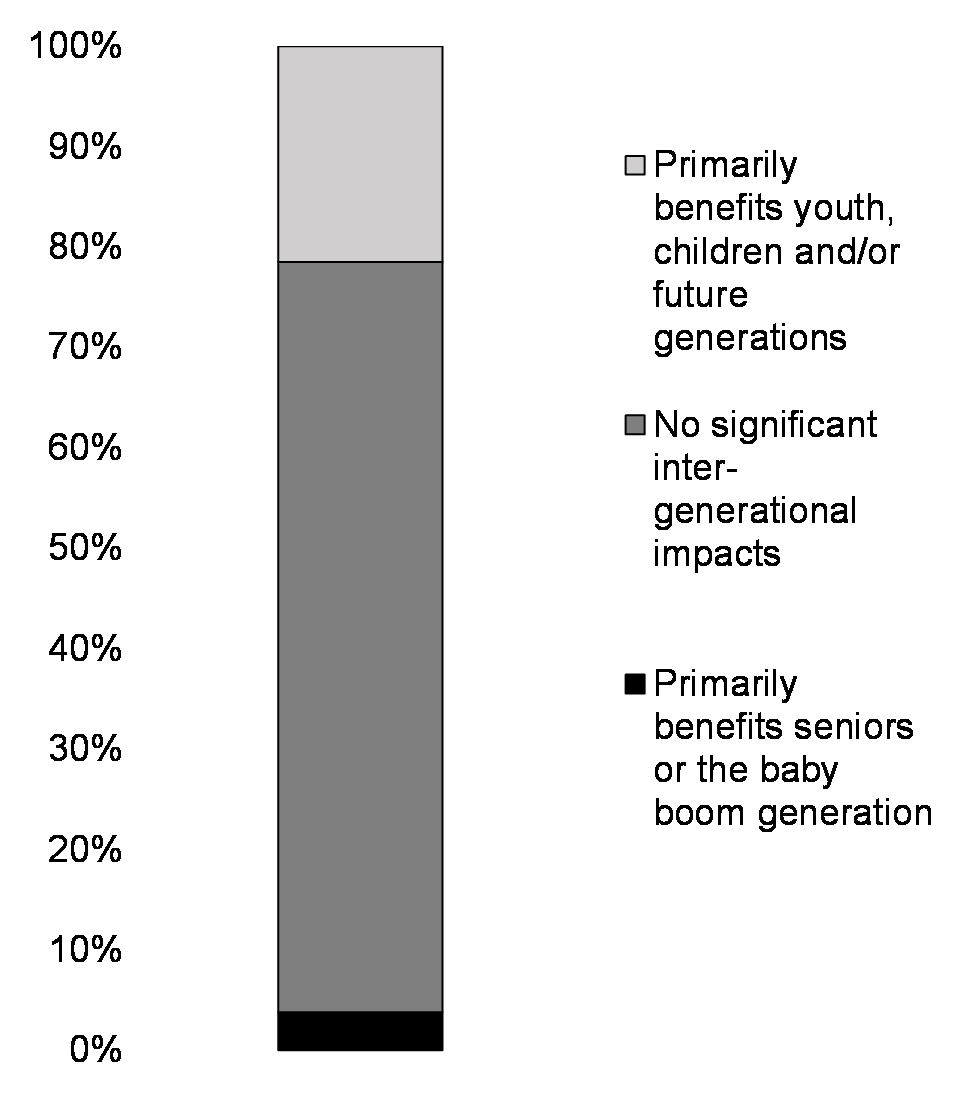
Expected Benefits: Intergenerational and Income Distribution Impacts
Expected Intergenerational Benefits, Share of Budget 2022 Investments
($ value of measures*)
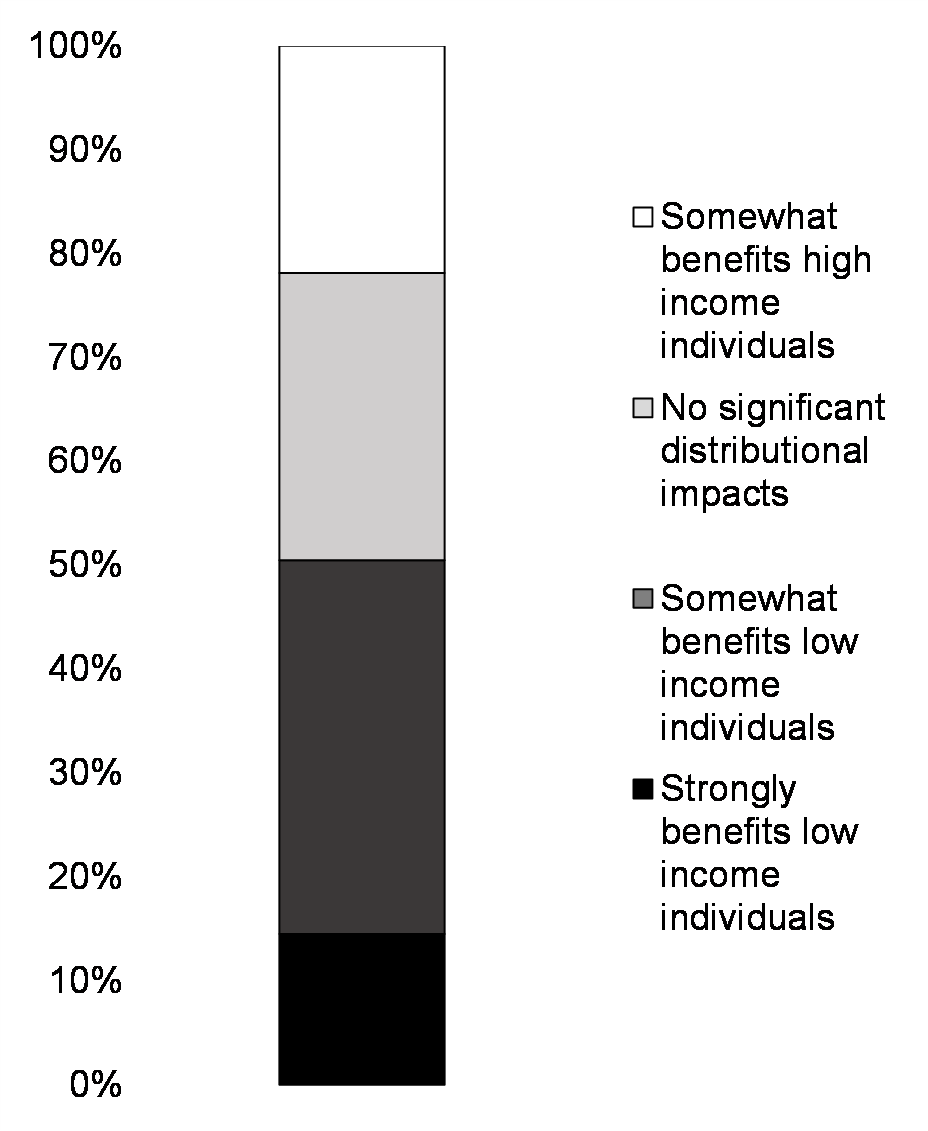
Expected Income Distribution Impacts, Share of Budget 2022 Investments
($ value of measures*)
Consideration was given to how each Budget 2022 measure could affect different generations of Canadians and Canadians with varying income levels. The majority of measures introduced in this budget (75 per cent of the value of Budget 2022 measures) are expected to benefit all generations equally. A significant share (22 per cent), however, are expected to disproportionately benefit youth, children or future generations, reflecting in part the number of investments in climate related measures. For example, the expansion of the Low Carbon Economy Fund will particularly benefit future generations. Additionally, the introduction of an Employment Strategy for Persons with Disabilities through the Opportunities Fund is expected to disproportionately benefit young people with disabilities entering the labour market. Other specific measures in Budget 2022 would benefit seniors or older generations relatively more than other age groups. Notable measures include funding to address backlogs for surgeries and procedures. Seniors have higher needs for surgical procedures, representing over 40 per cent of total monthly surgical volumes, both before and during the COVID-19 pandemic, despite comprising only 19 per cent of the Canadian population.
Half of Budget 2022 investments are expected to benefit lower income Canadians. For example, the extension of the Rapid Housing Initiative is expected to strongly benefit low income individuals. The remainder of investments will either have no significant distributional impacts (28 per cent) or are expected to benefit higher income Canadians (22 per cent). For example, many business supports and incentives, including the creation of a Canadian Innovation and Investment Agency and the Investment Tax Credit for Carbon Capture, Utilization, and Storage, are expected to benefit business owners and shareholders as well as workers in STEM fields, many of whom are disproportionately higher income Canadians.
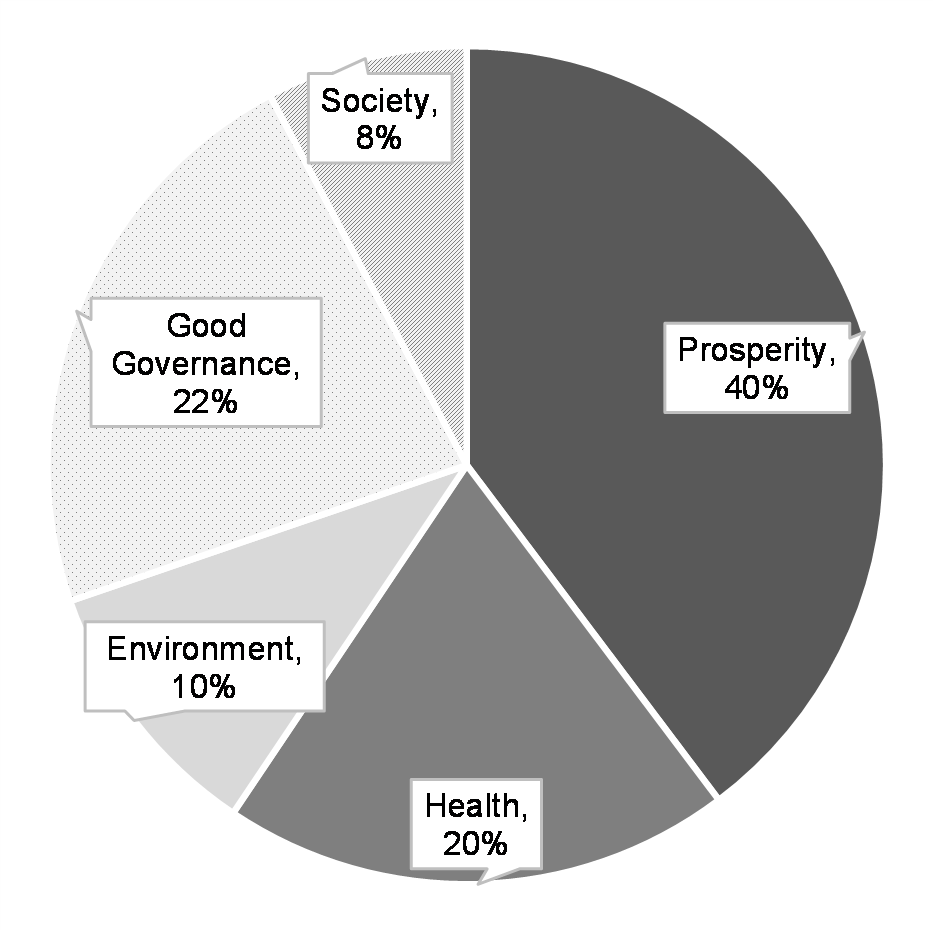
Expected Quality of Life Impacts: Expenditure by Domain
Composition of Budget 2022 Investments
($ value of measures, by domain*)
Budget measures were assessed in terms of their expected contribution to each of the 85 Quality of Life indicators, which are organized into five domains. Some flagship measures make a substantial direct contribution to one of these outcomes, but most combine with other measures to make a smaller or more indirect contribution. Many budget measures advance more than one domain. In these cases, the pie chart allocates spending between implicated domains, using weights. Some invoke trade-offs, where one domain is advanced but another is impeded. The Quality of Life Framework offers a structured approach to assessing these impacts.
The greatest share of the value of Budget 2022 measures is expected to advance outcomes in the prosperity domain, which includes inclusive growth priorities such as housing. The second greatest share advances outcomes in the good governance domain, which includes international engagement initiatives and Indigenous self- determination and prosperity. Budget 2022 is expected to have significant impacts in all domains of the Framework. Over 90 per cent of the value of budget measures is expected to have positive impacts in multiple domains. The greatest combined impact is prosperity and environment, reflecting a Budget 2022 focus on long-term economic growth and transition to a net-zero economy.
Expected Quality of Life Impacts: Indicator Frequency
Chart 11
Count of Budget 2022 Measures, Top Ten Expected Impacts by Domain
| Employment | 43 |
|---|---|
| Firm growth | 33 |
| Acceptable housing | 19 |
| Productivity | 17 |
| Future outlook | 17 |
| Debt-to-GDP ratio | 17 |
| Financial well-being | 16 |
| GDP per capita | 16 |
| Investment in R&D | 16 |
| Household wealth | 12 |
| Self-rated mental health | 27 |
|---|---|
| Health-adjusted life expectancy | 20 |
| Self-rated health | 19 |
| Unmet health care needs | 17 |
| Unmet needs for mental health care | 9 |
| Vulnerable children | 7 |
| Timely access to primary care | 4 |
| Physical activity | 4 |
| Functional health status | 4 |
| Home care needs met | 3 |
| Greenhouse gas emissions | 35 |
|---|---|
| Climate change adaptation | 14 |
| Natural disasters and emergencies | 10 |
| Air quality | 8 |
| Satisfaction with local environment | 4 |
| Canadian Species Index | 3 |
| Waste management | 3 |
| Access to public transit | 2 |
| Clean drinking water | 2 |
| Coastal and marine protection | 2 |
| Walkability index | 2 |
| Confidence in institutions | 62 |
|---|---|
| Canada's place in the world | 29 |
| Discrimination and unfair treatment | 21 |
| Indigenous self-determination | 20 |
| Personal safety | 9 |
| Access to fair and equal justice | 9 |
| Misinformation/trust in media | 6 |
| Crime Severity Index | 5 |
| Household emergency preparedness | 3 |
| Representation in leadership | 2 |
| Sense of belonging to local community | 32 |
|---|---|
| Positive perceptions of diversity | 22 |
| Participation (cultural/religious/recreation/sport) | 16 |
| Sense of pride/belonging to Canada | 15 |
| Accessible environmments | 11 |
| Satisfaction with personal relationships (family/friends) | 5 |
| Time use | 4 |
| Loneliness | 3 |
| Trust in others | 3 |
| Satisfaction with time use | 2 |
The Impacts Report, which follows, lists expected quality of life impacts for each budget measure. Chart 11 summarizes these impacts, listing the most frequently cited indicators for which Budget 2022 measures are expected to have positive impacts of any scale. Since some measures are smaller than others, these counts differ from the share of budget value associated with each indicator. For example, acceptable housing and financial well-being (households’ ability to meet the cost of living) were associated with the greatest share of expenditure among indicators in the prosperity domain. Reducing unmet health care needs and self-rated health made of the greatest share for the health domain. Reducing greenhouse gas emissions along with climate change adaptation made up the greatest share for the environment domain. As noted above, not all measures that contribute towards an outcome—notably, reducing emissions, or increasing employment—will result in net new impacts that will be large enough to influence the national trajectory. Given the high degree of uncertainty and modelling challenges such as interaction effects between measures, the government is strengthening its capability to estimate impact size for these priority outcomes consistently.
Expected Quality of Life Impacts: Long-term Impacts
Share of Budget 2022 Investments Expected to Carry Long-term Returns
($ value of measures, by domain*)
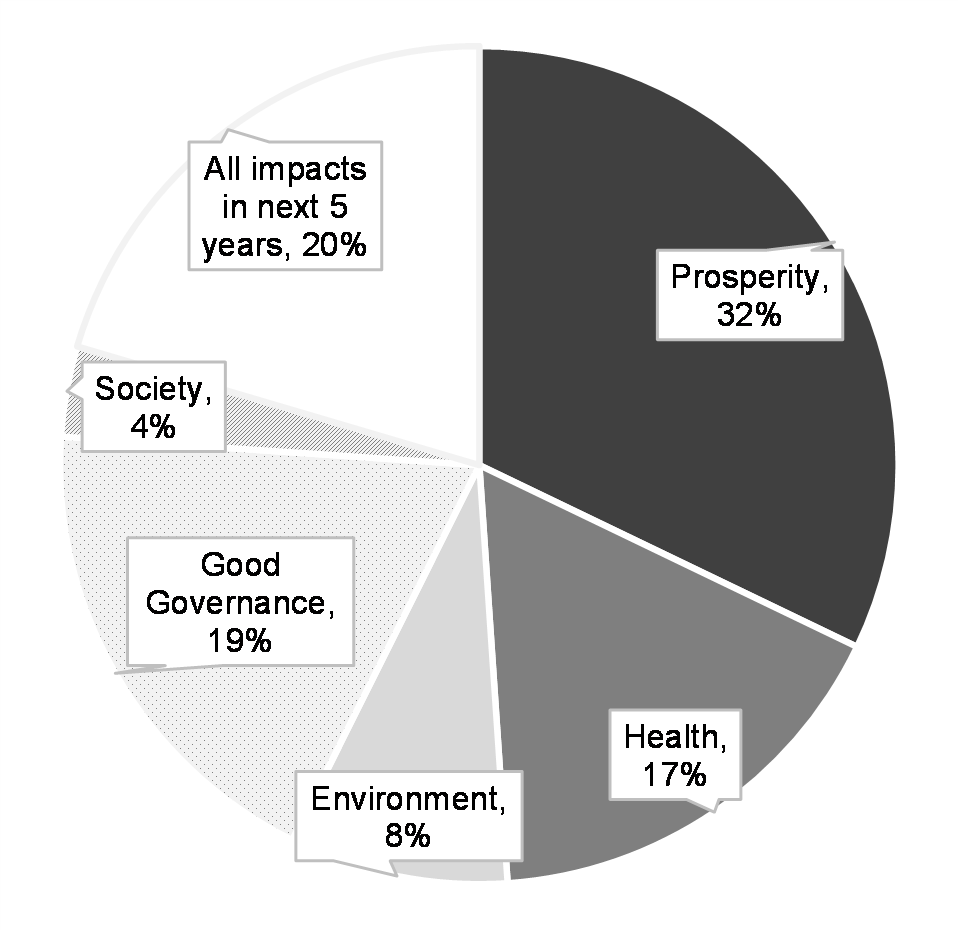
Budget measures were assessed in terms of the scale and duration of expected impacts on quality of life indicators. Many of the initiatives in Budget 2022 are time-limited in nature. As a result, some impacts will naturally occur only within the next five years—for example, impacts from support measures associated with the pandemic recovery. However, just over three-quarters of Budget 2022 investments are also expected to carry long-term returns that are moderate to significant over the 5-10 year period or longer. These could be national in scope, or affect regions, sectors or population sub-groups. This suggests that Budget 2022 is targeted towards achieving long-term economic, environmental, and social value for Canadians. Due to synergies between domains and weights explained in Chart 10, expenditure associated with some measures from Chart 12 could be allocated across multiple domains (e.g., split between prosperity and environment).
Report a problem on this page
- Date modified: