
Archived - Annex 1:
Details of Economic and Fiscal Projections
On this page:
Economic Projections
The average of private sector forecasts has been used as the basis for economic and fiscal planning since 1994. This helps ensure objectivity and transparency, and introduces an element of independence into the government's economic and fiscal forecast. The economic forecast presented in this section is based on a survey conducted in March 2024.
The March survey includes the views of 12 private sector economists:
- BMO Capital Markets;
- Caisse de dépôt et placement du Québec;
- CIBC World Markets;
- The Conference Board of Canada;
- Desjardins;
- Industrial Alliance Insurance and Financial Services Inc.;
- Laurentian Bank Securities;
- National Bank Financial Markets;
- Royal Bank of Canada;
- Scotiabank;
- TD Bank Financial Group; and,
- The University of Toronto (Policy and Economic Analysis Program).
The macroeconomic inputs of the March 2024 survey provide a reasonable basis for fiscal planning. To facilitate prudent economic and fiscal planning, the Department of Finance Canada has developed two scenarios that consider faster or slower growth tracks relative to the March survey (see below for details).
Overall, private sector economists have revised up their near-term growth outlook in the March 2024 survey compared to the 2023 Fall Economic Statement (FES 2023) outlook, but they revised down their growth outlook in 2025 and in the outer years (Table A1.1). Canada is expected to see moderate below-potential growth over the next few quarters weighed down by the effects of past interest rate increases, followed by a gradual recovery towards higher growth. Real gross domestic product (GDP) growth is projected to slow from 1.1 per cent in 2023 to 0.7 per cent in 2024, before rebounding to 1.9 per cent in 2025 (previously 0.5 per cent and 2.2 per cent, respectively). This revised outlook will leave the level of real GDP 0.2 per cent below the FES 2023 outlook by the end of 2025.
Comparisons of the March survey average to real GDP growth forecasts from other institutions can be found in Table A1.2.
As the economy slows, the unemployment rate is expected to rise to 6.5 per cent in the fourth quarter of 2024, remaining historically low and far below the peaks experienced during recessions. Amid ongoing solid population growth, this adjustment is expected to largely reflect a slower pace of hiring, rather than a large rise in layoffs. The unemployment rate is anticipated to settle at an average of 6.3 per cent in 2025 and continue to gradually decline to 5.7 per cent by 2028, similar to the FES 2023 projection.
Private sector economists expect Consumer Price Index (CPI) inflation to continue to ease and reach about 2 per cent, within the Bank of Canada's target range, at the end of this year. On an annual basis, CPI inflation is expected to decline from 3.9 per cent in 2023 to 2.5 per cent in 2024 and to normalize to around 2 per cent over the remainder of the forecast horizon, the same as in FES 2023.
Short-term interest rates are expected to decline from an average of 4.8 per cent in 2023 to 4.5 per cent in 2024 and to 3.1 per cent in 2025, about 20 basis points higher in each year compared to FES 2023, before settling at 2.7 per cent over the last three years of the forecast horizon. Long-term interest rates are expected to average 3.3 per cent over the forecast horizon, an upward revision of about 10 basis points on average per year compared to the FES 2023 projection.
In the March survey, private sector economists expect crude oil prices to remain stable and average US$78 per barrel over the forecast horizon, very similar to the FES 2023 projection.
GDP inflation in the second half of last year came in significantly stronger than expected in FES 2023. As a result, GDP inflation averaged 1.6 per cent for the year as a whole, compared to 1.0 per cent expected in FES 2023. As well, private sector economists have revised up their outlook for 2024 to 3.0 per cent from 2.0 per cent in FES 2023. In the outer years, GDP inflation is expected to be slightly lower than the FES 2023 projection by about 0.1 percentage points on average per year.
Reflecting higher-than-expected GDP inflation last year and upward revisions to the GDP inflation outlook for 2024, the level of nominal GDP (the broadest measure of the tax base) is higher than the FES 2023 projection by $18 billion in 2023 and $56 billion in 2024. However, because of slower real GDP growth and GDP inflation in the outer years, the nominal GDP level difference with FES 2023 gradually declines over the last four years of the forecast horizon to average $39 billion per year over that period.
| 2023 | 2024 | 2025 | 2026 | 2027 | 2028 | 2023- 2028 |
|
|---|---|---|---|---|---|---|---|
| Real GDP growth1 | |||||||
| 2023 Fall Economic Statement | 1.1 | 0.5 | 2.2 | 2.4 | 2.2 | 2.0 | 1.7 |
| Budget 2024 | 1.1 | 0.7 | 1.9 | 2.2 | 2.1 | 2.0 | 1.7 |
| GDP inflation1 | |||||||
| 2023 Fall Economic Statement | 1.0 | 2.0 | 2.0 | 2.1 | 2.1 | 2.1 | 1.9 |
| Budget 2024 | 1.6 | 3.0 | 1.9 | 2.0 | 2.0 | 2.0 | 2.1 |
| Nominal GDP growth1 | |||||||
| 2023 Fall Economic Statement | 2.1 | 2.5 | 4.3 | 4.5 | 4.3 | 4.2 | 3.6 |
| Budget 2024 | 2.7 | 3.8 | 3.9 | 4.2 | 4.2 | 4.0 | 3.8 |
| Nominal GDP level (billions of dollars)1 | |||||||
| 2023 Fall Economic Statement | 2,871 | 2,942 | 3,067 | 3,207 | 3,346 | 3,486 | |
| Budget 2024 | 2,889 | 2,998 | 3,115 | 3,246 | 3,382 | 3,518 | |
|
Difference between FES 2023 and Budget 2024
|
18 | 56 | 47 | 39 | 36 | 32 | 38 |
| 3-month treasury bill rate | |||||||
| 2023 Fall Economic Statement | 4.8 | 4.3 | 2.9 | 2.7 | 2.6 | 2.6 | 3.3 |
| Budget 2024 | 4.8 | 4.5 | 3.1 | 2.7 | 2.7 | 2.7 | 3.4 |
| 10-year government bond rate | |||||||
| 2023 Fall Economic Statement | 3.3 | 3.3 | 3.1 | 3.2 | 3.2 | 3.3 | 3.2 |
| Budget 2024 | 3.3 | 3.3 | 3.2 | 3.3 | 3.3 | 3.4 | 3.3 |
| Exchange rate (US cents/C$) | |||||||
| 2023 Fall Economic Statement | 74.3 | 75.2 | 77.4 | 78.6 | 78.7 | 79.1 | 77.2 |
| Budget 2024 | 74.1 | 74.4 | 76.4 | 77.6 | 78.0 | 78.5 | 76.5 |
| Unemployment rate | |||||||
| 2023 Fall Economic Statement | 5.4 | 6.4 | 6.2 | 5.9 | 5.8 | 5.7 | 5.9 |
| Budget 2024 | 5.4 | 6.3 | 6.3 | 6.0 | 5.8 | 5.7 | 5.9 |
| Consumer Price Index inflation | |||||||
| 2023 Fall Economic Statement | 3.8 | 2.5 | 2.1 | 2.1 | 2.1 | 2.1 | 2.4 |
| Budget 2024 | 3.9 | 2.5 | 2.1 | 2.1 | 2.0 | 2.0 | 2.4 |
| U.S. real GDP growth | |||||||
| 2023 Fall Economic Statement | 2.1 | 0.7 | 1.9 | 2.0 | 1.9 | 1.8 | 1.8 |
| Budget 2024 | 2.5 | 2.2 | 1.6 | 2.0 | 1.9 | 1.9 | 2.0 |
| West Texas Intermediate crude oil price ($US per barrel) | |||||||
| 2023 Fall Economic Statement | 77 | 78 | 77 | 77 | 77 | 79 | 78 |
| Budget 2024 | 78 | 78 | 78 | 78 | 78 | 78 | 78 |
|
Note: Forecast averages may not equal average of years due to rounding. Numbers may not add due to rounding. 1 Previously published figures have been restated to reflect the historical revisions in the Canadian System of National Accounts. Sources: Statistics Canada; for the 2023 Fall Economic Statement, Department of Finance Canada September 2023 survey of private sector economists; for Budget 2024, Department of Finance Canada March 2024 survey of private sector economists. |
|||||||
| 2023 | 2024 | 2025 | 2026 | 2027 | 2028 | |
|---|---|---|---|---|---|---|
| Budget 2024 | 1.1 | 0.7 | 1.9 | 2.2 | 2.1 | 2.0 |
| Organisation for Economic Co-operation and Development (OECD) | 1.1 | 0.9 | 1.9 | .. | .. | .. |
| Parliamentary Budget Officer (PBO) | 1.1 | 0.8 | 2.4 | 2.2 | 2.1 | 2.0 |
| International Monetary Fund (IMF) | 1.1 | 1.4 | 2.3 | .. | .. | .. |
| Bank of Canada | 1.1 | 1.5 | 2.2 | 1.9 | .. | .. |
|
Sources: Statistics Canada; for Budget 2024, see Table A1.1; OECD Interim Economic Outlook – February 2024; PBO, Economic and Fiscal Outlook – March 2024; IMF, World Economic Outlook Update – January 2024; Bank of Canada, Monetary Policy Report – April 2024. |
||||||
Changes to Fiscal Projections Since FES 2023
The fiscal outlook presented in this budget is based on the economic projections provided by the March 2024 survey of private sector economists. The tables that follow present changes to the fiscal outlook since FES 2023, including the impact of government policy actions taken since FES 2023, measures in this budget, and year-to-date financial results.
Changes to the Fiscal Outlook Since FES 2023
| Projection | ||||||
|---|---|---|---|---|---|---|
| 2023– 2024 |
2024– 2025 |
2025– 2026 |
2026– 2027 |
2027– 2028 |
2028– 2029 |
|
| Budgetary balance - 2023 Fall Economic Statement (FES 2023) | -40.0 | -38.4 | -38.3 | -27.1 | -23.8 | -18.4 |
| Economic and fiscal developments since FES 2023 | 3.4 | 3.9 | 6.9 | 6.5 | 4.1 | 4.3 |
| Budgetary balance before policy actions and measures | -36.7 | -34.5 | -31.3 | -20.6 | -19.7 | -14.1 |
| Policy actions since FES 2023 | -3.3 | -0.3 | 0.3 | 0.3 | -0.9 | -0.7 |
| Budget 2024 measures (by chapter) | ||||||
| 1. More Affordable Homes | 0.0 | -1.0 | -1.6 | -2.0 | -2.1 | -1.9 |
| 2. Lifting Up Every Generation | 0.0 | -1.4 | -2.0 | -2.0 | -2.3 | -2.7 |
| 3. Lowering Everyday Costs | 0.0 | -0.1 | 0.0 | 0.0 | 0.0 | 0.0 |
| 4. Economic Growth for Every Generation | 0.0 | -2.9 | -0.5 | -1.7 | -0.8 | -1.7 |
| 5. Safer, Healthier Communities | 0.0 | -2.4 | -1.7 | -0.9 | -0.7 | -0.7 |
| 6. A Fair Future for Indigenous Peoples | -0.1 | -3.0 | -2.7 | -1.6 | -1.0 | -0.8 |
| 7. Protecting Canadians and Defending Democracy | 0.0 | -0.8 | -2.4 | -2.5 | -2.7 | -2.3 |
| 8. Tax Fairness for Every Generation | 0.0 | 6.5 | 3.0 | 0.3 | 3.5 | 4.9 |
| Total – Policy actions since FES 2023 and Budget 2024 measures | -3.3 | -5.3 | -7.5 | -10.1 | -7.1 | -5.9 |
| Budgetary balance | -40.0 | -39.8 | -38.9 | -30.8 | -26.8 | -20.0 |
| Budgetary balance (per cent of GDP) | -1.4 | -1.3 | -1.2 | -0.9 | -0.8 | -0.6 |
| Federal debt (per cent of GDP) | 42.1 | 41.9 | 41.5 | 40.8 | 40.0 | 39.0 |
| Budgetary balance - upside scenario | -38.4 | -33.5 | -31.2 | -23.2 | -20.2 | -13.2 |
| Budgetary balance (per cent of GDP) | -1.3 | -1.1 | -1.0 | -0.7 | -0.6 | -0.4 |
| Federal debt (per cent of GDP) | 42.0 | 41.2 | 40.5 | 39.6 | 38.7 | 37.6 |
| Budgetary balance - downside scenario | -40.4 | -48.0 | -52.1 | -39.2 | -32.3 | -24.1 |
| Budgetary balance (per cent of GDP) | -1.4 | -1.6 | -1.7 | -1.2 | -1.0 | -0.7 |
| Federal debt (per cent of GDP) | 42.1 | 42.7 | 43.2 | 42.2 | 41.2 | 40.2 |
| Budgetary balance - FES 2023 | -40.0 | -38.4 | -38.3 | -27.1 | -23.8 | -18.4 |
| Budgetary balance (per cent of GDP) | -1.4 | -1.3 | -1.2 | -0.8 | -0.7 | -0.5 |
| Federal debt (per cent of GDP) | 42.4 | 42.7 | 42.2 | 41.2 | 40.2 | 39.1 |
|
A negative number implies a deterioration in the budgetary balance (lower revenue or higher expenses). A positive number implies an improvement in the budgetary balance (higher revenue or lower expenses). |
||||||
Economic and Fiscal Developments Since FES 2023
| Projection | ||||||
|---|---|---|---|---|---|---|
| 2023– 2024 |
2024– 2025 |
2025– 2026 |
2026– 2027 |
2027– 2028 |
2028– 2029 |
|
| Economic and fiscal developments by component1 | ||||||
| Change in budgetary revenues | ||||||
| (1.1) Income taxes | 7.7 | 7.7 | 9.0 | 7.4 | 4.9 | 5.0 |
| (1.2) Excise taxes and duties | -0.9 | 0.2 | 0.0 | -0.1 | -0.1 | -0.4 |
| (1.3) Pollution pricing proceeds to be returned to Canadians | 0.0 | -0.1 | -0.2 | -0.4 | -0.5 | -0.5 |
| (1.4) Employment Insurance premiums | 0.3 | 0.2 | 0.2 | 0.5 | 0.9 | 1.0 |
| (1.5) Other revenues2 | 1.8 | -0.1 | 0.0 | 0.3 | 0.1 | 1.2 |
| (1) Total budgetary revenues | 8.9 | 7.9 | 9.0 | 7.9 | 5.3 | 6.3 |
| Change in program expenses | ||||||
| (2.1) Major transfers to persons | -0.1 | -0.4 | -0.3 | 0.5 | 0.3 | 0.0 |
| (2.2) Major transfers to provinces, territories and municipalities | 0.2 | 0.1 | 0.0 | -0.1 | 0.0 | 0.3 |
| (2.3) Pollution pricing proceeds returned to Canadians | 1.3 | -0.3 | -0.9 | 0.5 | 0.8 | 0.6 |
| (2.4) Direct program expenses | -6.2 | -1.3 | 0.4 | -0.4 | 0.1 | 0.8 |
| (2) Total program expenses, excluding net actuarial losses | -4.8 | -1.8 | -0.8 | 0.5 | 1.2 | 1.7 |
| (3) Public debt charges | -0.7 | -1.7 | -1.6 | -1.9 | -2.4 | -3.7 |
| (4) Net actuarial losses (gains) | 0.0 | -0.4 | 0.2 | 0.1 | 0.0 | -0.1 |
| (5) Total economic and fiscal developments | 3.4 | 3.9 | 6.9 | 6.5 | 4.1 | 4.3 |
|
1 A negative number implies a deterioration in the budgetary balance (lower revenues or higher spending). A positive number implies an improvement in the budgetary balance (higher revenues or lower spending). 2 Includes Pillar One tax, Pillar Two tax, and Underused Housing Tax in this table only for presentation purposes. |
||||||
Budgetary revenue projections have been revised up relative to FES 2023 by an average of $7.6 billion annually, primarily reflecting stronger personal income tax revenues. This strength has been somewhat offset by lower projected revenue in a number of streams (including non-resident income tax, excise taxes and duties, and Crown corporations revenues).
- The outlook for income tax revenues has been revised upwards by $7.0 billion annually on average, largely reflecting stronger anticipated personal and corporate income tax revenues.
- The outlook for excise taxes and duties has been revised down in 2023-24 owing to lower-than-expected GST receipts and customs import duties. Over the remainder of the forecast horizon, the outlook is largely unchanged.
- Proceeds from the federal pollution pricing framework arising from the provinces and territories within the federal backstop are estimated to be lower over the forecast horizon, reflecting Environment and Climate Change Canada modelling. Direct proceeds from the federal price on pollution will continue to be fully returned to Canadians, small- and medium-sized businesses, farmers, and Indigenous governments in the provinces where they are collected, as the program is revenue neutral for the federal government. In addition, Output-Based Pricing System (OBPS) proceeds are returned either to provincial and territorial governments or via the OBPS Proceeds Fund. Direct proceeds from the price on pollution collected in Yukon and Nunavut are returned to the respective territorial governments.
- Employment Insurance premium revenues are projected to be higher in 2023-24 due to higher-than-expected year-to-date receipts, while stronger labour market and wage projections are expected to bring revenue estimates up over the forecast horizon.
- Other revenues have been revised up in 2023-24, due to an increase in interest and penalty revenue on tax debt. Lower projected net income from enterprise Crown corporations contributes to downward revisions in the near term, but these declines level off and contribute to higher expected revenues in 2027-28 and onwards. Throughout the forecast horizon, higher expected other program and net foreign exchange revenues contribute to upward revisions.
The outlook for program expenses has been revised up in early years of the forecast relative to FES 2023, reflecting higher direct program expenses and major transfers to persons. Program expenses are down in the outer years, reflecting lower major transfers, lower pollution pricing proceeds returned to Canadians, and slightly lower direct program expenses.
- Reflecting year-to-date results, major transfers to persons are slightly higher in 2023-24, including higher elderly benefits, Employment Insurance benefits, and Canada Child Benefit payments, offset in part by an increase in expected recoveries from benefit overpayments for emergency COVID 19 income supports, relative to FES 2023. Over the remainder of the forecast horizon, Employment Insurance benefits are higher resulting from higher wage growth and unemployment rate projections, and Canada Child Benefit payments are slightly higher owing to the carry forward of in-year results. Elderly benefits are projected to be lower, owing to revisions to the projected number of beneficiaries.
- Projected major transfers to provinces, territories, and municipalities have decreased slightly across the horizon due to near-term changes in the economic outlook, which result in downward revisions to Territorial Formula Financing and higher projected recoveries with respect to the Quebec Abatement. The declines are partially offset by an increase in projected Equalization payments, which are indexed to nominal GDP growth.
- Pollution pricing proceeds returned to Canadians are lower in most years, reflecting lower proceeds as discussed above, as well as revised timing of returning pollution pricing proceeds to small- and medium-sized businesses and Indigenous governments in the jurisdiction where they are generated. Over 90 per cent of proceeds are returned directly to Canadians through the Canada Carbon Rebate.
- The outlook for direct program expenses has been revised up in 2023-24, relative to the FES 2023 forecast. Higher expenses in 2023-24 reflect revised provisions for contingent liabilities and allowances, higher anticipated offshore oil and gas royalties returned to provinces, and higher refundable tax credits. Across the horizon, higher projected refundable tax credits from higher projected corporate income are broadly offset by revised timing and spending against previously announced measures and lower public service pension and benefit service costs.
Public debt charges are expected to increase in 2023-24 relative to FES 2023 projections due to higher near-term borrowing requirements and higher short- and long-term interest rates as forecast by private sector economists. Over the remainder of the forecast horizon, higher projected short- and long-term interest rates and borrowing requirements are expected to increase public debt charges relative to FES 2023 by an average of $2 billion per year.
Net actuarial losses, which represent the amortization of changes in the value of the government's accrued obligations for pensions and other employee future benefits and pension fund assets, are expected to be higher in 2024-25 and lower in 2025-26 and 2026-27 relative to the FES 2023 forecast, reflecting updated projections of long-term interest rates.
Summary Statement of Transactions
| Projection | |||||||
|---|---|---|---|---|---|---|---|
| 2022– 2023 |
2023– 2024 |
2024– 2025 |
2025– 2026 |
2026– 2027 |
2027– 2028 |
2028– 2029 |
|
| Budgetary revenues | 447.8 | 465.1 | 497.8 | 514.6 | 535.7 | 561.4 | 586.3 |
| Program expenses, excluding net actuarial losses | 438.6 | 450.3 | 480.5 | 496.3 | 509.6 | 526.3 | 544.4 |
| Public debt charges | 35.0 | 47.2 | 54.1 | 54.9 | 57.0 | 60.9 | 64.3 |
| Total expenses, excluding net actuarial losses | 473.5 | 497.5 | 534.6 | 551.1 | 566.6 | 587.2 | 608.7 |
| Budgetary balance before net actuarial losses | -25.7 | -32.5 | -36.8 | -36.5 | -30.8 | -25.8 | -22.4 |
| Net actuarial losses | -9.6 | -7.6 | -3.1 | -2.4 | 0.1 | -1.0 | 2.4 |
| Budget 2024 budgetary balance | -35.3 | -40.0 | -39.8 | -38.9 | -30.8 | -26.8 | -20.0 |
| Financial Position | |||||||
| Total liabilities | 1,925.0 | 2,004.5 | 2,091.3 | 2,200.0 | 2,298.0 | 2,400.1 | 2,491.4 |
| Financial assets | 642.3 | 676.6 | 719.1 | 783.9 | 844.8 | 915.0 | 978.5 |
| Net debt | 1,282.8 | 1,327.8 | 1,372.2 | 1,416.1 | 1,453.2 | 1,485.1 | 1,513.0 |
| Non-financial assets | 109.7 | 112.4 | 116.9 | 121.9 | 128.3 | 133.4 | 141.3 |
| Federal debt1 | 1,173.0 | 1,215.5 | 1,255.3 | 1,294.1 | 1,324.9 | 1,351.7 | 1,371.7 |
| Per cent of GDP | |||||||
| Budgetary revenues | 15.9 | 16.1 | 16.6 | 16.5 | 16.5 | 16.6 | 16.7 |
| Program expenses, excluding net actuarial losses | 15.6 | 15.6 | 16.0 | 15.9 | 15.7 | 15.6 | 15.5 |
| Public debt charges | 1.2 | 1.6 | 1.8 | 1.8 | 1.8 | 1.8 | 1.8 |
| Budgetary balance | -1.3 | -1.4 | -1.3 | -1.2 | -0.9 | -0.8 | -0.6 |
| Federal debt | 41.7 | 42.1 | 41.9 | 41.5 | 40.8 | 40.0 | 39.0 |
|
1 The projected level of federal debt for 2023-24 includes an estimate of other comprehensive losses of $1.1 billion for enterprise Crown corporations and other government business enterprises, and an estimate of $1.3 billion for net remeasurement losses on swap agreements, foreign exchange forward agreements, and other financial instruments. 2 Numbers may not add due to rounding. |
|||||||
Outlook for Budgetary Revenues
Table A1.6 provides an overview of projected budgetary revenues by major component.
| Projection | |||||||
|---|---|---|---|---|---|---|---|
| 2022– 2023 |
2023– 2024 |
2024– 2025 |
2025– 2026 |
2026– 2027 |
2027– 2028 |
2028– 2029 |
|
| Income tax revenues | |||||||
| Personal income tax | 207.9 | 222.3 | 232.6 | 242.8 | 251.0 | 263.5 | 275.7 |
| Corporate income tax | 93.9 | 83.9 | 90.7 | 89.7 | 90.8 | 95.6 | 98.6 |
| Non-resident income tax | 13.2 | 12.6 | 13.1 | 13.4 | 13.5 | 13.9 | 14.4 |
| Total | 315.0 | 318.8 | 336.4 | 345.8 | 355.3 | 373.0 | 388.7 |
| Excise tax and duty revenues | |||||||
| Goods and Services Tax | 46.0 | 51.5 | 54.1 | 55.3 | 56.8 | 58.8 | 60.8 |
| Customs import duties | 6.1 | 5.6 | 5.9 | 6.1 | 6.5 | 6.8 | 7.1 |
| Other excise taxes/duties | 12.2 | 12.9 | 13.4 | 13.5 | 13.7 | 13.8 | 13.9 |
| Total | 64.2 | 70.0 | 73.3 | 74.9 | 77.0 | 79.4 | 81.8 |
| Other taxes | 0.0 | 0.1 | 2.4 | 1.0 | 3.7 | 2.9 | 3.1 |
| Total tax revenues | 379.2 | 388.9 | 412.2 | 421.8 | 435.9 | 455.3 | 473.6 |
| Pollution pricing proceeds to be returned to Canadians | 8.0 | 10.4 | 12.7 | 14.9 | 16.7 | 18.9 | 20.7 |
| Employment Insurance premium revenues | 26.9 | 29.1 | 30.1 | 30.5 | 31.7 | 33.1 | 34.5 |
| Other revenues | |||||||
| Enterprise Crown corporations | 6.5 | 3.2 | 8.7 | 13.1 | 16.1 | 18.2 | 20.5 |
| Other programs | 25.9 | 30.3 | 30.6 | 30.2 | 31.1 | 31.7 | 32.8 |
| Net foreign exchange | 1.3 | 3.1 | 3.5 | 4.2 | 4.2 | 4.1 | 4.2 |
| Total | 33.6 | 36.6 | 42.8 | 47.5 | 51.4 | 54.1 | 57.4 |
| Total budgetary revenues | 447.8 | 465.1 | 497.8 | 514.6 | 535.7 | 561.4 | 586.3 |
| Per cent of GDP | |||||||
| Total tax revenues | 13.5 | 13.5 | 13.7 | 13.5 | 13.4 | 13.5 | 13.5 |
| Pollution pricing proceeds to be returned to Canadians | 0.3 | 0.4 | 0.4 | 0.5 | 0.5 | 0.6 | 0.6 |
| Employment Insurance premium revenues | 1.0 | 1.0 | 1.0 | 1.0 | 1.0 | 1.0 | 1.0 |
| Other revenues | 1.2 | 1.3 | 1.4 | 1.5 | 1.6 | 1.6 | 1.6 |
| Total budgetary revenues | 15.9 | 16.1 | 16.6 | 16.5 | 16.5 | 16.6 | 16.7 |
| Note: Totals may not add due to rounding. | |||||||
Income Tax Revenues
Personal income tax revenues are projected to increase by 6.9 per cent to $222.3 billion in 2023-24, reflecting strong wage growth and year-to-date results. Strength is expected to persist into 2024-25 where personal income tax revenue is expected to grow by 4.6 per cent in part due to an increase in the capital gains inclusion rate (as outlined in Chapter 8). Over the remainder of the forecast horizon, personal income tax revenue growth is projected to average 4.3 per cent per year.
Corporate income tax revenues are forecast to decrease by 10.7 per cent, to $83.9 billion in 2023-24, due to lower year-to-date receipts relative to the previous year stemming from lower corporate profitability. These revenues are expected to rebound in 2024-25, supported by an increase in the capital gains inclusion rate for corporations (as outlined in Chapter 8) and higher projected corporate profits. It is expected that the capital gains measure would raise corporate income tax revenues by $4.9 billion in 2024-25 and by $10.6 billion over the forecast horizon. Growth in corporate income tax revenues is projected to average 3.3 per cent per year over the forecast horizon.
Income taxes paid by non-residents on Canadian-sourced income, notably dividends and interest payments, are expected to decline by 4.2 per cent to $12.6 billion in 2023-24, reflecting weak year-to-date receipts. Over the remainder of the forecast horizon, growth in non-resident income tax revenues is expected to average 2.4 per cent per year.
Excise Tax and Duty Revenues
Goods and Services Tax (GST) revenues are projected to grow 12 per cent to $51.5 billion in 2023-24. The high year-over-year growth rate is attributable to the impact of the additional GST rebates paid in the previous fiscal year (2022-23), which reduced recorded revenues that year. Over the remainder of the forecast period, GST revenues are expected to grow on average by 3 per cent per year, in line with the outlook for taxable consumption.
Customs import duties are projected to decrease by 8.3 per cent to $5.6 billion in 2023-24, due to weak year-to-date results driven by lower imports. Over the remainder of the forecast horizon, customs import duties growth is projected to average 4.7 per cent, in line with projected growth in imports.
Other excise taxes and duties are expected to increase to $12.9 billion in
2023-24, or 6 per cent, reflecting strong year-to-date revenues, particularly for luxury tax receipts and excise duties from vaping products. Other excise taxes and duties revenues are projected to grow to $13.9 billion by 2028-29.
Other taxes include revenues from the Underused Housing Tax announced in the 2021 Economic and Fiscal Update, from Pillar Two of the two-pillar international tax reform plan agreed by 139 members of the OECD/G20 Inclusive Framework and from the Digital Services Tax that is to apply until Pillar One comes into effect. Revenues from these taxes are projected to grow to $3.1 billion in 2028-29, primarily reflecting the projected revenues from Pillar Two. Pillar Two revenues are now projected to be $2.7 billion in 2026-27, $1.9 billion in 2027-28 and $2.1 billion in 2028-29, reflecting changes to the multilateral framework agreed since Budget 2023, and new information on implementation in other jurisdictions. Revenues from the Digital Services Tax are projected to be $2.3 billion in 2024-25 (reflecting revenues from the 2022, 2023, and 2024 taxation years) and $900 million in each of the following four years.
Proceeds from the Pollution Pricing Framework
Through the pollution pricing framework, proceeds to be returned to Canadians are forecast to grow from an estimated $10.4 billion in 2023-24 to $20.7 billion in 2028-29. The carbon price trajectory underpinning the forecast reflects annual increases of $15 per tonne, from $65 per tonne, beginning in 2023-24. Direct proceeds will continue to be fully returned in the provinces or territories where they are collected, as the framework is revenue neutral for the federal government.
Employment Insurance Premium Revenues
Employment Insurance (EI) premium revenues are projected to grow at 8.3 per cent in 2023-24 based on strong year-to-date results fueled by continued strength in the labour market. Over the forecast horizon, EI premium revenues are projected to grow at an average of 3.4 per cent, reflecting steady earnings growth and strong employment numbers (see Box A1.1 for details of the outlook for the EI Operating Account). The premium rate projection is forecast to fall to $1.62 per $100 of insurable earnings in 2025—26 cents lower than it was between 2013 and 2016 ($1.88). The EI premium rate reached its lowest levels in the last 25 years in 2020, 2021, and 2022 ($1.58). The average EI premium rate between 2016 and 2024 has been $1.65. The average premium rate for the preceding decade (2006-2015) was $1.81 (16 cents higher).
| 2022-2023 | 2023-2024 | 2024-2025 | 2025-2026 | 2026-2027 | 2027-2028 | 2028-2029 | |||
|---|---|---|---|---|---|---|---|---|---|
| EI premium revenues | 26.9 | 29.1 | 30.1 | 30.5 | 31.7 | 33.1 | 34.5 | ||
| EI benefits1 | 21.8 | 23.0 | 26.6 | 27.9 | 28.2 | 29.0 | 30.2 | ||
| EI administration and other expenses2 | 2.8 | 2.8 | 2.5 | 2.1 | 2.1 | 2.1 | 2.2 | ||
| 20223 | 2023 | 2024 | 2025 | 2026 | 2027 | (…) | 2031 | ||
| EI Operating Account annual balance | 1.2 | 4.7 | 1.8 | 0.8 | 1.9 | 2.6 | 4.9 | ||
| EI Operating Account cumulative balance4 | -24.7 | -19.9 | -18.1 | -17.3 | -15.5 | -12.9 | 0.5 | ||
| Projected premium rate (per $100 of insurable earnings) | 1.58 | 1.63 | 1.66 | 1.62 | 1.62 | 1.62 | 1.62 | ||
|
1 EI benefits include regular EI benefits, sickness, maternity, parental, compassionate care, fishing and work-sharing benefits, and employment benefits and support measures. EI benefits exclude EI-Emergency Response Benefit costs in line with the government's commitment to credit the EI Operating Account. To date, the government has credited $26.8 billion for this purpose. 2 The remaining EI costs relate mainly to administration and are included in direct program expenses. 3 Values for 2022 are actual data. Values for 2023 and future years are a projection. 4 The EI Operating Account cumulative balance does not reach exactly zero at the end of the seven-year period as projected EI rates are rounded to the nearest whole cent per $100 of insurable earnings, in accordance with the Employment Insurance Act. |
|||||||||
The Employment Insurance (EI) Operating Account operates within the Consolidated Revenue Fund. As such, EI-related revenues and expenses that are credited and charged to the Account, respectively, in accordance with the Employment Insurance Act, are consolidated with those of the government, and impact the budgetary balance. For consistency with the EI premium rate, which is set on a calendar-year basis with the objective of having the Account break even over time, the annual and cumulative balances of the Account are also presented on a calendar-year basis.
The EI Operating Account is expected to record annual surpluses throughout the forecast to reach cumulative balance in 2031 in line with the break-even rate-setting mechanism that started with the setting of the 2017 premium rate. The actual premium rate for 2025 will be set according to this mechanism in the fall of 2024, incorporating the recommendation of the EI Commission based on projections provided by the Office of the Chief Actuary.
Other Revenues
Other revenues consist of three broad components: net income from enterprise Crown corporations; other program revenues from returns on investments, proceeds from the sales of goods and services, and other miscellaneous revenues; and net foreign exchange revenues.
- Enterprise Crown corporation revenues are projected to be lower in 2023-24, largely reflecting Bank of Canada net losses, as interest expense paid on deposits held by the Bank at variable interest rates has grown faster than revenues on the Bank's fixed-rate investments in the rising interest rate environment.
- Starting in 2024-25, growth in enterprise Crown corporation revenues largely reflects revenues generated from the Government of Canada's purchase of Canada Mortgage Bonds (CMB) and the Bank of Canada's expected gradual return to profitability. The government will ensure that the pace and volume of CMB purchases are appropriate for market conditions.
- Other program revenues are affected by consolidated Crown corporation revenues, interest rates, inflation, and exchange rate movements (which affect the Canadian-dollar value of foreign-denominated assets). These revenues are projected to increase by an average of 8.6 per cent in 2023-24 and 2024-25, primarily due to an increase in interest and penalty revenue on tax debt as a result of higher interest rates. Over the remainder of the forecast horizon, other program revenue is projected to continue to grow by 2.8 per cent on average, in part reflecting returns on investments and proceeds collected from the Clean Fuel Regulations.
- Net foreign exchange revenues, which consist mainly of returns on Canada's official international reserves held in the Exchange Fund Account, are volatile and sensitive to fluctuations in foreign exchange rates and foreign interest rates. Assets in the Exchange Fund Account are mainly invested in debt securities of sovereigns and their agencies. They are held to aid in the control and protection of the external value of the Canadian dollar and to provide a source of liquidity for the government, if required. These revenues are projected to increase as losses on sales of securities into a rising interest rate environment recede, a growing portion of reserves are re-invested at higher interest rates, and the projected level of reserves also grows. Towards the end of the forecast horizon, revenues reset to a slightly lower level and growth rate as a result of declining interest rates.
Outlook for Expenses
| Projection | |||||||
|---|---|---|---|---|---|---|---|
| 2022- 2023 |
2023- 2024 |
2024- 2025 |
2025- 2026 |
2026- 2027 |
2027- 2028 |
2028- 2029 |
|
| Major transfers to persons | |||||||
| Elderly benefits | 69.4 | 75.9 | 80.6 | 85.3 | 90.0 | 94.9 | 99.9 |
| Employment Insurance benefits | 21.8 | 23.0 | 26.6 | 27.9 | 28.2 | 29.0 | 30.2 |
| COVID-19 income support for workers | -3.5 | -4.4 | 0.0 | 0.0 | 0.0 | 0.0 | 0.0 |
| Canada Child Benefit | 24.6 | 26.1 | 28.1 | 29.5 | 30.4 | 31.5 | 32.5 |
| Total | 112.2 | 120.6 | 135.3 | 142.6 | 148.6 | 155.3 | 162.5 |
| Major transfers to provinces, territories, and municipalities | |||||||
| Canada Health Transfer | 47.1 | 49.4 | 52.1 | 54.7 | 57.4 | 60.3 | 62.8 |
| Canada Social Transfer | 15.9 | 16.4 | 16.9 | 17.4 | 17.9 | 18.5 | 19.0 |
| Equalization | 21.9 | 24.0 | 25.3 | 26.1 | 27.2 | 28.3 | 29.4 |
| Territorial Formula Financing | 4.6 | 4.8 | 5.2 | 5.3 | 5.4 | 5.6 | 5.6 |
| Health agreements with provinces and territories | 1.2 | 4.3 | 4.3 | 4.3 | 4.3 | 3.1 | 2.5 |
| Canada-wide early learning and child care | 4.5 | 5.6 | 6.6 | 7.9 | 7.9 | 7.7 | 7.7 |
| Canada Community-Building Fund | 2.3 | 2.4 | 2.4 | 2.5 | 2.5 | 2.6 | 2.6 |
| Other fiscal arrangements1 | -6.7 | -6.7 | -7.2 | -7.5 | -7.8 | -8.2 | -8.6 |
| Total | 90.8 | 100.2 | 105.5 | 110.8 | 114.8 | 117.7 | 121.0 |
| Pollution pricing proceeds returned to Canadians | 7.0 | 9.9 | 14.9 | 15.3 | 17.2 | 19.0 | 20.9 |
| Direct program expenses | |||||||
| Other transfer payments | 98.9 | 88.7 | 101.7 | 103.9 | 105.8 | 109.7 | 112.8 |
| Operating expenses | 129.6 | 130.9 | 123.1 | 123.8 | 123.1 | 124.5 | 127.1 |
| Total | 228.5 | 219.6 | 224.7 | 227.6 | 228.9 | 234.2 | 240.0 |
| Total program expenses, excluding net actuarial losses | 438.6 | 450.3 | 480.5 | 496.3 | 509.6 | 526.3 | 544.4 |
| Public debt charges | 35.0 | 47.2 | 54.1 | 54.9 | 57.0 | 60.9 | 64.3 |
| Total expenses, excluding net actuarial losses | 473.5 | 497.5 | 534.6 | 551.1 | 566.6 | 587.2 | 608.7 |
| Net actuarial losses (gains) | 9.6 | 7.6 | 3.1 | 2.4 | -0.1 | 1.0 | -2.4 |
| Total expenses | 483.1 | 505.1 | 537.6 | 553.5 | 566.5 | 588.2 | 606.3 |
| Per cent of GDP | |||||||
| Major transfers to persons | 4.0 | 4.2 | 4.5 | 4.6 | 4.6 | 4.6 | 4.6 |
| Major transfers to provinces, territories, and municipalities | 3.2 | 3.5 | 3.5 | 3.6 | 3.5 | 3.5 | 3.4 |
| Direct program expenses | 8.1 | 7.6 | 7.5 | 7.3 | 7.1 | 6.9 | 6.8 |
| Total program expenses, excluding net actuarial losses | 15.6 | 15.6 | 16.0 | 15.9 | 15.7 | 15.6 | 15.5 |
| Total expenses | 17.2 | 17.5 | 17.9 | 17.8 | 17.5 | 17.4 | 17.2 |
|
Note: Totals may not add due to rounding. 1 Other fiscal arrangements include the Quebec Abatement (offsetting amounts to reflect the historical transfer of tax points and resulting reduction in federal tax collected for the Youth Allowances Recovery and Alternative Payments for Standing Programs); statutory subsidies; payments under the Canada-Nova Scotia Arrangement on Offshore Revenues; payments for the transfer of Hibernia Net Profits Interest and Incidental Net Profits Interest net revenues to Newfoundland and Labrador; and Fiscal Stabilization payments. |
|||||||
Table A1.7, above, provides an overview of the projection for program expenses by major component.
Major Transfers to Persons
Major transfers to persons consist of elderly benefits, which include Old Age Security and the Guaranteed Income Supplement; Employment Insurance (EI) benefits; the Canada Child Benefit; as well as previous COVID-19 income support for workers.
Elderly benefits are projected to reach $75.9 billion in 2023-24, up 9.4 per cent. Over the forecast horizon, elderly benefits are forecast to grow by 5.6 per cent on average annually. Growth in elderly benefits is due to the increasing population of seniors and projected consumer price inflation, to which benefits are fully indexed.
EI benefits are projected to increase by 5.2 per cent to reach $23 billion in 2023-24, largely reflecting a higher projected unemployment rate in 2024. Over the remainder of the forecast horizon, EI benefits are expected to increase as a result of higher insurable earnings and a slightly higher unemployment rate, which begins to decline in 2026 in the March private sector survey forecast.
During the pandemic, the government provided support to Canadians through the Canada Emergency Response Benefit, Canada Recovery Benefits, and the Canada Worker Lockdown Benefit. These temporary programs are now closed, with forecasted amounts in 2023-24 mainly reflecting expected repayments of benefit overpayments.
Canada Child Benefit payments are projected to increase 6.5 per cent to $26.1 billion in 2023-24, largely reflecting the indexation of benefits to consumer price inflation. Payments are then expected to grow by 7.6 per cent in 2024-25 and 4.7 in 2025-26 due to an increase in the number of eligible children and indexation, before moderating to an average 3.3 per cent growth over the remainder of the forecast horizon.
Major Transfers to Provinces, Territories, and Municipalities
Major transfers to provinces, territories and municipalities include the Canada Health Transfer (CHT), the Canada Social Transfer (CST), Equalization, Territorial Formula Financing, health agreements with provinces and territories, Canada-wide early learning and child care, the Canada Community-Building Fund, and other fiscal arrangements.
The CHT growth guarantee of five per cent per year for five years, to be paid through annual top-ups, will see CHT support increase from $49.4 billion in 2023-24 to $62.8 billion in 2028-29.
The CST is legislated to grow at three per cent per year from $16.4 billion in 2023-24 to $19 billion in 2028-29. Equalization payments are indexed to the three-year average of nominal GDP growth and are projected to grow 4.2 per cent annually, on average, from $24 billion in 2023-24 to $29.4 billion in 2028‑29.
Territorial Formula Financing is projected to grow 2.9 per cent annually, on average, due to growth in provincial/local expenditures, which are major components of the formula.
Health agreements with provinces and territories are projected to remain at $4.3 billion per year from 2023-24 to 2026-27 reflecting $2.5 billion per year for tailored bilateral agreements, $1.2 billion per year in transfers supporting home and community care and mental health and addictions services that expire after 2026-27, and $600 million per year in transfers for long-term care that expires after 2027-28.
Canada Community-Building Fund payments, which are indexed at two per cent per year with increases applied in $100 million increments, are expected to grow from $2.4 billion in 2023-24 to $2.6 billion in 2028-29.
Canada-wide early learning and child care transfer payments are expected to increase from $5.6 billion in 2023-24 to $7.7 billion in 2028-29, which includes $625 million over four years, beginning in 2023-24, for the Early Learning and Child Care Infrastructure Fund. Investments in Canada-wide early earning and child care will create more child care spaces so more families can benefit from $10-a-day child care.
Other fiscal arrangements are projected to decrease from -$6.7 billion in 2023‑24 to -$8.6 billion in 2028-29 primarily due to the Quebec Abatement. This reflects the increase in the value of the historical transfer of tax points (i.e. tax revenue) to Quebec in the 1960s and 1970s, which results in a commensurate reduction in cash transfers to the province.
Pollution Pricing Proceeds Returned to Canadians
Pollution pricing proceeds returned to Canadians, including small- and medium-sized businesses, farmers, and Indigenous governments, represent the return of all direct proceeds from the federal pollution pricing system in the jurisdiction from which they were collected. These transfers are projected to increase from $9.9 billion in 2023-24, to $20.9 billion by 2028-29, reflecting a higher price on carbon pollution.
Direct Program Expenses
Direct program expenses consist of other transfer payments administered by departments, and departmental operating expenses. Growth is offset in part by planned expenditure reduction actions.
Other transfer payments administered by departments are projected to increase from $88.7 billion in 2023-24 to $112.8 billion in 2028-29. Projected growth reflects recent measures with growing profiles, such as Canadian Dental Care Plan benefits, support for electric vehicle battery manufacturing, and refundable clean economy investment tax credits.
Operating expenses reflect the cost of doing business, including the cost of providing some services directly, for more than 100 government departments, agencies and Crown corporations. Operating expenses are projected to reach $130.9 billion in 2023-24, to fall to $123.1 billion in 2024-25 in part from lower projected provisions for contingent liabilities, and then to reach $127.1 billion in 2028-29. Growth over the outer years of the horizon is driven in part by: the implementation of Canada's new defence policy Our North, Strong and Free; and employee benefits, pensions, and other compensation.
Public Debt Charges
Public debt charges are expected to increase from $47.2 billion in 2023-24 to $64.3 billion in 2028-29 due to higher effective interest rates and higher borrowing requirements. As a share of GDP, public debt charges are projected to rise to 1.8 per cent, still near historic lows, and far below the peak of 6.5 per cent of GDP in the 1990s and 2.1 per cent in 2007-08 before the financial crisis.
Net Actuarial Losses
Net actuarial losses, which represent changes in the value of the government's obligations for pensions and other employee future benefits, are expected to decline over most years of the forecast horizon, from a projected loss of $7.6 billion in 2023-24 to a projected net gain of $2.4 billion in 2028-29, reflecting higher expected interest rates used to measure the present value of the obligations.
Financial Source/Requirement
The financial source/requirement measures the difference between cash coming into the government and cash going out. In contrast, the budgetary balance is presented on a full accrual basis of accounting, meaning that government revenues and expenses are recorded when they are earned or incurred, regardless of when the cash is received or paid.
Table A1.8 provides a reconciliation of the two measures, starting with the budgetary balance. Non-budgetary transactions shown in the table reflect the reversal of certain revenues and expenses included in the budgetary balance that have no impact on cash flows in the year, such as the amortization of non-financial assets. They also include the addition of changes in asset and liability balances that have no accrual impact in a year but do result in the inflow or outflow of cash, such as the payment of accounts payable. An increase in a liability or decrease in an asset represents a financial source, whereas a decrease in a liability or increase in an asset represents a financial requirement. The sum of the budgetary balance and changes in asset and liability balances reflected under non-budgetary transactions is equal to the government's net source of (+), or requirement for (-), cash.
| Projection | |||||||
|---|---|---|---|---|---|---|---|
| 2022– 2023 |
2023– 2024 |
2024– 2025 |
2025– 2026 |
2026– 2027 |
2027– 2028 |
2028– 2029 |
|
| Budgetary balance | -35.3 | -40.0 | -39.8 | -38.9 | -30.8 | -26.8 | -20.0 |
| Non-budgetary transactions | |||||||
| Pensions and other accounts | 12.8 | 10.5 | 6.1 | 4.8 | 1.9 | 2.5 | -1.5 |
| Non-financial assets | -5.0 | -2.6 | -4.5 | -5.0 | -6.4 | -5.1 | -7.9 |
| Loans, investments, and advances | |||||||
| Enterprise Crown corporations | -5.7 | -15.5 | -42.0 | -48.9 | -51.2 | -51.2 | -46.4 |
| Other | 1.2 | 13.1 | -6.0 | -5.8 | -0.4 | -6.5 | -4.4 |
| Total | -4.5 | -2.4 | -48.0 | -54.6 | -51.6 | -57.6 | -50.9 |
| Other transactions | |||||||
| Accounts payable, receivable, accruals, and allowances | -18.4 | -44.2 | -10.0 | -7.0 | -7.1 | -8.9 | -9.1 |
| Foreign exchange activities and derivatives | -15.8 | -10.7 | -6.1 | -5.9 | -5.2 | -5.1 | -5.1 |
| Total | -34.2 | -54.9 | -16.1 | -12.9 | -12.3 | -14.0 | -14.2 |
| Total non-budgetary transactions | -30.8 | -49.4 | -62.6 | -67.8 | -68.4 | -74.3 | -74.5 |
| Financial source (requirement) | -66.2 | -89.4 | -102.4 | -106.7 | -99.1 | -101.0 | -94.5 |
As shown in Table A1.8, a financial requirement is projected in each year over the forecast horizon, reflecting financial requirements associated with the projected budgetary deficits, as well as forecast requirements from non-budgetary activities.
A financial source is projected for pensions and other accounts for most years over the forecast horizon. Pensions and other accounts include the activities of the Government of Canada's employee pension plans and those of federally appointed judges and Members of Parliament, as well as a variety of other employee future benefit plans, such as health care and dental plans, and disability and other benefits for veterans and others. A financial source for pensions and other accounts reflects the difference between non-cash pension and benefit expenses recorded as part of the budgetary balance to reflect the value of benefits earned by employees during a fiscal year and the annual cash outflows for benefit payments.
Financial requirements for non-financial assets mainly reflect the difference between cash outlays for the acquisition of new tangible capital assets and the amortization of capital assets included in the budgetary balance. They also include disposals of tangible capital assets and changes in inventories and prepaid expenses. Financial requirements are projected in each year over the forecast horizon, reflecting forecast net growth in non-financial assets.
Loans, investments, and advances include the government's investments in enterprise Crown corporations, including Canada Mortgage and Housing Corporation (CMHC), Export Development Canada, the Business Development Bank of Canada, and Farm Credit Canada, as well as purchases of Canada Mortgage Bonds issued by CMHC. They also include loans, investments, and advances to national and provincial governments and international organizations, and under government programs, including the Canada Emergency Business Account (CEBA).
During the pandemic, CEBA provided $49 billion in interest-free, partially forgivable loans of up to $60,000 to nearly 900,000 small businesses and not-for-profit organizations. In September 2023, the government announced a further extension in deadlines and flexibilities for CEBA loan repayments, including extending the term loan repayment deadline another year to December 31, 2026. Small businesses and not-for-profits unable to secure refinancing or generate enough cash flow to repay their loans now have access to a low-interest loan of up to $60,000, for an additional year. These changes also apply to CEBA-equivalent lending through the Regional Relief and Recovery Fund.
The projected financial source for other loans, investments, and advances in 2023-24 is due to repayments of CEBA loans, reflecting the January 18, 2024, forgiveness repayment date.
In general, loans, investments, and advances are expected to generate additional revenues for the government in the form of interest or additional net profits of enterprise Crown corporations, which partly offset debt charges associated with these borrowing requirements. These revenues are reflected in the budgetary balance projections.
Other transactions include the payment of tax refunds and other accounts payable, the collection of taxes and other accounts receivable, the conversion of other accrual adjustments included in the budgetary balance into cash, as well as foreign exchange activities and derivatives. Projected cash requirements over the forecast horizon mainly reflect changes in accounts payable and accounts receivable and forecast increases in the government's official international reserves held in the Exchange Fund Account.
Economic Scenarios Analysis
As discussed in the Economic Overview, the macroeconomic inputs of the March 2024 survey continue to provide a reasonable basis for fiscal planning. However, to facilitate prudent economic and fiscal planning, and in light of continued global uncertainty and heightened geopolitical tensions, the Department of Finance has developed two scenarios that consider faster or slower growth tracks relative to the March survey (Table A1.9).
Downside Scenario
The downside scenario sees a shallow recession in Canada. Various headwinds such as structural imbalances in housing markets and spillovers from geopolitical tensions keep inflation and interest rates elevated for longer than expected, with adverse effects on confidence and consumer activity. At the same time, the U.S. also sees persistent inflation, higher interest rates, and subsequently slower growth. Along with a weaker economic recovery in China, this contributes to slower global growth and lower commodity prices. All these factors result in real GDP in Canada contracting by 0.7 per cent from peak to trough, compared to a period of moderate below-potential growth expected in the survey.
- CPI inflation is 0.5 percentage points above the March survey, on average, in 2024 and 2025. CPI inflation stays around 3 per cent until the end of 2024 and reaches about 2 per cent in 2026.
- In response to higher CPI inflation, short-term interest rates remain elevated throughout 2024, with the first rate cut in the first quarter of next year—two quarters later than in the survey. Overall, short-term interest rates are up by 0.8 percentage points, on average, in 2024 and 2025.
- As a result of higher interest rates, tighter financial conditions, and weaker global activity, the Canadian economy sees a mild recession in 2024. Real GDP contracts by 0.7 per cent from peak to trough, significantly less than in the 2008-09 recession (-4.4 per cent). On an annual basis, real GDP growth is negative in 2024 and slower than the survey in 2025, before picking up in 2026 and 2027.
- Consistent with weaker economic activity, the unemployment rate rises to a peak of 7.0 per cent in the last quarter of 2024 and is 0.6 percentage points higher than the survey, on average, in 2025. This is significantly less than in the 2008-09 recession (8.7 per cent).
- Despite higher CPI inflation, GDP inflation is lower than in the survey due to lower commodity prices. Crude oil prices decline from US$78 per barrel in 2023 to US$71 per barrel in 2024 and US$66 per barrel in 2025 (down from US$78 per barrel in the survey) and gradually converge close to the survey outlook by 2028.
- Together, slower real GDP growth and lower GDP inflation reduce the level of nominal GDP by $34 billion, on average per year, compared to the survey.
Upside Scenario
In the upside scenario, the Canadian economy sees faster economic growth than in the survey. A more resilient U.S. economy—underpinned by strong balance sheets for households and firms and recent supply-side improvements in productivity—benefits the Canadian economy through higher export demand and improved global commodity prices. Despite more economic resilience, inflation slows roughly as expected in the survey, both in Canada and globally, amid falling input costs. These developments result in economic growth picking up faster than expected in the second half of 2024. The improved global outlook, alongside extended crude oil production cuts by OPEC+, leave oil prices above the survey.
- As a result of spillover effects from a stronger U.S. economy, the Canadian economy expands at a pace close to potential over the course of 2024 rather than the moderate growth expected in the March survey. On an annual basis, real GDP growth is 1.4 per cent in 2024 (up 0.7 percentage points from the March survey) and 2.2 per cent in 2025 (up 0.3 percentage points).
- With a stronger economy, the unemployment rate rises by less than expected, reaching a peak of 6.2 per cent in the third quarter of 2024 (compared to 6.5 per cent in the March survey) and averaging 0.4 percentage points below the survey in 2025.
- Despite a similar pace of CPI inflation, GDP inflation is higher than in the survey as stronger global activity results in higher commodity prices. After averaging US$78 per barrel in 2023, WTI crude oil prices average US$83 per barrel in 2024 and US$87 per barrel in 2025 (up from US$78 per barrel in the survey) and remain US$8 per barrel above the survey on average per year over the rest of the forecast horizon.
- Together, faster real GDP growth and higher GDP inflation raise the level of nominal GDP by $34 billion, on average per year, compared to the survey.
| 2024 | 2025 | 2026 | 2027 | 2028 | 2024- 2028 |
|
|---|---|---|---|---|---|---|
| Real GDP growth | ||||||
| Budget 2024 | 0.7 | 1.9 | 2.2 | 2.1 | 2.0 | 1.8 |
| Downside Scenario | -0.1 | 1.2 | 2.8 | 2.6 | 2.1 | 1.7 |
| Upside Scenario | 1.4 | 2.2 | 2.1 | 1.9 | 1.9 | 1.9 |
| GDP inflation | ||||||
| Budget 2024 | 3.0 | 1.9 | 2.0 | 2.0 | 2.0 | 2.2 |
| Downside Scenario | 2.6 | 1.8 | 2.5 | 2.2 | 2.1 | 2.2 |
| Upside Scenario | 3.4 | 2.0 | 1.9 | 2.0 | 1.9 | 2.2 |
| Nominal GDP growth | ||||||
| Budget 2024 | 3.8 | 3.9 | 4.2 | 4.2 | 4.0 | 4.0 |
| Downside Scenario | 2.4 | 3.0 | 5.3 | 4.9 | 4.3 | 4.0 |
| Upside Scenario | 4.8 | 4.3 | 4.1 | 3.9 | 3.9 | 4.2 |
| Nominal GDP level (billions of dollars) | ||||||
| Budget 2024 | 2,998 | 3,115 | 3,246 | 3,382 | 3,518 | |
| Downside Scenario | 2,959 | 3,047 | 3,209 | 3,366 | 3,510 | |
| Upside Scenario | 3,027 | 3,157 | 3,286 | 3,414 | 3,547 | |
|
Difference between Budget 2024 and Downside Scenario
|
-39 | -68 | -37 | -16 | -8 | -34 |
|
Difference between Budget 2024 and Upside Scenario
|
29 | 42 | 40 | 32 | 28 | 34 |
| 3-month treasury bill rate | ||||||
| Budget 2024 | 4.5 | 3.1 | 2.7 | 2.7 | 2.7 | 3.1 |
| Downside Scenario | 5.0 | 4.2 | 3.1 | 2.8 | 2.7 | 3.6 |
| Upside Scenario | 4.3 | 2.9 | 2.7 | 2.7 | 2.7 | 3.1 |
| Unemployment rate | ||||||
| Budget 2024 | 6.3 | 6.3 | 6.0 | 5.8 | 5.7 | 6.0 |
| Downside Scenario | 6.5 | 6.9 | 6.4 | 6.0 | 5.9 | 6.3 |
| Upside Scenario | 6.1 | 5.9 | 5.7 | 5.6 | 5.5 | 5.8 |
| Consumer Price Index inflation | ||||||
| Budget 2024 | 2.5 | 2.1 | 2.1 | 2.0 | 2.0 | 2.1 |
| Downside Scenario | 3.0 | 2.6 | 2.1 | 2.0 | 2.0 | 2.4 |
| Upside Scenario | 2.4 | 1.9 | 2.0 | 2.0 | 2.0 | 2.1 |
| West Texas Intermediate crude oil price ($US per barrel) | ||||||
| Budget 2024 | 78 | 78 | 78 | 78 | 78 | 78 |
| Downside Scenario | 71 | 66 | 72 | 75 | 77 | 72 |
| Upside Scenario | 83 | 87 | 87 | 85 | 84 | 85 |
|
Note: Forecast averages may not equal average of years due to rounding. Numbers may not add due to rounding. Sources: Statistics Canada; Department of Finance Canada March 2024 survey of private sector economists; Department of Finance Canada calculations. |
||||||
Fiscal Impacts of Economic Scenarios
The potential impact of the two economic scenarios on projected federal deficit and debt-to-GDP ratios are depicted in Chart A1.1 below.
Federal Debt-to-GDP Ratio in Economic Scenarios
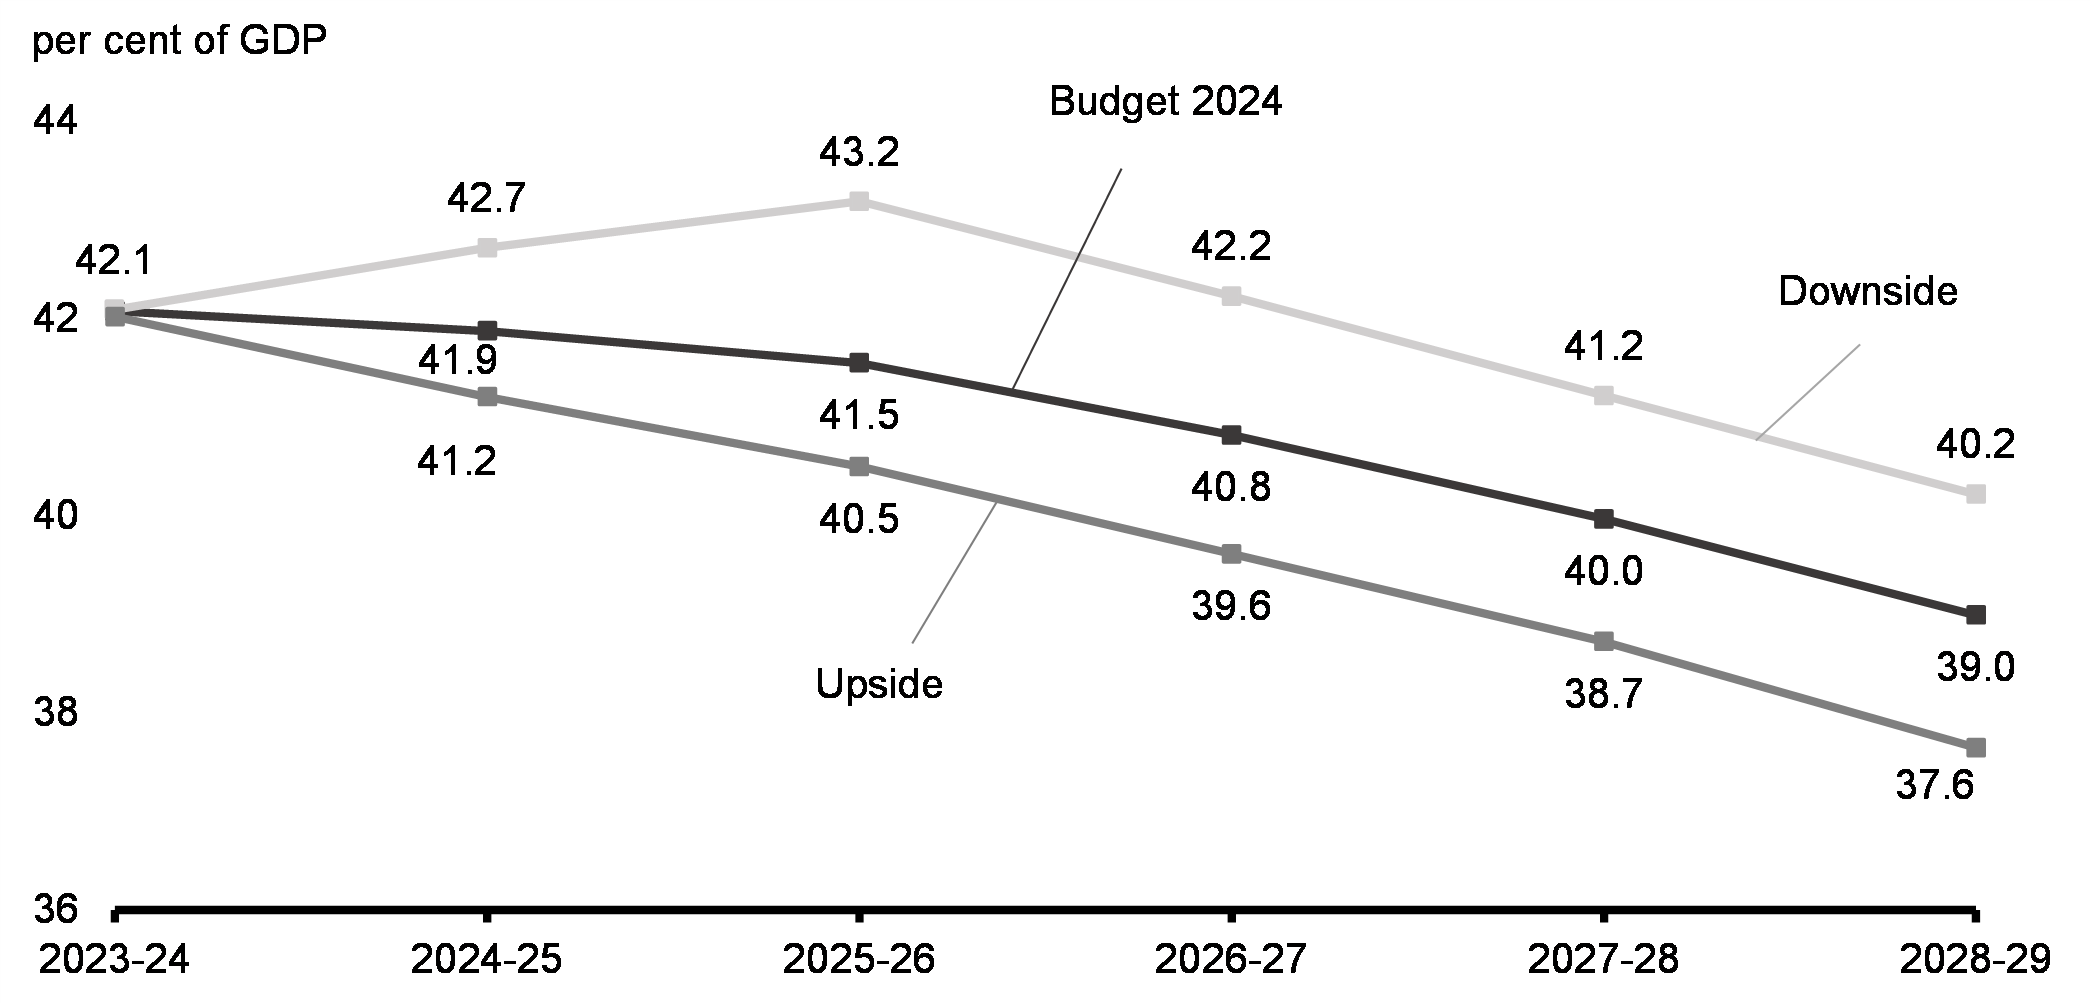
Downside Scenario Fiscal Impact
In the downside scenario, the deficit would increase by $7.9 billion annually on average over the planning horizon. The weakened outlook for nominal GDP would entail somewhat weaker revenues (down on average by $3.8 billion annually), while higher unemployment and CPI inflation lead to higher costs of benefits programs, the main drivers of higher program expenses (up on average by about $1.9 billion annually), and higher interest rates result in higher public debt charges (up by about $2.5 billion on average).
As a result of higher deficits and weaker nominal GDP growth, the federal debt-to-GDP ratio would be expected to rise to 43.2 per cent by 2025-26, before declining to 40.2 per cent by 2028-29.
Upside Scenario Fiscal Impact
In the upside scenario, the deficit would improve by an average of $7.0 billion per year. Stronger nominal GDP growth results in higher income tax revenues and the improved outlook for consumption would bring in higher projected GST revenues. Overall, revenues are projected to be $4.5 billion higher annually, on average, in this scenario. On the expense side, the lower projected CPI inflation and unemployment means lower expenses for CPI-indexed programs and Employment Insurance benefits, bringing program expenses down by $0.8 billion on average annually. Lower interest rates mean that public debt charges would also be lower by an average of $1.8 billion annually under this scenario. Overall, expenses would be $2.5 billion lower annually, on average, in the upside scenario.
As a result of the lower deficits and stronger nominal GDP growth, the federal debt-to-GDP ratio would fall to 37.6 per cent by 2028-29.
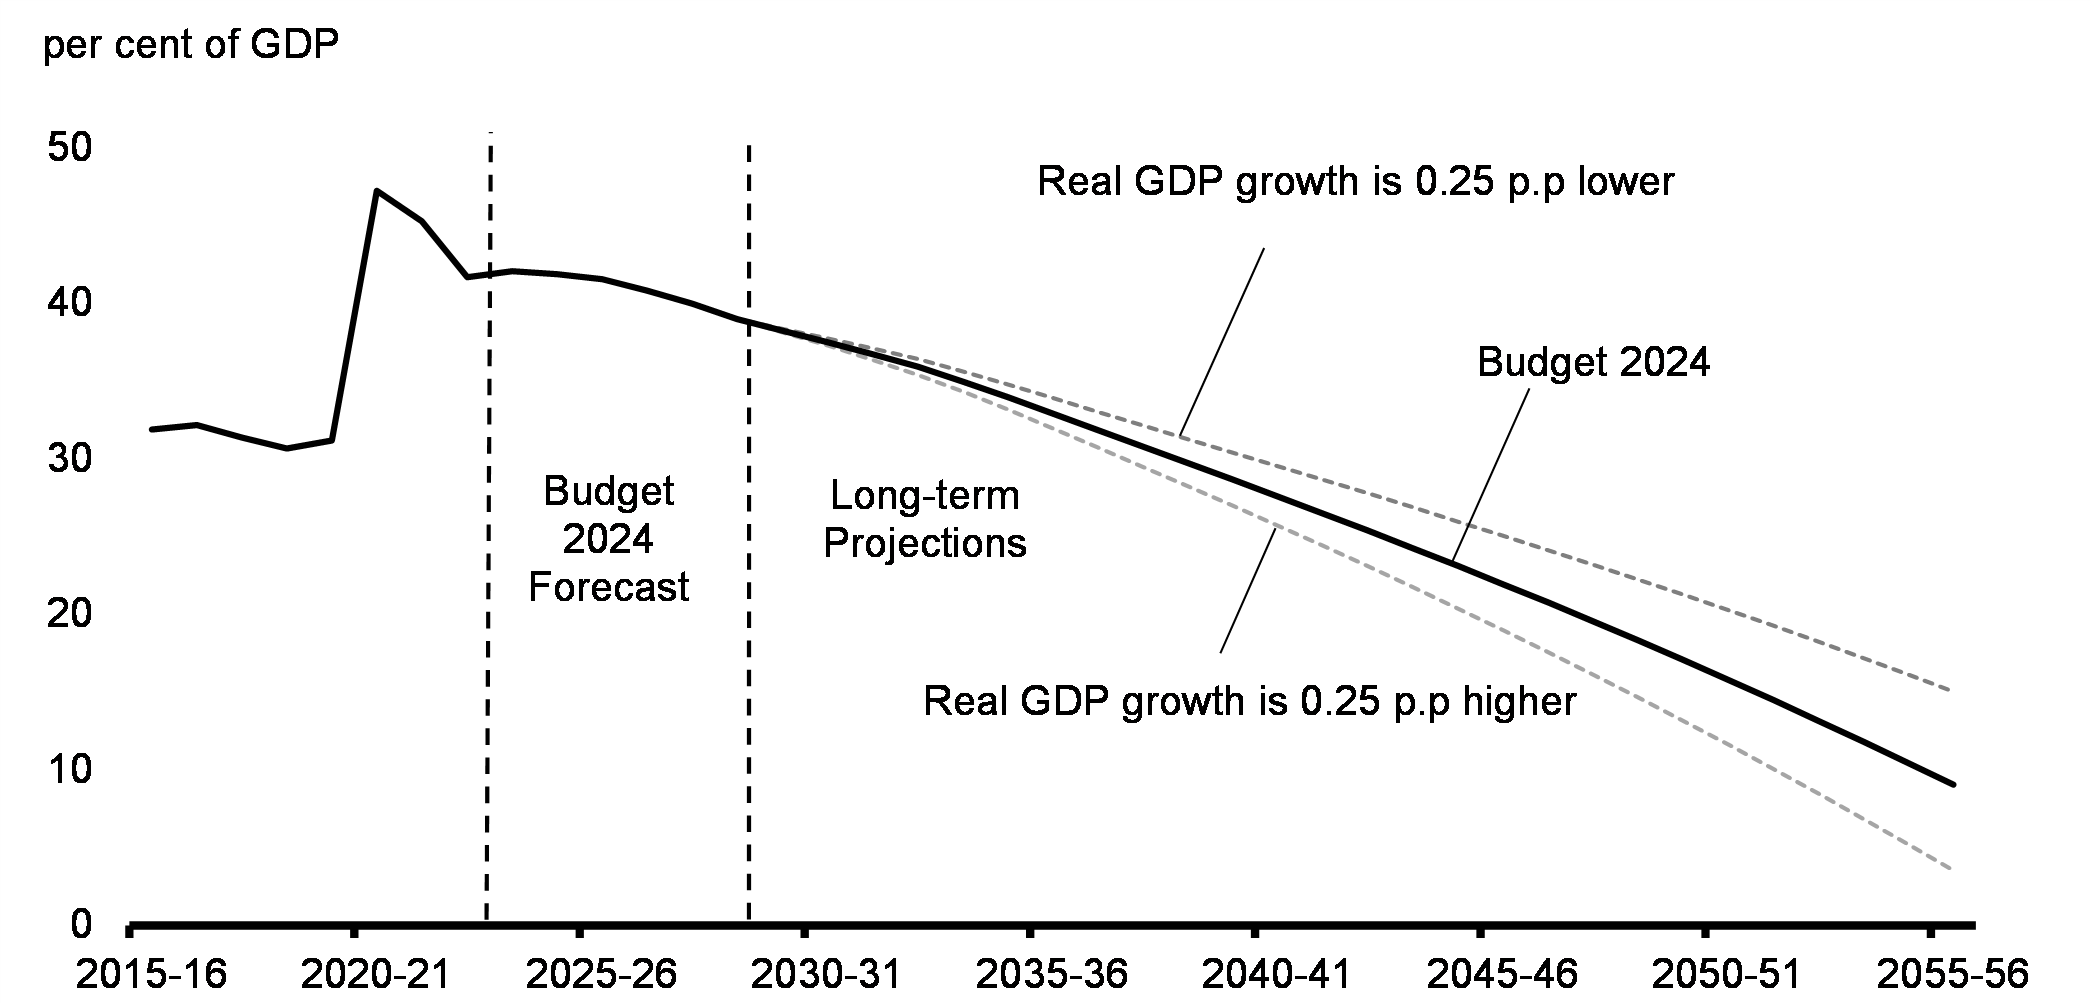
Long-Term Debt Projections
As with any projection that extends over several decades, the long-term debt-to-GDP ratio projections presented in Budget 2024 are subject to a high degree of uncertainty and are sensitive to assumptions. They should not be viewed as predictions of the future, but instead as modelling scenarios based on a set of reasonable economic and demographic assumptions, assuming no future changes in policies.
Building on the Budget 2024 forecast, long-term fiscal projections continue to indicate that federal public finances are sustainable beyond the usual forecast horizon (Chart A1.2). This is despite adverse demographic trends, including an aging population, assumed moderate future productivity growth rates, and higher borrowing costs. As discussed in more detail below, this conclusion is also robust to changes in assumptions, including, for example, the projected growth rate of real GDP.
Long-Term Federal Debt Projections
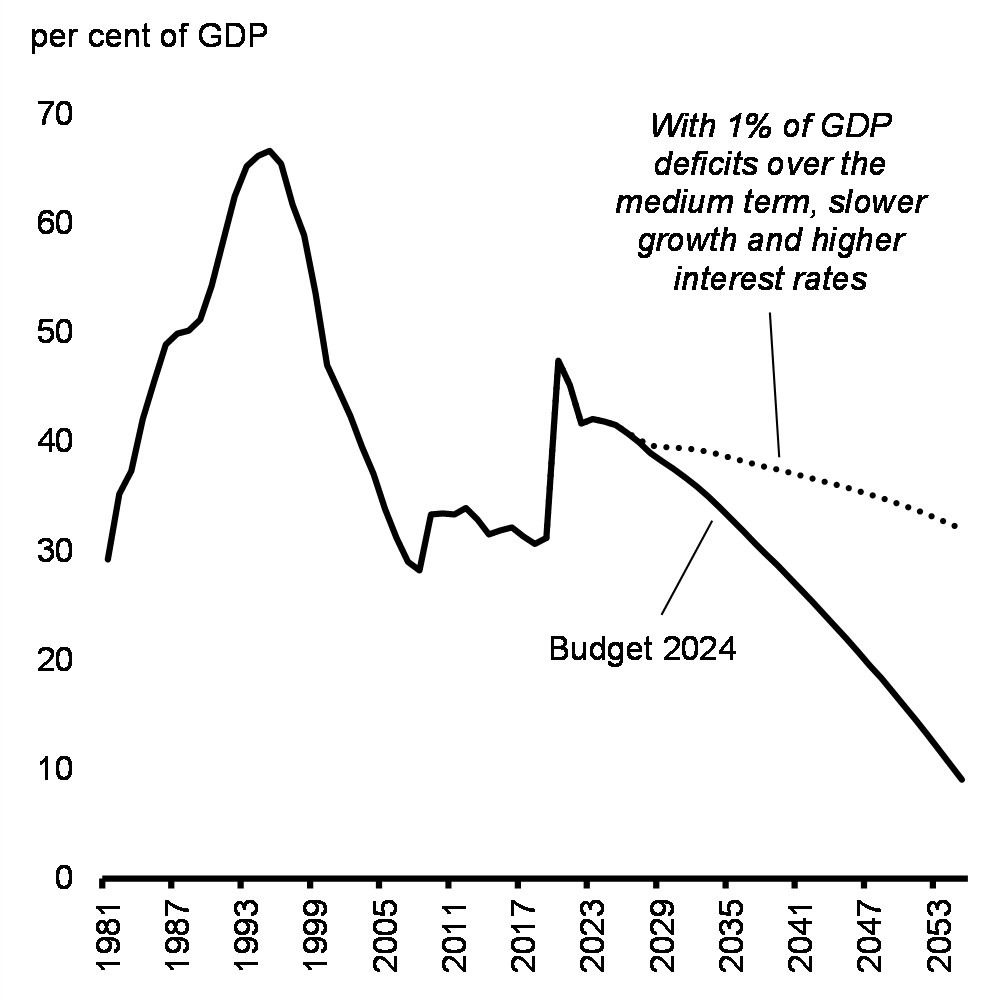
Keeping the federal debt-to-GDP ratio on a downward trend over the medium- and longer-term will help ensure that future generations are not burdened with debt and that fiscal room remains available to face future challenges and risks that are not accounted for in this projection, such as recessions, new pandemics, geopolitical risk, climate change, and the transition to net-zero. Long-term fiscal sustainability was further reinforced by the government's maintained commitment to the fiscal objectives announced in the 2023 Fall Economic Statement (see Box A1.2).
In the 2023 Fall Economic Statement, the government set out fiscal objectives in preparing for Budget 2024 to help continue delivering on its fiscal anchor: reducing federal debt as a share of the economy over the medium term. One of these fiscal objectives, keeping deficits below 1 per cent of GDP, beginning in 2026-27, is also particularly important in helping to ensure Canada's fiscal advantage is preserved beyond the medium term.
Keeping deficits below 1 per cent of GDP provides additional insurance that public finances remain strong beyond the medium term as Canada adapts to an aging population, the impacts of climate change, and the transition to net zero. This ensures Canada has the fiscal capacity to weather future shocks, such as how the federal government was able to provide temporary, emergency supports to Canadians and businesses throughout the pandemic. It also helps to preserve the overall strength of Canada's fiscal position compared to other G7 countries.
For example, long-term simulations suggest that the federal debt-to-GDP ratio and the public debt charges-to-GDP ratio would still be on a declining trend and remain historically low under both permanently slower economic growth (-0.25 percentage points) and higher interest rates (+0.5 percentage points) if medium-term deficits are limited to 1 per cent of GDP (Charts A1.3 and A1.4).
Long-Term Federal Debt Projections
Long-Term Public Debt Charge Projections
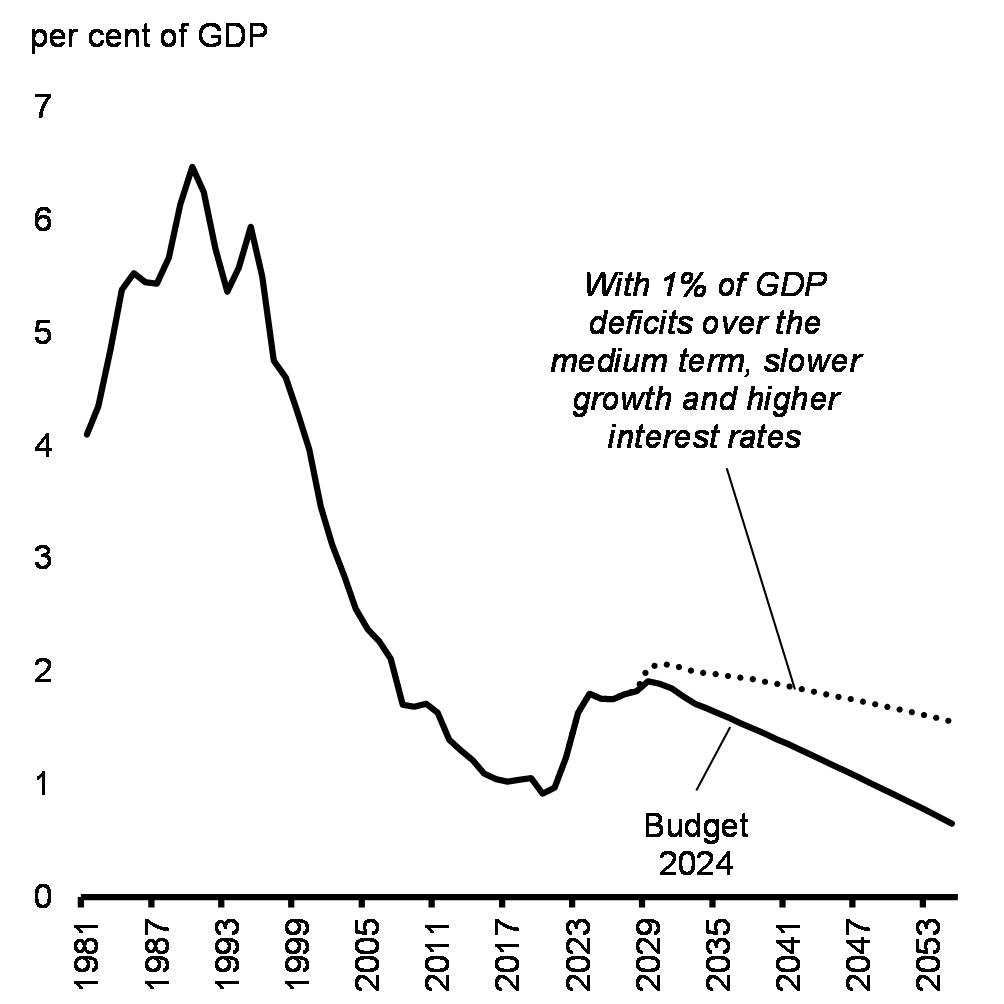
Notes: Simulations assume constant deficits of 1 per cent of GDP between 2026-27 and 2028-29. Thereafter, usual long-term assumptions are applied with slower economic growth and higher interest rates starting in 2029. On a fiscal year basis. Last projection year is 2055-56.
Sources: Statistics Canada; Department of Finance Canada.
To form the long-term economic projections, the medium-term (2024 to 2028) economic forecasts presented in Budget 2024 are extended to 2055 using the Department of Finance Canada's long-term economic projection model. In this model, annual real GDP growth depends on labour productivity growth (1 per cent per year), which is calibrated over its 1974-2019 historical average, and labour supply growth (average of 0.6 per cent per year), which is based on demographic projections produced by Statistics Canada and projections for the labour force participation rate and average hours worked using econometric models developed by the Department. Assuming a constant 2 per cent annual rate for GDP inflation, nominal GDP is projected to grow by an average of 3.6 per cent per year from 2029 to 2055 (Table A1.10).
| 1970–2023 | 2024–2028 | 2029–2055 | |
|---|---|---|---|
| Real GDP growth | 2.6 | 1.8 | 1.6 |
| Contributions of (percentage points): | |||
|
Labour supply growth
|
1.5 | 0.9 | 0.6 |
|
Working-age population
|
1.5 | 1.6 | 0.8 |
|
Labour force participation
|
0.2 | -0.6 | -0.2 |
|
Unemployment rate
|
0.0 | -0.1 | 0.0 |
|
Average hours worked
|
-0.2 | -0.1 | -0.1 |
|
Labour productivity growth
|
1.1 | 0.9 | 1.0 |
| Nominal GDP growth | 6.8 | 4.0 | 3.6 |
|
Note: Contributions may not add up due to rounding. Sources: Statistics Canada; Department of Finance Canada calculations. |
|||
The long-term federal debt projections are obtained through an accounting model in which each revenue and expense category is modelled as a function of its underlying demographic and economic variables, with the relationships defined by a mix of current government policies and assumptions. The key assumptions underlying fiscal projections from 2029-30 through 2055-56 are the following:
- All tax revenues as well as direct program expenses grow broadly with nominal GDP, with the exceptions of a number of measures that will no longer be available after a certain date (e.g., the Clean Electricity, Clean Technology, and Clean Hydrogen investment tax credits and funding to support clean electricity projects) which are incorporated based on their projected costs.
- The Canada Health Transfer, Canada Social Transfer, and Equalization grow with their respective legislated escalators. The remaining major transfers to provinces, territories and municipalities grow according to their respective factors, with nominal GDP, the targeted populations and inflation, current legislation or agreements.
- The Old Age Security program and children's benefits grow with the targeted populations and inflation. Employment Insurance (EI) benefits grow in line with the number of beneficiaries and the growth in average weekly earnings. The EI premium rate grows according to current program parameters.
- The effective interest rate on interest-bearing federal debt is assumed, under the baseline scenario, to gradually increase from about 3.0 per cent in 2028–29 to 3.4 per cent by 2055-56.
Sensitivity analysis shows that the long-term fiscal projections are robust to some changes to key assumptions (Tables A1.11 and A1.12).
| Baseline2 | High | Low | |
|---|---|---|---|
| Demographic: | |||
| Fertility rate (average births per woman) | 1.5 births | +0.5 births | -0.5 births |
| Immigration (per cent of population) | 0.9 | +0.25 p.p. | -0.25 p.p. |
| Life expectancy at 65 | 23.1 years | +3 years | -3 years |
| Economic: | |||
| Total labour force participation rate (per cent) | 62.6 | +2.0 p.p. | -2.0 p.p. |
| Average weekly hours worked (hours) | 32.7 | +1.0 hour | -1.0 hour |
| Unemployment rate (per cent) | 5.8 | +1.0 p.p. | -1.0 p.p. |
| Labour productivity (per cent) | 1.0 | +0.25 p.p. | -0.25 p.p. |
| Interest rates (per cent) | 3.3 | +1.0 p.p. | -1.0 p.p. |
|
Note: p.p. = percentage point. 1 These alternative assumptions are applied starting in 2029 except for changes in life expectancy, which are gradually applied over the projection horizon. 2 Baseline shown as the average over the period 2029 to 2055. |
|||
| Baseline | High | Low | ||||
|---|---|---|---|---|---|---|
| Budgetary Balance | Debt | Budgetary Balance | Debt | Budgetary Balance | Debt | |
| Demographic: | ||||||
| Fertility rate | 1.1 | 9.0 | 0.8 | 12.8 | 1.3 | 5.2 |
| Immigration | 1.1 | 9.0 | 1.4 | 3.9 | 0.6 | 15.1 |
| Life expectancy at 65 | 1.1 | 9.0 | 0.7 | 12.3 | 1.3 | 6.4 |
| Economic: | ||||||
| Total labour force participation rate | 1.1 | 9.0 | 1.3 | 4.4 | 0.8 | 14.1 |
| Average weekly hours worked | 1.1 | 9.0 | 1.3 | 4.6 | 0.8 | 13.9 |
| Unemployment rate | 1.1 | 9.0 | 1.0 | 10.6 | 1.1 | 7.5 |
| Labour productivity | 1.1 | 9.0 | 1.5 | 3.5 | 0.6 | 15.1 |
| Interest rates | 1.1 | 9.0 | 0.6 | 17.0 | 1.3 | 2.7 |
Supplementary Information
Sensitivity of Fiscal Projections to Economic Shocks
Changes in economic assumptions affect the projections of revenues and expenses. The following tables illustrate the sensitivity of the projected budgetary balance to the following economic shocks relative to Budget 2024 projections:
- A one-year, 1-percentage-point decrease in real GDP growth driven equally by lower productivity and employment growth.
- A decrease in nominal GDP growth resulting solely from a one-year, 1-percentage-point decrease in the rate of GDP inflation (assuming that the Consumer Price Index moves in line with GDP inflation).
- A sustained 100-basis-point increase in all interest rates.
These sensitivities are estimates that assume any decrease in economic activity is proportional across income and expenditure components and are meant to provide a broad illustration of the impact of economic shocks on the outlook for the budgetary balance. The sensitivity analysis conducted in this section has been presented routinely in budgets since 1994 and is separate from the upside and downside scenarios presented earlier in this annex. Actual economic shocks may have different fiscal impacts. For example, they may be concentrated in specific sectors of the economy or cause different responses in key economic variables (e.g., GDP inflation and CPI inflation may have different responses to a given shock).
| Year 1 | Year 2 | Year 5 | |
|---|---|---|---|
| Federal revenues | |||
|
Tax revenues
|
|||
|
Personal income tax
|
-2.8 | -2.9 | -3.3 |
|
Corporate income tax
|
-0.9 | -0.9 | -0.9 |
|
Goods and Services Tax
|
-0.5 | -0.5 | -0.6 |
|
Other
|
-0.1 | -0.1 | -0.1 |
|
Total tax revenues
|
-4.3 | -4.4 | -4.5 |
|
Employment Insurance premiums
|
0.2 | 1.0 | 1.0 |
|
Other revenues
|
-0.1 | -0.1 | -0.1 |
| Total budgetary revenues | -4.2 | -3.6 | -4.0 |
| Federal expenses | |||
|
Major transfers to persons
|
|||
|
Elderly benefits
|
0.0 | 0.0 | -0.1 |
|
Employment Insurance benefits
|
1.0 | 1.0 | 1.1 |
|
Canada Child Benefit
|
0.0 | 0.1 | 0.2 |
|
Total major transfers to persons
|
1.0 | 1.1 | 1.2 |
|
Other program expenses
|
-0.3 | -0.1 | -0.2 |
|
Public debt charges
|
0.1 | 0.2 | 0.6 |
| Total expenses | 0.8 | 1.2 | 1.6 |
| Budgetary balance | -4.9 | -4.8 | -5.6 |
A 1 percentage point decrease in real GDP growth proportional across income and expenditure components reduces the budgetary balance by $4.9 billion in the first year, $4.8 billion in the second year, and $5.6 billion in the fifth year (Table A1.13).
- Tax revenues from all sources fall by a total of $4.2 billion in the first year. Personal income tax revenues decrease as employment and the underlying tax base fall. Corporate income tax revenues fall as output and profits decrease. GST revenues decrease because of lower consumer spending associated with the fall in employment and personal income.
- EI premium revenues increase as a result of an increase in the EI premium rate, which, under the seven-year break-even mechanism, adjusts to offset the increase in benefits due to the higher number of unemployed, such that the EI Operating Account balances over time.
- Expenses rise, mainly reflecting higher EI benefits (due to an increase in the number of unemployed) and higher public debt charges (reflecting a higher stock of debt due to the lower budgetary balance). This rise is partially offset by lower other program expenses, like Equalization, as the decline in real GDP is reflected in nominal GDP, to which these payments are indexed.
| Year 1 | Year 2 | Year 5 | |
|---|---|---|---|
| Federal revenues | |||
|
Tax revenues
|
|||
|
Personal income tax
|
-2.7 | -2.5 | -2.6 |
|
Corporate income tax
|
-0.8 | -0.8 | -0.9 |
|
Goods and Services Tax
|
-0.5 | -0.5 | -0.6 |
|
Other
|
-0.2 | -0.2 | -0.2 |
|
Total tax revenues
|
-4.2 | -4.1 | -4.3 |
|
Employment Insurance premiums
|
0.0 | -0.1 | -0.2 |
|
Other revenues
|
-0.1 | -0.1 | -0.1 |
| Total budgetary revenues | -4.3 | -4.2 | -4.6 |
| Federal expenses | |||
|
Major transfers to persons
|
|||
|
Elderly benefits
|
-0.5 | -0.9 | -1.0 |
|
Employment Insurance benefits
|
-0.1 | -0.1 | -0.2 |
|
Canada Child Benefit
|
0.0 | -0.1 | -0.3 |
|
Total major transfers to persons
|
-0.6 | -1.2 | -1.5 |
|
Other program expenses
|
-0.7 | -0.7 | -1.5 |
|
Public debt charges
|
-0.6 | 0.2 | 0.3 |
| Total expenses | -2.0 | -1.7 | -2.7 |
| Budgetary balance | -2.3 | -2.6 | -1.9 |
A 1 percentage point decrease in nominal GDP growth proportional across income and expenditure components, resulting solely from lower GDP inflation (assuming that the CPI moves in line with GDP inflation), lowers the budgetary balance by $2.3 billion in the first year, $2.6 billion in the second year, and $1.9 billion in the fifth year (Table A1.14).
- Lower prices result in lower nominal income and, as a result, personal income tax revenues decrease. As the parameters of the personal income tax system are indexed to inflation, the fiscal impact is smaller than under the real shock. For the other sources of tax revenue, the negative impacts are similar under the real and nominal GDP shocks.
- EI premium revenues decrease in response to lower earnings.
- Other revenues decline slightly as lower prices lead to lower revenues from the sales of goods and services, and lower growth in tax revenue results in slightly lower interest and penalty revenue.
- Partly offsetting lower revenues are the declines in the cost of statutory programs that are indexed to CPI inflation, such as elderly benefit payments, which put downward pressure on federal program expenses. In addition, other program expenses are also lower as certain programs are linked directly to growth in nominal GDP, such as Equalization.
- Public debt charges decline in the first year due to lower costs associated with Real Return Bonds.
| Year 1 | Year 2 | Year 5 | |
|---|---|---|---|
| Federal revenues | 1.2 | 2.4 | 5.3 |
| Federal expenses | 4.9 | 7.9 | 13.0 |
| Budgetary balance | -3.7 | -5.5 | -7.7 |
A 1 per cent increase in interest rates decreases the budgetary balance by $3.7 billion in the first year, $5.5 billion in the second year, and $7.7 billion in the fifth year (Table A1.15). Higher interest rates directly impact estimated public debt charges on marketable debt in two ways. First, interest costs increase as existing debt matures and is refinanced at higher rates. Second, rising rates increase the expected cost of future borrowing needs. Public debt charges are estimated based on the current expectations for future changes in interest rates, which are subject to change based on economic conditions.
It is important to note that interest rates also directly affect other government revenues and expenses and that they typically do not change in isolation. That is, with higher interest rates, the government would realize some offsetting benefits, including:
- Higher revenues from the government's interest-bearing assets, and interest and penalty revenue on tax debt, which are recorded as part of other revenues;
- Corresponding downward adjustments that reduce the valuations of public sector pensions and employee benefits obligations, which are not incorporated in the table above; and,
- Higher government tax revenues if interest rate increases were due to stronger economic growth (also not included in the table above).
Even with a 1 per cent increase in interest rates, public debt charges are sustainable and would remain near historic lows as a proportion of GDP.
Policy Actions Taken Since the 2023 Fall Economic Statement
Since 2016, the government has provided a transparent overview of all policy actions taken between budgets and updates. These measures, listed in Table A1.16, ensure that Canadians are continually well-served by the programs they rely on and that government operations carry on.
| Dept. | 2023-2024 | 2024-2025 | 2025-2026 | 2026-2027 | 2027-2028 | 2028-2029 | |
|---|---|---|---|---|---|---|---|
| Growth, Climate Change, and Innovation | 153 | 73 | 88 | 117 | 22 | 22 | |
| Extending the Wine Sector Support Program1 | AAFC | 0 | 59 | 59 | 59 | 0 | 0 |
| Adjusting the Federal Low-Carbon Fuel Procurement Program2 | TBS | -10 | 0 | 0 | 0 | 0 | 0 |
| Emergency Wildfires Response1 | PCA | 38 | 0 | 0 | 0 | 0 | 0 |
| Funding for the Gordie Howe International Bridge Project1 | WDBA | 178 | 0 | 5 | 9 | 9 | 9 |
|
Less: Funds Previously Provisioned in the Fiscal
Framework
|
-178 | -5 | -10 | 0 | 0 | 0 | |
| Year-Over-Year Reallocation of Funding | 125 | 0 | -1 | -2 | -2 | -2 | |
| Supporting the St. Lawrence Seaway1 | TC | 0 | 73 | 89 | 106 | 15 | 15 |
|
Less: Funds Previously Provisioned in the Fiscal
Framework
|
0 | -55 | -54 | -55 | 0 | 0 | |
| Communities and Reconciliation | 758 | 58 | 76 | 27 | 26 | 24 | |
| Emergency Top-Up to Reaching Home: Canada's Homelessness Strategy1 | INFC | 100 | 0 | 0 | 0 | 0 | 0 |
|
Less: Funds Sourced from Existing Departmental
Resources
|
-101 | 0 | 0 | 0 | 0 | 0 | |
| Topping up the Canada Housing Benefit1,3 | CMHC | 99 | 0 | 0 | 0 | 0 | 0 |
| Interim Housing Assistance Program1 | IRCC | 362 | 0 | 0 | 0 | 0 | 0 |
| Prime Minister's Youth Council | PCH | 1 | 1 | 1 | 0 | 0 | 0 |
| Newfoundland's National War Memorial and Tomb of the Unknown Soldier1 | VAC | 3 | 1 | 0 | 0 | 0 | 0 |
| Veterans Affairs Canada Adjustments for Non-Discretionary Cost Fluctuations1 | VAC | 1 | 1 | 1 | 0 | 0 | 0 |
| Medals and Honours to Mark the Transition of the Crown | OSGG | 0 | 3 | 0 | 0 | 0 | 0 |
| Building a Medical Countermeasures Facility4 | PHAC | 32 | 33 | 33 | 33 | 33 | 33 |
| Less: Funds Sourced from Existing Resources | -60 | -61 | -65 | -65 | -66 | -67 | |
| Providing Essential Goods and Services within Federal Correctional Facilities1 | CSC | 20 | 58 | 58 | 58 | 58 | 58 |
| RCMP Contract Policing Program1 | RCMP | 171 | 22 | 22 | 1 | 1 | 0 |
| Reimbursing Security Costs for COP151 | PS, RCMP | 91 | 0 | 0 | 0 | 0 | 0 |
| Enhancing the Aboriginal Entrepreneurship Program1 | ISC | 9 | 0 | 0 | 0 | 0 | 0 |
| First Nations Clean Water Act | ISC | 0 | 25 | 25 | 0 | 0 | 0 |
|
Less: Funds Previously Provisioned in the Fiscal
Framework
|
-25 | -25 | 0 | 0 | 0 | 0 | |
| First Nations Elementary and Secondary Education1 | ISC | 55 | 0 | 0 | 0 | 0 | 0 |
| Canada in the World | 127 | 261 | 159 | 160 | 144 | 144 | |
| Additional Humanitarian Assistance in Gaza1 | GAC | 40 | 0 | 0 | 0 | 0 | 0 |
|
Less: Funds Sourced from International Assistance
Envelope Crisis Pool Resources
|
-40 | 0 | 0 | 0 | 0 | 0 | |
| Contributing to International Security Assistance Efforts in Haiti1 | Multiple | 19 | 104 | 0 | 0 | 0 | 0 |
|
Less: Funds Sourced from Existing Departmental
Resources and International Assistance Envelope Strategic Priorities Fund
|
-19 | -33 | 0 | 0 | 0 | 0 | |
| Global Affairs Canada Adjustments for Non-Discretionary Cost Fluctuations1,5 | GAC | 127 | 140 | 149 | 144 | 144 | 144 |
| Additional Peace and Security Assistance for Ukraine1 | Multiple | 0 | 50 | 10 | 16 | 0 | 0 |
| National Museum of the Holodomor-Genocide in Kyiv1 | GAC | 0 | 15 | 0 | 0 | 0 | 0 |
|
Less: Funds Sourced from International Assistance
Envelope Strategic Priorities Fund
|
0 | -15 | 0 | 0 | 0 | 0 | |
| Effective Government and Tax Fairness | 392 | 150 | 176 | 151 | 165 | 166 | |
| 2023-24 Adjustment to the Grant for the Canada-Quebec Accord on Immigration1 | IRCC | 48 | 0 | 0 | 0 | 0 | 0 |
| Employment and Social Development Canada Rent Price Adjustment6 | ESDC | 0 | 9 | 9 | 9 | 9 | 9 |
|
Less: Funds From CPP Account
|
0 | -2 | -2 | -2 | -2 | -2 | |
| Funding for the public inquiry into foreign interference in federal electoral processes1 | PCO, JUS | 3 | 15 | 0 | 0 | 0 | 0 |
| Government Postage and Banking Costs | PSPC | 0 | 6 | 13 | 21 | 36 | 36 |
| Obligations for Federal Public Sector Employee Benefit Plans1,7 | TBS | 179 | 0 | 0 | 0 | 0 | 0 |
| Price and Volume Protection for Federal Real Property | PSPC | 0 | 21 | 21 | 21 | 21 | 21 |
| Safeguarding Canada's Passport1 Program | IRCC | 143 | 0 | 0 | 0 | 0 | 0 |
|
Less: Funds Previously Provisioned in the Fiscal
Framework
|
-118 | 0 | 0 | 0 | 0 | 0 | |
| Implementing the Electoral Participation Act8 | Elections Canada | 0 | 4 | 34 | 4 | 4 | 4 |
| Marine Fuel Cost Pressures1 | DFO | 30 | 20 | 20 | 20 | 20 | 20 |
| Changes to Automobile Deduction Limits1 | — | 0 | 3 | 2 | 3 | 3 | 4 |
| Funding to support Revenu Québec's administration of the GST/HST system in Quebec1 | CRA | 270 | 0 | 0 | 0 | 0 | 0 |
|
Less: Funds Previously Provisioned in the Fiscal
Framework
|
-164 | 0 | 0 | 0 | 0 | 0 | |
| Supporting Canadian businesses with alcohol excise duty relief1 | — | 0 | 74 | 79 | 74 | 74 | 74 |
| (Net) Fiscal Impact of Non-Announced Measures9 | 1,840 | -279 | -842 | -743 | 518 | 345 | |
| Net Fiscal Impact – Total Policy Actions Since FES 2023 | 3,271 | 263 | -344 | -288 | 876 | 701 | |
|
Note: Numbers may not add due to rounding. 1 Measure previously included in 2023-24 Supplementary Estimates C, and/or previously announced. 2 As previously disclosed in the Treasury Board Secretariat's 2024-25 Departmental Plan, the government has updated the value of the Low-carbon Fuel Procurement Program to $134.9 million over eight years, starting in 2024-25. Unused funding in 2023-24 will return to the fiscal framework. To support the program in achieving climate objectives, additional flexibility in procurement is provided to include carbon dioxide removal services. 3 Funding to provide additional support to low-income renters through provincial and territorial programs. 4 Funding to build a new pre-clinical and clinical medical countermeasures facility to support ongoing research and preparedness for emerging public health threats. Reductions are based on a re-evaluation of the funding required to fulfill this commitment. 5 Non-discretionary cost increases were driven by several factors that impact missions abroad, such as changes in exchange rates and inflation. 6 Measure partially reimbursed by increased Employment Insurance premiums. 7 Non-discretionary funding for employer-related costs of employee insurance programs, including health, dental, and disability. 8 Timing of estimated costs is notional and would depend on the timing of a federal election. 9 The net fiscal impact of measures that are not announced is presented at the aggregate level and would include provisions for anticipated Cabinet decisions not yet made (including the use of such provisions from previous budgets and updates) and funding decisions related to national security, contract negotiations, litigation issues, and commercial sensitivity. |
|||||||
Glossary of Abbreviated Titles
| AAFC | Agriculture and Agri-Food Canada |
|---|---|
| CanNor | Canadian Northern Economic Development Agency |
| CATSA | Canadian Air Transport Security Authority |
| CBSA | Canada Border Services Agency |
| CFIA | Canadian Food Inspection Agency |
| CHRC | Canadian Human Rights Commission |
| CIRNAC | Crown-Indigenous Relationship and Northern Affairs Canada |
| CIHR | Canadian Institutes of Health Research |
| CMHC | Canada Mortgage and Housing Corporation |
| CRA | Canada Revenue Agency |
| CSA | Canadian Space Agency |
| CSC | Correctional Service of Canada |
| CSE | Communications Security Establishment Canada |
| CSIS | Canadian Security Intelligence Service |
| DFO | Fisheries and Oceans Canada |
| DND | National Defence |
| ECCC | Environment and Climate Change Canada |
| ESDC | Employment and Social Development Canada |
| FedDev | Federal Economic Development Agency for Southern Ontario |
| FedNor | Federal Economic Development Agency for Northern Ontario |
| FIN | Department of Finance Canada |
| GAC | Global Affairs Canada |
| HC | Health Canada |
| INFC | Infrastructure Canada |
| IRB | Immigration and Refugee Board of Canada |
| IRCC | Immigration, Refugees and Citizenship Canada |
| ISC | Indigenous Services Canada |
| ISED | Innovation, Science and Economic Development Canada |
| JUS | Justice Canada |
| NAC | National Arts Centre |
| NFB | National Film Board |
| NRCan | Natural Resources Canada |
| NRCC | National Research Council Canada |
| NSIRA | National Security and Intelligence Review Agency |
| OCI | Correctional Investigator Canada |
| OPC | Office of the Privacy Commissioner |
| OPSIC | Office of the Public Sector Integrity Commissioner of Canada |
| OSGG | Office of the Secretary to the Governor General |
| PacifiCan | Pacific Economic Development Canada |
| PCA | Parks Canada Agency |
| PCH | Canadian Heritage |
| PCO | Privy Council Office |
| PHAC | Public Health Agency of Canada |
| PrairiesCan | Prairies Economic Development Canada |
| PS | Public Safety Canada |
| PSC | Public Service Commission |
| PSPC | Public Services and Procurement Canada |
| RCMP | Royal Canadian Mounted Police |
| SCC-CCN | Standards Council of Canada |
| SSC | Shared Services Canada |
| StatCan | Statistics Canada |
| TBS | Treasury Board of Canada Secretariat |
| TC | Transport Canada |
| VAC | Veterans Affairs Canada |
| WDBA | Windsor-Detroit Bridge Authority |
Page details
- Date modified: