
Archived - Economic and Fiscal Overview
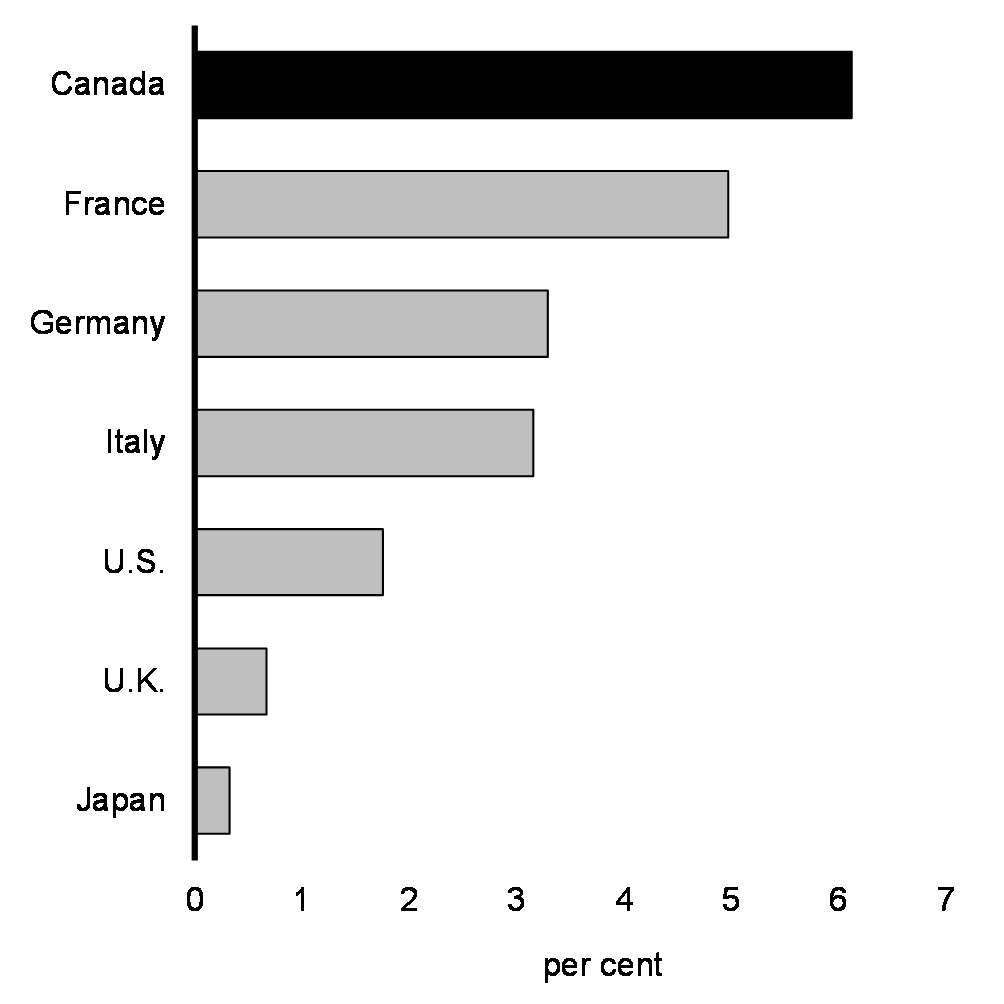
The Canadian economy is outperforming expectations. In the face of higher interest rates, Canada has avoided the recession that some had predicted. Inflation has fallen from its June 2022 peak of 8.1 per cent to 2.9 per cent in January and to 2.8 per cent in February 2024. The labour market remains solid. Over 1.1 million more Canadians are employed today than before the pandemic, marking the fastest jobs recovery in the G7 (Chart 1). Real wages (wages adjusted for inflation) have gone up, meaning Canadians, on average, have more purchasing power. And, our economy is growing, with data from Statistics Canada revealing that real GDP at basic prices grew 0.6 per cent in January (7.4 per cent annualized), and preliminary estimates pointing to 0.4 per cent growth in February (4.9 per cent annualized), suggesting that growth in the first quarter of 2024 is on track for around 3.5 per cent.
Private sector forecasters expect that the year ahead should bring further progress. By the end of the year, they expect economic growth will pick up, interest rates will be lower, and inflation will decline to about 2 per cent. Both the International Monetary Fund (IMF) and the Organisation for Economic Co-operation and Development (OECD) project that Canada will see the strongest economic growth in the G7 in 2025.
At the same time, Canadians are facing challenges as some of the biggest factors for costs of living, such as groceries and housing, remain elevated. For too many Canadians, hard work isn't paying off. Our government won't let them get left behind. For younger Canadians who are concerned that they may not achieve the same standard of living as previous generations, we are helping them reach their full potential. Millennials are now the largest Canadian generation, having surpassed baby boomers in July 2023. Millennials' success in the workforce is Canada's success. We will ensure they succeed by boosting innovation, increasing productivity, in turn, raising wages and creating more good jobs—ensuring that Canada's economy reaches its full potential.
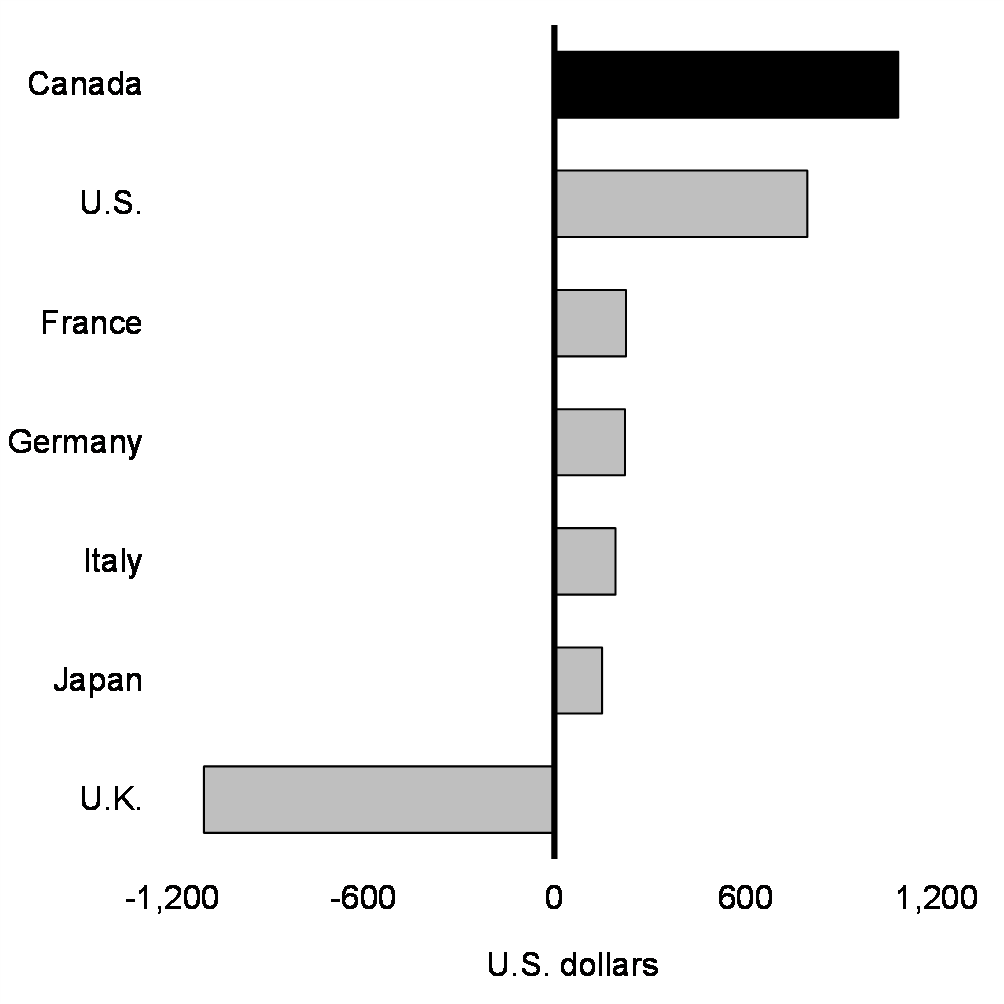
Ongoing investments—including in the Canada Child Benefit, Canada-wide affordable child care, housing construction, and enhanced benefits and pensions for seniors—are making life more affordable for Canadians and improving access to housing. Investments in economic growth and competitiveness are already showing results—Canada received the highest per capita foreign direct investment in the G7 in the first three quarters of 2023 (Chart 2).
Growth in Employment Since 2020, G7 Economies
Per Capita FDI Inflows, 2023Q1 to 2023Q3, G7 Economies
Heightened risks surrounding the global economy call for careful economic and fiscal management. Inflation remains elevated in many areas of the world and there is uncertainty surrounding how fast interest rates can be brought down. Global conflicts, including Russia's full-scale invasion of Ukraine and continued attacks by insurgents on shipping routes in the Red Sea, pose a risk to commodity prices and global supply chains.
The federal government is supporting Canadians while at the same time maintaining the lowest net debt- and deficit-to-GDP ratios of all G7 countries and preserving Canada's long-term fiscal sustainability.
The government is focused on expanding the capacity of the Canadian economy to create new opportunities today and for the next generation. The government is helping to create good jobs, raising the incomes of Canadians, and growing the middle class. The government is focused on accelerating productivity growth and the uptake of clean technologies as well as artificial intelligence (AI), ensuring Canada is a competitive place to do business, and unlocking pathways to success for younger generations. These are the next steps in building an economy that works for everyone—for today and for tomorrow.
1. Recent Economic Developments
Canada's Economy is Outperforming Expectations
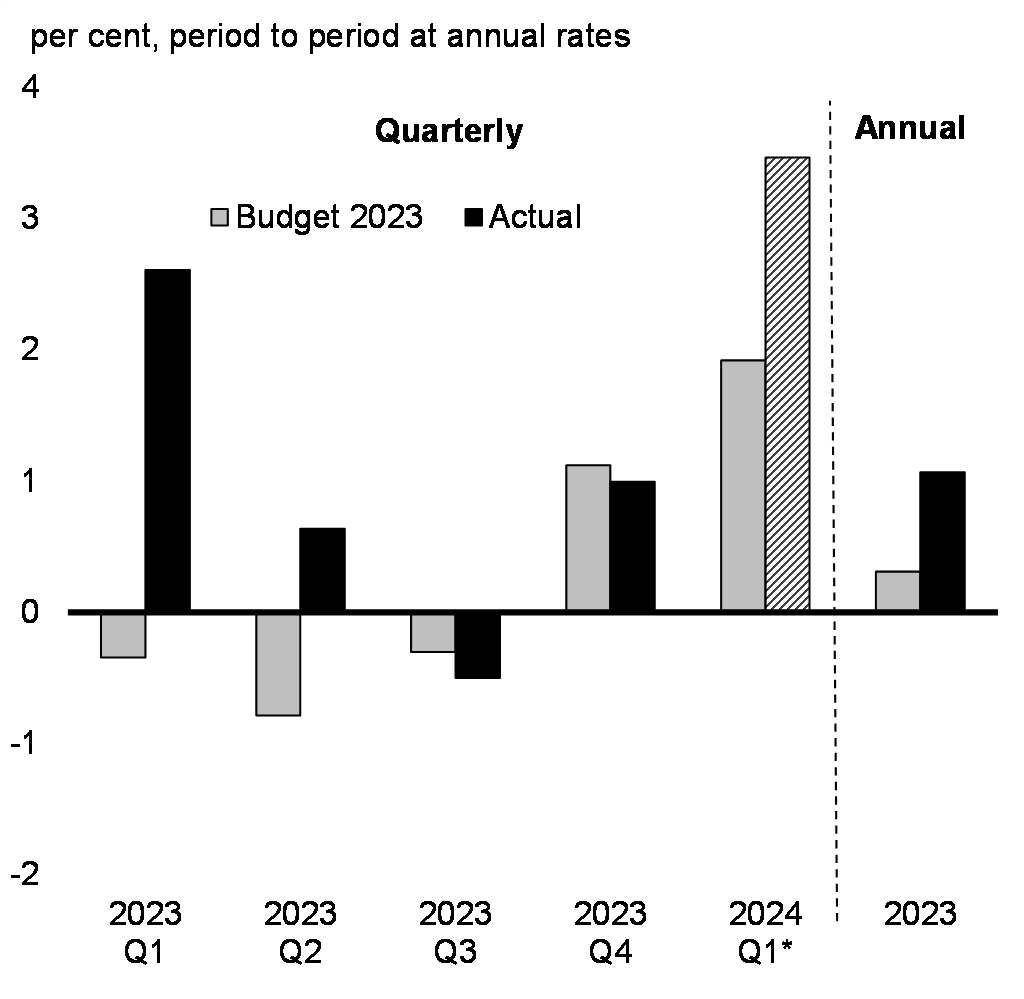
The Canadian economy is doing better than expected. In the face of rapid and substantial increases in interest rates to tame inflation, growth has slowed but outperformed expectations in 2023. Canada avoided the recession expected by many forecasters (Chart 3), with real GDP rising by 1.1 per cent in 2023, over three times higher than what was forecasted in Budget 2023 (0.3 per cent).
Canada's economy is growing. Despite some temporary factors such as the Quebec public sector strikes late in 2023, real GDP rose by 1 per cent on an annualized basis in the fourth quarter, driven by strong global demand for Canadian exports, as well as resilient demand from households for goods and services. Economic indicators are also encouraging so far in 2024. With the economy benefiting from a boost from the unwinding of temporary factors, this translated into strong real GDP gains in January (7.4 per cent annualized) and preliminary February (4.9 per cent annualized). This suggests that growth in the first quarter of 2024 is on track for around 3.5 per cent annualized. In recent months, household and small business sentiment has also been more positive.
Canada's strong economic fundamentals have helped the economy weather the impacts of higher interest rates. These strong fundamentals include solid labour markets driving ongoing gains in workers' income, as well as solid household and business balance sheets.
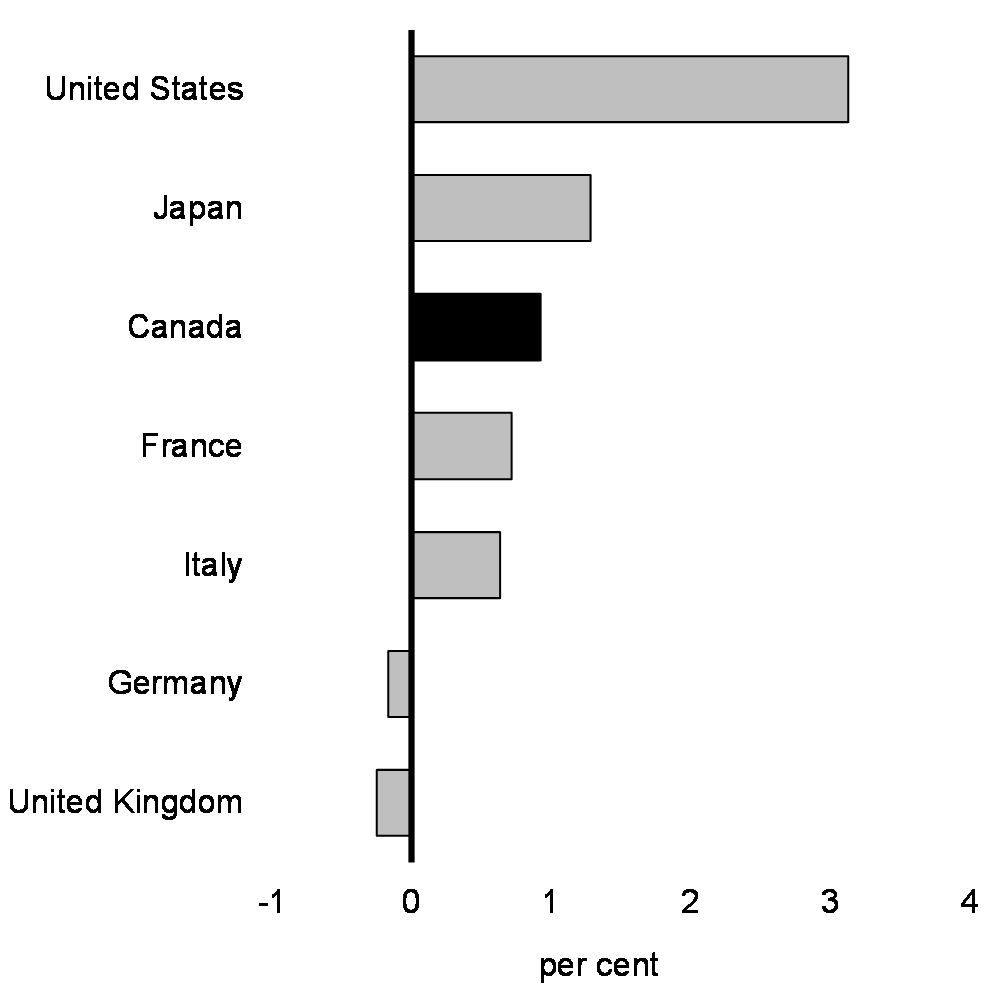
The surprising strength of the U.S. economy has also been a factor supporting Canada's better-than-expected performance (Chart 4). Growth in the U.S. has far outpaced expectations, driving solid external demand for Canadian goods and services, as well as foreign direct investment in Canada, which provided a sizeable boost to the Canadian economy throughout the past year.
Real GDP Growth Relative to Budget 2023 Forecast
Real GDP Growth From 2022Q4 to 2023Q4, G7 Economies
Substantial Progress Bringing Inflation Back to Target
Inflation emerged as a major global economic challenge, which persisted as the global economy recovered from the pandemic. This reflected numerous global factors, including pandemic-related disruptions, supply chain congestion, and rebounding global demand for goods, as well as surging commodity prices following Russia's illegal full-scale invasion of Ukraine. Since central banks around the world swiftly increased interest rates, inflation in Canada has come down from its June 2022 peak of 8.1 per cent to 2.8 per cent in February 2024.
In response to rising inflation, the Bank of Canada rapidly raised its benchmark interest rate by 4.75 percentage points to 5 per cent, as of July 2023—where it remains today. Falling energy prices and an easing of global supply-chain challenges have also been key drivers of the substantial decline in inflation seen since the second half of 2022.
Today, inflation has been within the Bank of Canada's target range of 1 to 3 per cent for the past two months. This is significant progress in bringing down inflation for Canadians. Progress on inflation remains uneven, especially as it relates to shelter price inflation, owing significantly to the rise in mortgage interest costs (Chart 5). Private sector forecasters expect inflation to remain around 3 per cent through the first half of 2024 and then to gradually decline to close to 2 per cent by the end of the year (Chart 6).
Despite recent improvements in inflation, some of the key household costs for Canadians, such as groceries and housing, remain elevated. Addressing these challenges for the long-term requires targeted policies to solve the underlying structural issues that are behind the high cost of essentials for Canadians. This is a key focus of Budget 2024.
Inflation for groceries has fallen from a peak of 11.4 per cent in January 2023 to 2.4 per cent in February 2024. This marked the first time grocery prices rose more slowly than headline inflation since the fall of 2021. However, grocery prices are still up 19 per cent overall since October 2021. To help Canadians with the cost of groceries, the government will deliver new targeted relief to expand school food programming across the country. The government also continues its work to strengthen competition in the grocery sector to provide more choices to Canadians and help stabilize prices. We have done this by reforming competition law and empowering the Competition Bureau, which is responsible for enforcing competition law to crack down on unfair practices that drive up prices.
The cost of housing is similarly elevated. Rent inflation averaged 6.4 per cent in 2023 and, at 8.2 per cent in February, it remains too high for Canadians (Chart 7). Mortgage interest costs have also risen sharply. Many Canadians who need to renew their mortgage this year or next will face substantial increases in their average monthly payment.
Canada has a longstanding housing shortage and building the homes needed to restore housing affordability will require a great national effort—and it is an effort that the federal government is leading.
Inflation Excluding Mortgage Cost

Consumer Price Inflation Outlook

Today, for too many Canadians—whether in big cities or small towns—the dream of homeownership feels out of reach, and higher rent is making it difficult to find an affordable place to call home.
Canada's affordability pressures are rooted in a longstanding challenge of insufficient new housing supply to meet growing demand. For decades, the construction of new homes has been constrained by entrenched structural barriers, including zoning restrictions, lengthy permitting processes, and skilled labour shortages. The result is that vacancy rates have fallen, driving up house prices and rents. More recently, a rapid increase in population has boosted housing demand and put additional strains on Canada's ability to properly welcome these newcomers.
Rental market pressures, in particular, have intensified over the past year with strong underlying demand as homeownership unaffordability kept households in the rental market for longer. Nationally, the cost of rent is up 8.2 per cent compared to a year ago, rising at its fastest pace since the early 1980s (Chart 7). Pressures are broad-based across the country and reflect exceptionally tight rental market conditions, with the rental vacancy rate dropping to just 1.5 per cent in 2023, its lowest level since at least 1988.
Restoring housing affordability for Canadians requires a substantial and sustained increase in new housing supply. The federal government is increasing investment, attracting and retaining construction workers, and cutting red tape to jumpstart housing construction across the country. These investments are having an impact, notably in the rental market, with construction of purpose-built rental housing units accelerating well above historical norms (Chart 8).
The government is also announcing additional measures in Budget 2024 to reduce barriers to new construction for homebuilders, build affordable housing and provide shelter to those without homes, and make it more affordable to rent and own a home.
Year-Over-Year CPI Rent Inflation

Housing Starts of Purpose-Built Rentals

The Labour Market is Delivering Higher Wages
Nothing makes more of a difference for the personal well-being and prosperity of Canadians than having a good job. Even as the economy has slowed and interest rates have risen, the labour market has remained solid. The unemployment rate, at 6.1 per cent, is low by historical standards (Chart 9). While hiring has slowed and job vacancies have declined in recent months, this has occurred without significant layoffs. Strong population growth and historically high working-age participation—particularly among women—have helped businesses fill a record-high level of job vacancies. Supported by the new Canada-wide system of early learning and child care, more women are participating in the labour force than ever before.
A strong labour market also matters for affordability. Wage growth has outpaced inflation for the past 13 months. On average, real wages—wages after accounting for inflation—are now higher than they were just prior to the pandemic, a positive sign that the purchasing power of Canadians has strengthened despite global economic hurdles. Overall, real average weekly earnings have risen by 4.6 per cent since 2019 (Chart 10). Consequently, over the course of a year, a worker earning the average weekly wage (before taxes) of $1,270 today can afford the same basket of goods and services as in 2019 with an additional $2,900 left over at the end of the year to save or spend. Moreover, household average wealth after inflation has increased by 8.9 per cent between 2019 and 2023. Importantly, these increases have been broad-based across income groups.
Looking forward, we have an urgent need to increase productivity to grow the Canadian economy. With real average weekly earnings now above their 2009-2019 trend, further improvements in living standards will depend on expanding the productive capacity of the Canadian economy. Investing in productivity and growth is a focus of Budget 2024.
Unemployment Rate

Real Weekly Wages

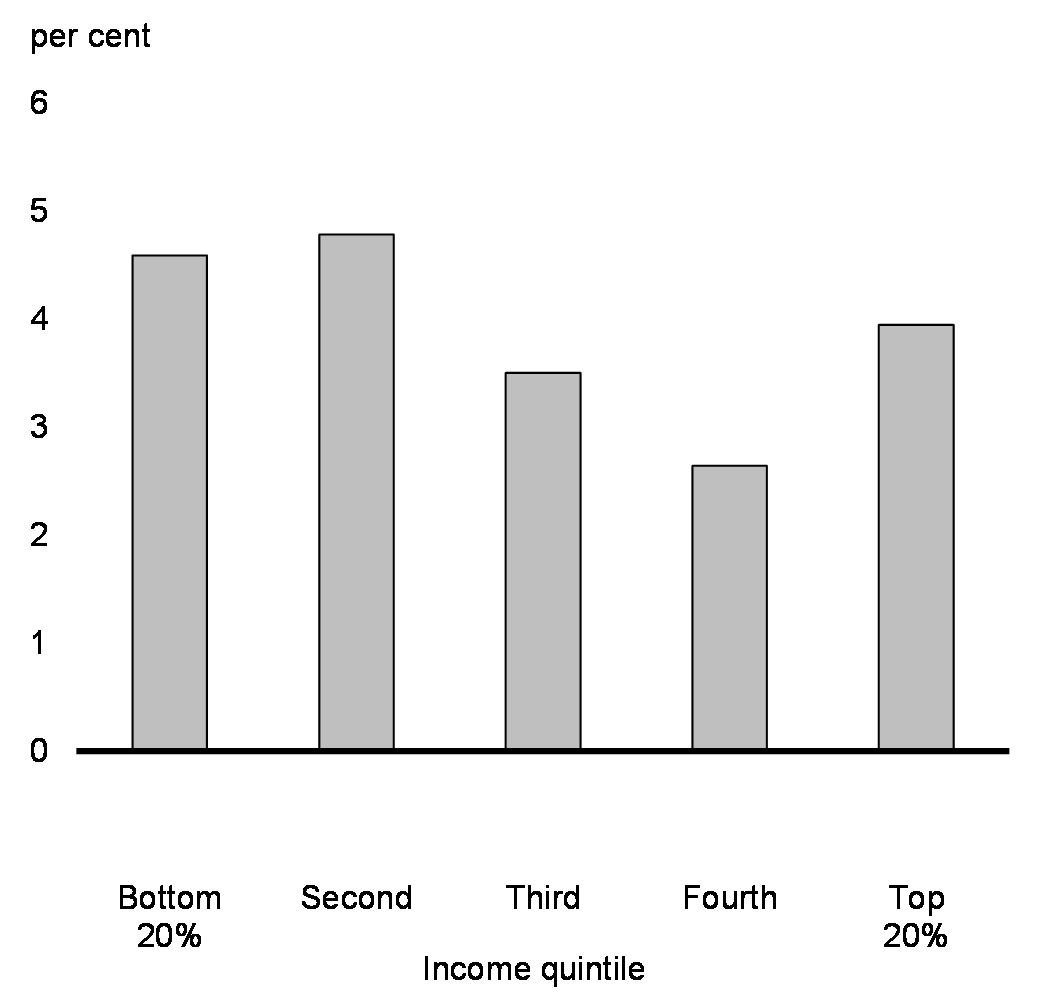
Canadian households are earning more in inflation-adjusted terms than just before the pandemic, as strong labour market conditions have driven gains in employment income. Real average weekly earnings are up across all income groups since the end of 2019, with especially large gains of over 4.6 per cent for the lowest income groups (Chart 11).
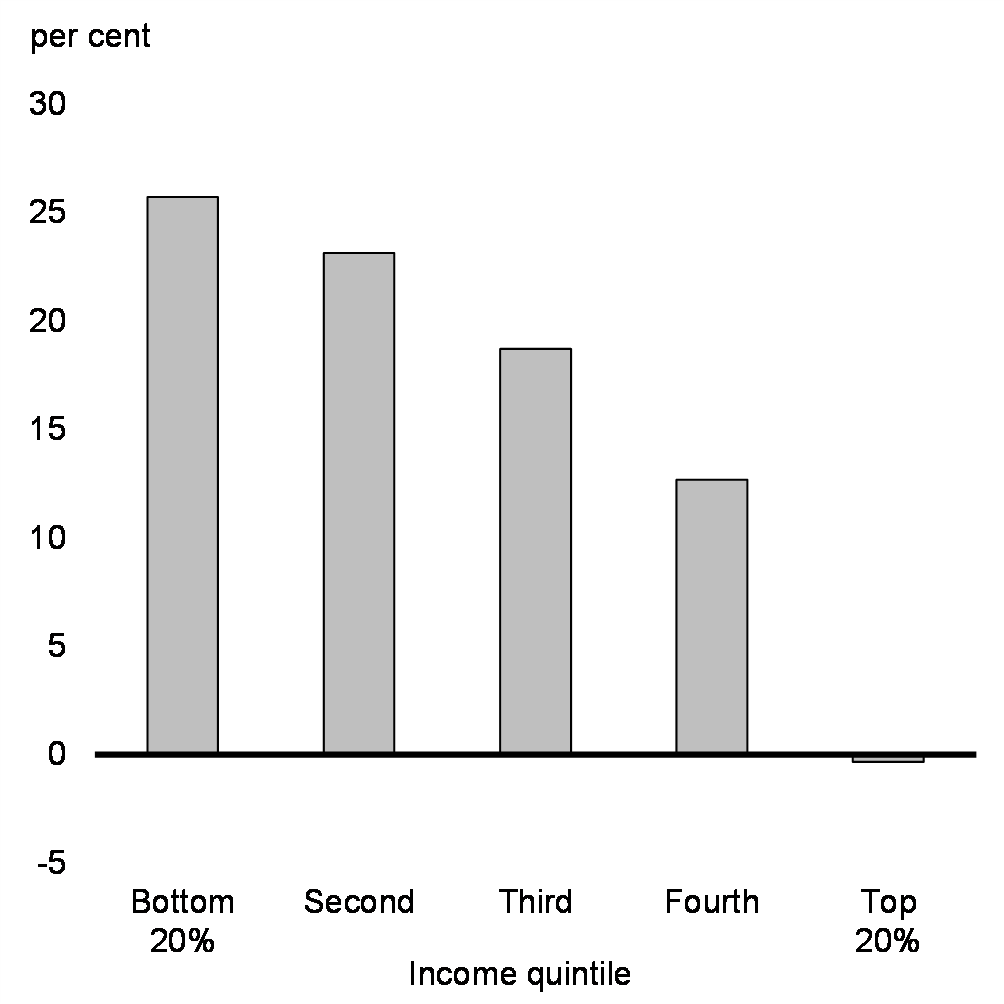
Higher incomes have helped Canadians save more. Combined with rising asset prices, this has resulted in substantial gains in the real wealth of households (Chart 12). As with earnings, wealth gains have been broad-based across the income distribution, with the lowest income group seeing the fastest growth (and this was felt across all age groups). These gains in inflation-adjusted earnings and wealth show that Canada's strong economic recovery has disproportionately benefitted Canadians in the lowest income quintiles, who have increased their share of Canada's wealth.
Increase in Average Weekly Earnings Adjusted for Inflation Since 2019Q4, by Income Quintile
Increase in Household Wealth Adjusted for Inflation Since 2019Q4, by Income Quintile
Unlocking Canada's Full Economic Potential
Canada has struggled with productivity growth—how much more income we are able to generate with each hour worked. This has led to a longstanding productivity gap, notably with the United States. Expanding the productive capacity of the Canadian economy and overcoming Canada's productivity challenges are essential. Enhancing productivity growth is pivotal for reinforcing the economy's strength, resilience, and competitiveness and for elevating Canadians' living standards. Key to unlocking Canada's full economic potential is building confidence for businesses to make the investments needed to improve productivity and keep pace with rapidly developing markets, and the needs of an economy in transition to net-zero.
The government has made significant investments to nurture an environment in which businesses have the confidence to invest. These policies include investments in health care, early learning and child care, better integration of newcomers, boosting housing supply, and fostering historic investments for the net-zero transition. These investments ensure people are healthy and able to contribute to their full potential in the labour force. And there are already signs that these policies have started to pay off.
Affordable child care has helped enable Canada's labour force participation rate for women in their prime working years to reach a record high of 85.7 per cent in September 2023, compared to just 77.4 per cent in the United States.
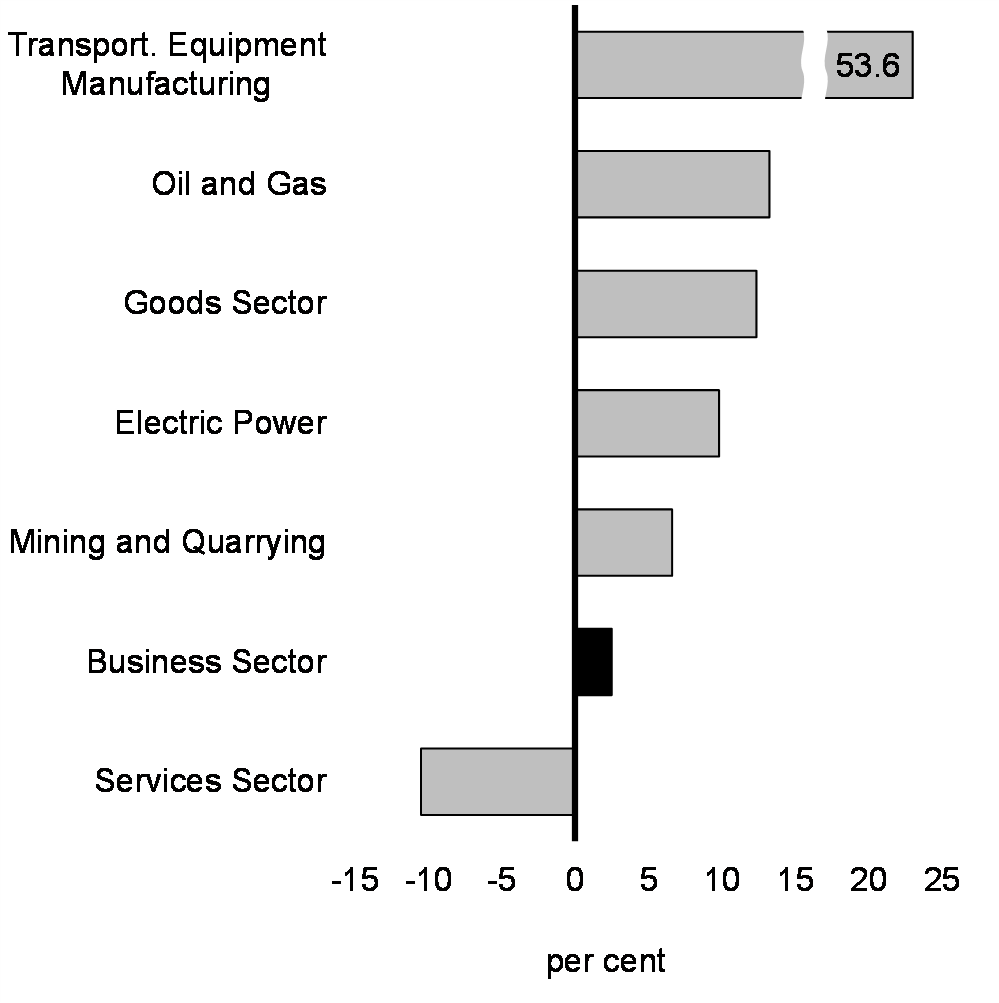
Net-zero investments have contributed to Canada being recognized by BloombergNEF as having the strongest electric vehicle supply chain potential in the world—leapfrogging the previous frontrunner, China, and the United States. Canada has also been recognized for its world-class reserves of critical minerals, ranking first in mining potential as determined by global companies in the sector (Chart 13). Building on this advantage, businesses in industries critical for the net-zero transition are already making significant investments in Canada, a trend that is expected to continue over the coming years (Chart 14). Canada's oil and gas sector is also expected to make investments to improve its competitiveness and take advantage of the Trans Mountain Expansion Project anticipated to come online in May. The additional export transportation capacity provided by the twinning of the existing pipeline will make it easier for the sector to get products to world markets, providing better pricing for Canadian crude oil.
Best Practices Mineral Potential Index

Growth in Real Capital Expenditures Intentions in 2024 From 2022, Selected Industries
Canada is among the best placed economies to become a global hub of electric vehicle and battery manufacturing, reflecting our abundance of critical metals, expertise in automotive supply chains, and close integration with the U.S. economy, where demand is expected to continue growing. These strengths have led many multinational firms to announce significant battery manufacturing plant investments in Canada.
To seize the investment opportunities of the global clean economy, the government is delivering, on a priority basis, six major economic investment tax credits, which represent $93 billion in federal incentives. These will provide businesses the certainty they need to invest in Canada across a range of technologies to support the transition to net-zero: Carbon Capture, Utilization, and Storage; Clean Technology Adoption; Clean Hydrogen; Clean Technology Manufacturing; Clean Electricity; and, new in Budget 2024, EV Supply Chains. As the government's cornerstone incentives, the major economic investment tax credits will attract private investment, grow Canada's economy, and create high-paying jobs. In anticipation, new major projects have already launched across the country.
Canada's strong tradition of macroeconomic stability is an important foundation for economic growth and investment. Knowing that the federal government's finances are sustainable, even as aging populations put pressure on government budgets in Canada and around the world, is an important source of certainty for both Canadian and foreign investors. Sustainable federal finances also support the credit ratings of private businesses and other orders of governments.
Although Canada has many economic advantages, including a highly educated workforce, broad trade access to global markets, and democratic stability, we must maximize our potential. Canada must ensure a business- and innovation-friendly environment that facilitates decisions to invest and grow. This requires a sustained focus on enabling businesses to seize new opportunities and leverage Canada's world-class research capabilities for further technological advancements. Additionally, it requires ensuring that businesses have the right incentives to invest in Canada's transition to net-zero—whether those investments come from within Canada or from foreign companies—so they can create good jobs for today and for tomorrow.
These policy actions, combined with the government's efforts to unlock pathways to the middle class for everyone, are fundamental to increasing living standards over the long-term.
The past two years have seen a strong, temporary rise in immigration, particularly increases in the temporary resident population. This has been a factor in the recent decline in GDP per capita. The government recently announced it will reduce the share of temporary residents in Canada to 5 per cent of the total population over the next three years. This will lead to approximately 600,000 fewer temporary residents compared to current levels, which will result in a significant easing in demand across the housing market.
Given newcomers typically earn less than the average Canadian upon arrival, a large one-time increase in the number of newcomers has weighed on average income and productivity in the short-term. This should not be misinterpreted to imply that those already in the country are becoming worse off. Over time, this composition effect will fade as newcomers integrate into the economy.
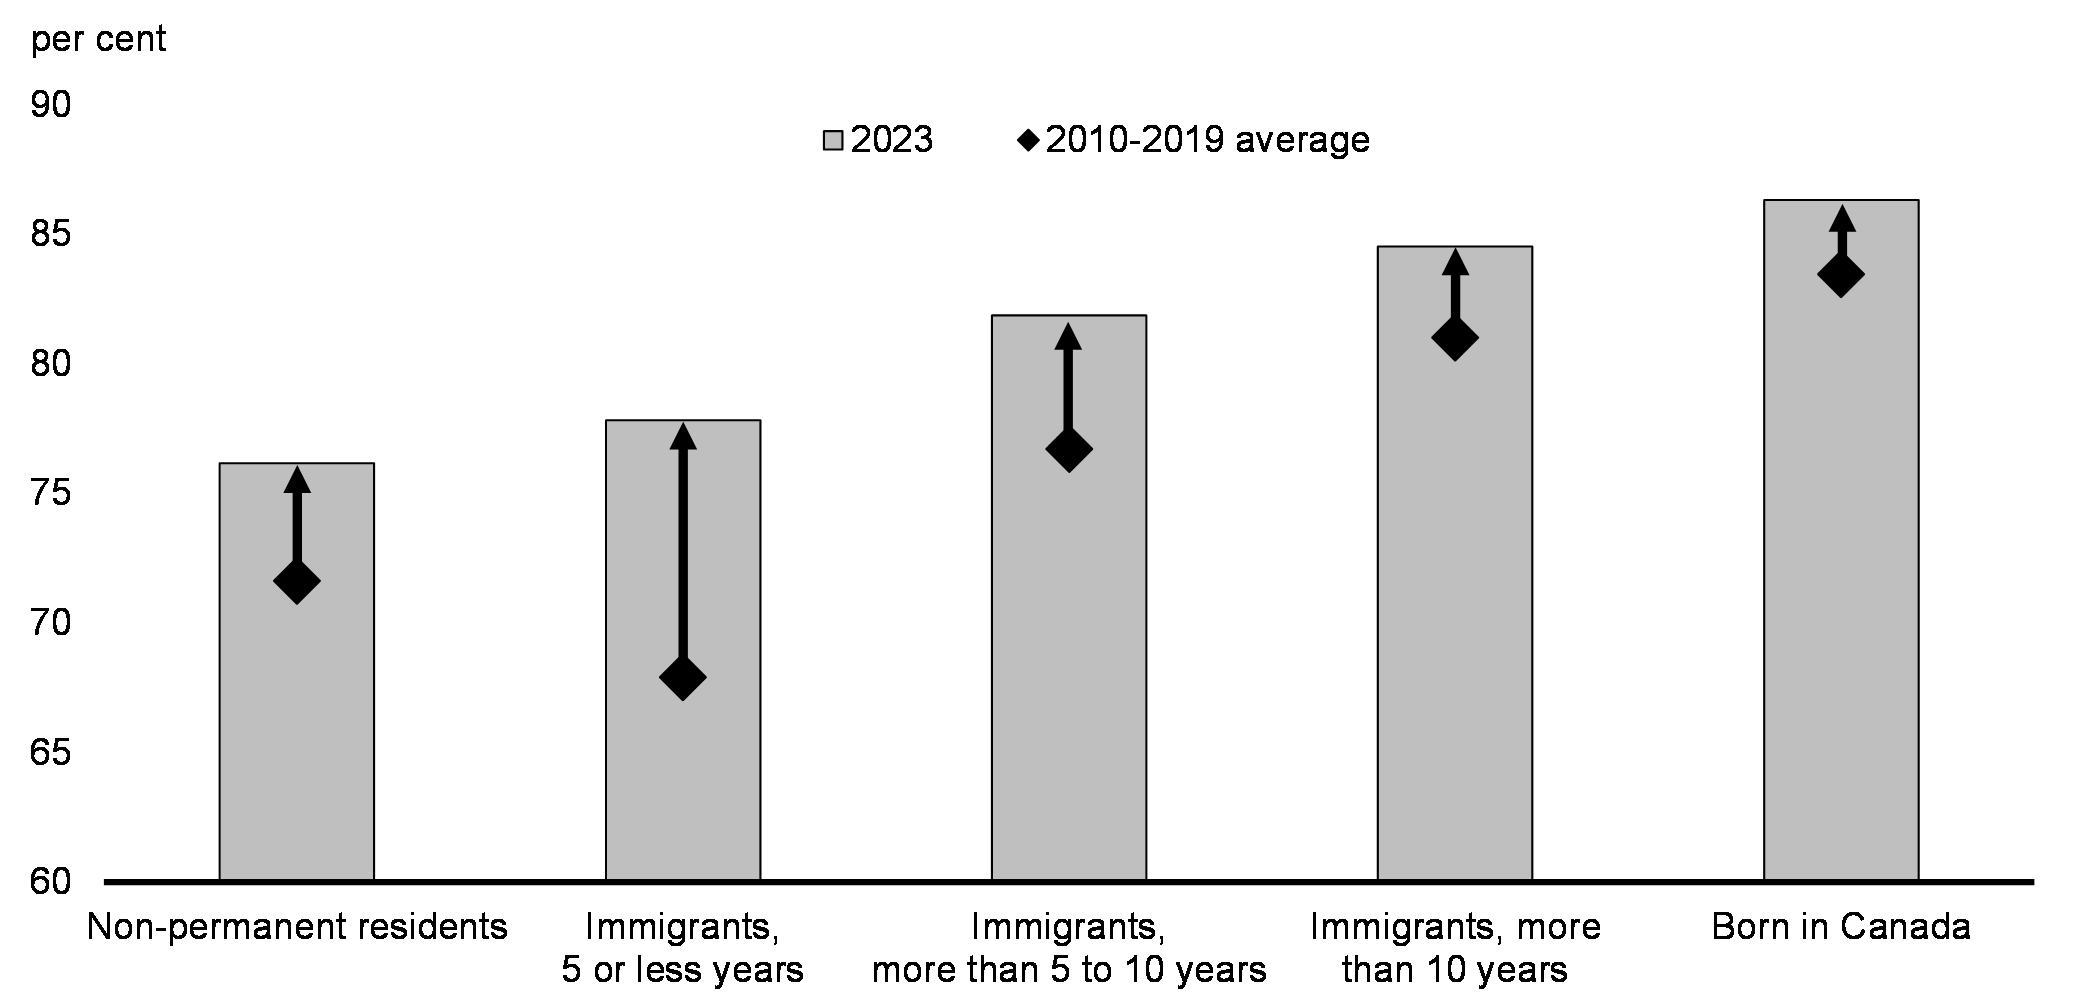
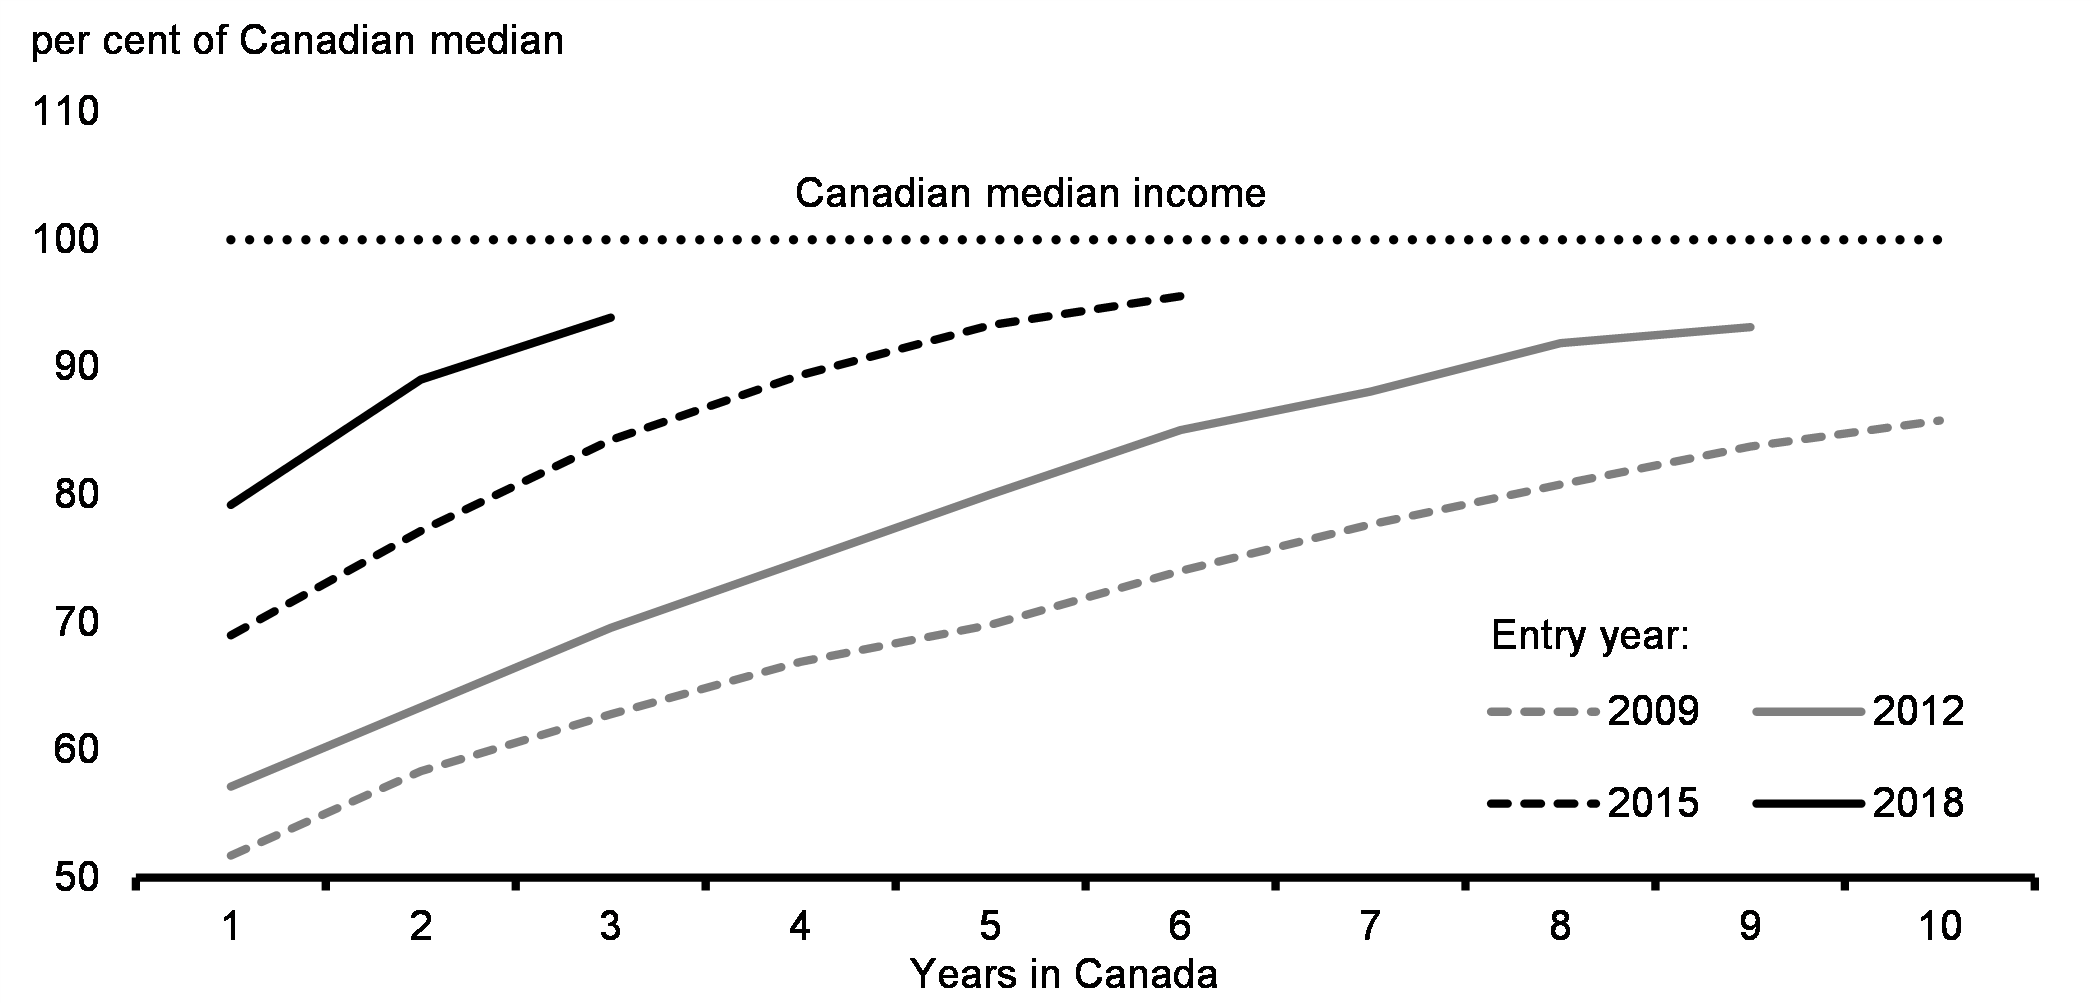
In recent years, newcomers to Canada have steadily improved their integration into the labour market, with each newcomer wave seeing smaller initial income gaps than those in the past. Looking specifically at the outcomes of economic immigrants over the most recent ten-year period, it took six years for them to reach the median Canadian income. By the end of the decade after their arrival, they surpassed the median Canadian income by close to ten per cent.
While the economy has been resilient, growth in Canada has softened in the face of elevated inflation and higher interest rates, just as it has across the globe. In 2015, the oil price shock caused a temporary decline in GDP per capita of 1 per cent, which was recovered two years later.
As a result, the government expects GDP per capita to recover along with the further integration of newcomers into the Canadian labour market and the normalization of the post-pandemic immigration surge over the next few years.
Newcomer settlement time, combined with the government's investments in economic growth, mean weakness in GDP per capita is largely temporary, not systemic. Budget 2024 is the next step in the government's economic plan to address structural challenges, particularly boosting productivity growth and investment, which will increase GDP per capita.
Employment Rate of Immigrants to Canada
Median Income of Immigration Cohorts to Canada
Budget 2024 builds on the government's ongoing efforts to accelerate productivity growth, unlock innovation, increase investment, and help businesses of all sizes to grow. Investments today will power the world of tomorrow, accelerate the transition to a net-zero economy, and increase incomes and productivity.
In 2017, Canada was the first country in the world to develop a national artificial intelligence (AI) strategy, and through additional complementary government programming has invested more than $2 billion to ensure Canada is a global AI leader for generations. The national AI strategy and investments in emerging and high impact technologies will help ensure Canada's strategic research capabilities are at the cutting edge—paving the way for strengthening Canada's productivity. This will help create the good jobs of tomorrow for Canadians and ensure that Canada is a place where young leaders with innovative ideas know that they can succeed.
In the face of fundamental economic changes including a realignment of global trade and a rapidly evolving digital economy, the need to strengthen Canada's productivity growth has never been greater.
The government is taking action to attract business investment, cut regulatory red tape, and attract investment in the net-zero economy. These efforts are underpinned by providing businesses with the certainty they need to invest in Canada. This will grow our productivity and our economy, while creating more good-paying jobs for Canadians.
Key growth and productivity boosting measures in Budget 2024 include:
Boosting research, innovation, and productivity
- $2.4 billion to support access to computing power and investment in Canada's compute infrastructure to ensure Canadian researchers and AI start-ups and scale-ups have the resources they need to grow in Canada. These investments would also support AI adoption, safety, and skills training.
- $3.5 billion in strategic research infrastructure and federal research support to ensure Canada's researchers can reach their potential, strengthen Canada's fundamental research capacity, and develop a new generation of talent.
- Increasing financial support for graduate student and post-doctoral researchers, as well as developing ways to help researchers obtain jobs with businesses that need specialized talent to ensure Canada's top science talents play a critical role in shaping Canada's research and industrial capacity for years to come.
- Reviewing ways to modernize the Scientific Research & Experimental Development tax incentives and further capitalizing the program with $600 million over four years, and $150 million per year ongoing, to boost research and innovation.
Growing a clean economy for the net-zero future
- Delivering key components of the government's $160 billion investment in clean growth measures announced since 2015. These investments will help bring down the costs of technologies that will enable the transition to net-zero emissions and ensure Canada remains competitive through that transition.
- Delivering, by the end of this year, major economic investment tax credits to attract private investment, create more jobs, and drive Canada's economy towards net-zero by 2050. Budget 2024 also announces expanded eligibility for the Clean Technology Manufacturing investment tax credit, allowing more businesses to benefit.
- A new Electric Vehicle (EV) Supply Chain investment tax credit to support the EV supply chain and secure the future of Canada's automotive industry.
- New investments to grow Canada's biofuels sector, which can be used to decarbonize heavy industry, and heavy transportation like marine, aviation, and rail.
- Extending for an additional year collaboration with our largest trading partner through the Canada-U.S. Energy Transformation Task Force, which is bolstering critical mineral and nuclear energy supply chain integration.
- A series of new actions to get major projects built faster by clarifying and reducing timelines for approvals.
Helping businesses scale-up
- $725 million to support growing businesses by allowing businesses to immediately write off the full cost of specified productivity-enhancing assets critical for certain businesses to succeed.
- The new Canadian Entrepreneurs' Incentive to provide a tax break for entrepreneurs, ensuring they benefit from the fruits of their hard work while facing lower tax burdens.
- Encouraging Canadian pension funds to invest in Canada, by launching a working group chaired by Stephen Poloz (former Governor of the Bank of Canada), and supported by the Deputy Prime Minister and Minister of Finance, to find more opportunities for Canada's largest pension funds to drive economic growth at home.
- Putting the capital of financial Crown corporations to work more efficiently and ensuring they better address market gaps by taking on more risk, including additional support for new and high-growth businesses, emerging sectors, and under-financed equity-deserving groups.
Cutting red tape to boost innovation and business growth
- Advancing work on regulatory "sandboxes" to help create temporary agile rules and approaches that allow businesses to reach their full potential, instead of holding them back.
- Addressing internal trade barriers, including through regulatory harmonization, in collaboration with provinces and territories, to cut the red tape holding back trade between provinces and territories, to ensure Canada can reach its full economic potential.
- Ensuring everyone in Canada can fully contribute by working with provinces and territories to reduce barriers for internationally-educated and certified professional and tradespeople, particularly in health care and construction sectors.
Inclusive growth with opportunities for everyone
- Renewed support for the Aboriginal Entrepreneurship Program.
- Up to $5 billion in loan guarantees for natural resource and energy projects to be made available to Indigenous communities to provide successful applicants access to affordable capital, creating economic opportunities and supporting their economic development priorities.
- Investing to create more opportunities for youth in their pursuit of entrepreneurial goals while renewing the support for innovation-driven growth across all regions in Canada.
Responsible macroeconomic management
- Attracting business investment by maintaining the lowest marginal effective tax rate (METR) in the G7, at an advantage of 5.2 percentage points compared to the United States, and at a level below the OECD average. Canada's manufacturing sector is particularly competitive at 7.5 per cent—an advantage of 14.3 percentage points over the United States.
- Adopting a fiscal strategy that complements rather than contradicts monetary policy as inflation continues its decline from its June 2022 peak of 8.1 per cent to 2.8 per cent in February 2024.
- Delivering on the commitment to refocus $15.8 billion over five years and $4.8 billion ongoing in government spending to the programs and services that matter most to Canadians.
- Maintaining declining debt- and deficit-to-GDP ratios to keep federal debt servicing charges as low as possible in a period of elevated interest rates.
2. Canadian Economic Outlook
Private Sector Economists Expect a Soft Landing
The average of private sector forecasts has been used as the basis for economic and fiscal planning in Canada since 1994, helping to ensure objectivity and transparency, and introducing an important element of independence into the government's economic and fiscal forecast.
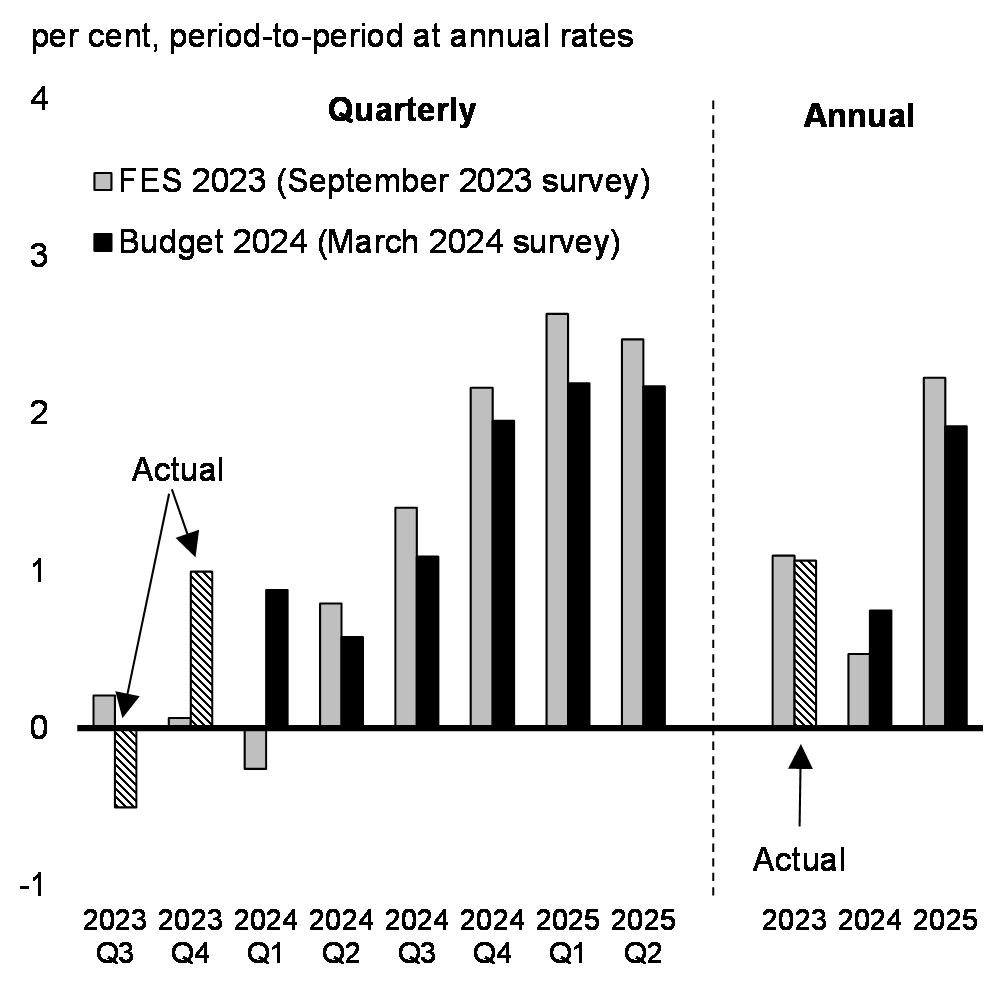
The Department of Finance Canada surveyed a group of private sector economists in March 2024. Overall, the private sector economists surveyed expect the economy to avoid a recession, seeing moderate below-potential growth of roughly 1 per cent on average over the year weighed down by the effects of past interest rate increases (Chart 17). Growth is then expected to strengthen slightly above 2 per cent in the first two quarters of 2025. Overall, private sector economists expect growth of 0.7 per cent in 2024 and 1.9 per cent in 2025, compared to, respectively, 0.5 per cent and 2.2 per cent in the 2023 Fall Economic Statement (restated for historical revisions).
As the Canadian economy moderates, the unemployment rate is expected to rise to a peak of 6.5 per cent in the fourth quarter of this year and average 6.3 per cent in 2024 (compared to, respectively, 6.5 per cent and 6.4 per cent in the 2023 Fall Economic Statement). The unemployment rate is expected to remain low by historical standards, and far below the peaks typically seen in recessions.
Private sector economists expect CPI inflation to ease to about 2 per cent by the end of 2024 and to average 2.5 per cent for the year as a whole, the same as projected in the 2023 Fall Economic Statement.
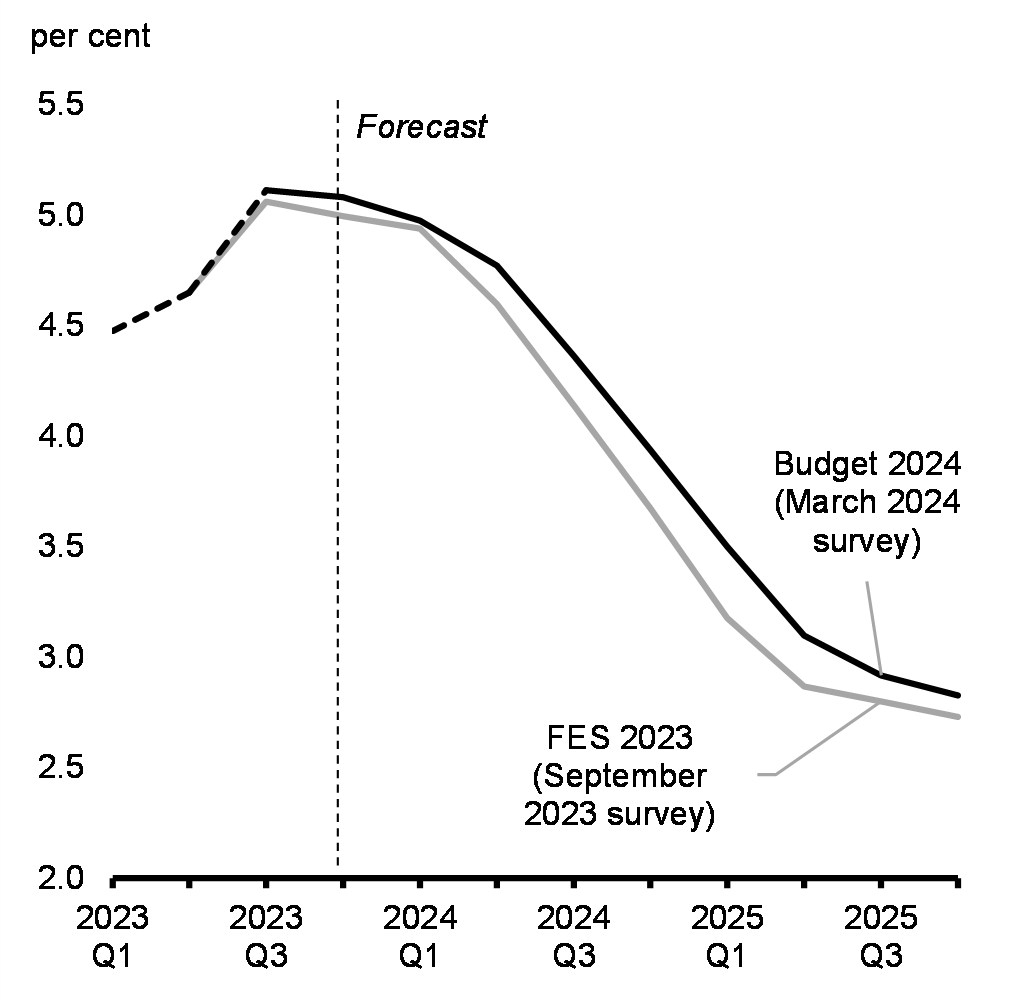
Short-term interest rates are expected to decline from an average of 4.8 per cent in 2023 to 4.5 per cent in 2024 and to 3.1 per cent in 2025, about 20 basis points higher in each year compared to the 2023 Fall Economic Statement (Chart 18). Short-term interest rates are then expected to settle at 2.7 per cent over the last three years of the forecast horizon. The outlook for long-term interest rates has been revised up by about 10 basis points on average per year compared to the 2023 Fall Economic Statement.
GDP inflation in the second half of last year was stronger than expected in the 2023 Fall Economic Statement. GDP inflation averaged 1.6 per cent for the year as a whole, compared to 1 per cent expected in the 2023 Fall Economic Statement. As well, private sector economists have revised up their outlook for 2024 to 3.0 per cent (compared to 2.0 per cent in the 2023 Fall Economic Statement), while 2025 has been revised down slightly to 1.9 per cent (from 2.0 per cent). In the outer years, GDP inflation is expected to be slightly lower by about 0.1 percentage points on average per year.
Reflecting higher-than-expected GDP inflation in the second half of last year, the level of nominal GDP in 2023 came in $18 billion higher than projected in the 2023 Fall Economic Statement. Furthermore, the nominal GDP level difference with the 2023 Fall Economic Statement is expected to increase to $56 billion in 2024 reflecting stronger near-term outlook for both real GDP growth and GDP inflation. However, because of lower GDP inflation in the outer years and slower expected real GDP growth in 2025 and 2026, the nominal GDP level difference with the 2023 Fall Economic Statement gradually declines over the last four years of the forecast horizon to average $39 billion per year over that period.
Real GDP Growth Projections
Short-Term Interest Rates Outlook
Economic Scenario Analysis
The March 2024 survey provides a reasonable basis for economic and fiscal planning. The economic outlook nevertheless remains clouded by a number of key uncertainties, which could impact the trajectory of inflation, interest rates, and economic growth.
Data on economic growth and inflation released so far this year remain broadly consistent with a soft landing. However, progress on inflation remains uneven as shelter price inflation has persisted. Long-term interest rates have declined after surging last year as risks around the growth and inflation outlook have eased, but there remains considerable uncertainty as to when central banks will begin to cut policy rates. At the same time, geopolitical tensions have increased owing to heightened uncertainty related to Russia's full-scale war in Ukraine, U.S.-China relations, and Red Sea supply chain disruptions. So far, the impacts have been contained, but new economic pressures related to these conflicts and geopolitical volatility impacting confidence and investment decisions remain a risk.
To facilitate prudent economic and fiscal planning, the Department of Finance Canada has developed scenarios that incorporate these uncertainties and consider faster or slower growth tracks.
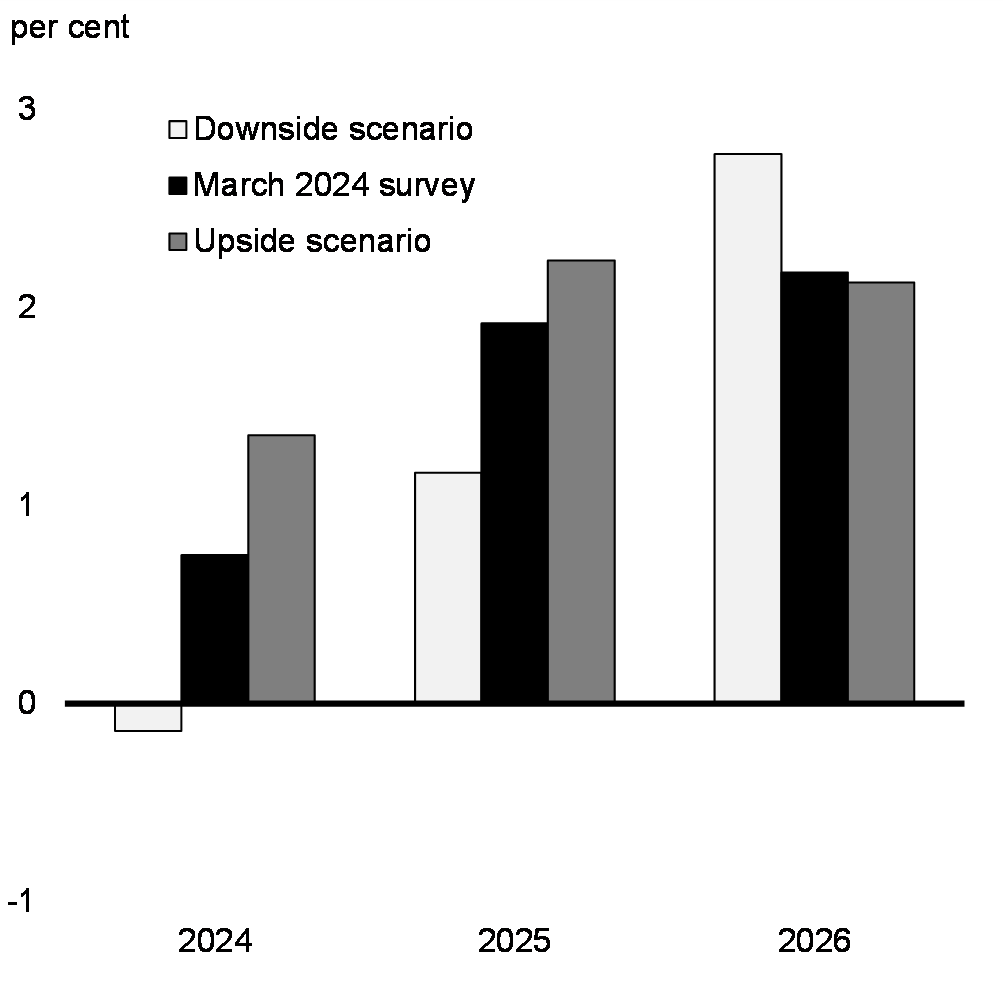
The downside scenario sees a shallow recession in Canada. Various headwinds such as structural imbalances in housing markets and spillovers from geopolitical tensions keep inflation and interest rates elevated for longer than expected, with adverse effects on confidence and consumer activity. At the same time, the U.S. also sees persistent inflation, higher interest rates, and subsequently slower growth. Along with a weaker economic recovery in China, this contributes to slower global growth. Taken together, these factors result in real GDP in Canada contracting by 0.1 per cent in 2024 before rebounding modestly in 2025, compared to a period of moderate growth expected in the survey (Chart 19). In addition, slower global growth leads to lower commodity prices. Overall, the level of nominal GDP in Canada is $34 billion below the survey, on average per year, in the downside scenario (Chart 20).
In contrast, the upside scenario sees moderately faster economic growth than in the survey. A more resilient U.S. economy—underpinned by strong balance sheets for households and firms and recent supply side improvements in productivity—benefits the Canadian economy through higher export demand and improved global commodity prices. Despite more economic resilience, inflation slows roughly as expected in the survey, both in Canada and globally, amid falling input costs. These developments result in economic growth picking up faster than expected in the second half of 2024. The improved global outlook, alongside extended crude oil production cuts by OPEC+, leave oil prices above the survey. Overall, the level of nominal GDP is $34 billion above the survey, on average per year, in the upside scenario.
Real GDP Growth
Nominal GDP Level

3. Fiscal Outlook
Canada's Responsible Economic Plan
Responsible fiscal stewardship has left Canada in an enviable fiscal position. Canada's net debt-to-GDP ratio is well below that of our G7 peers. Our deficits are modest and declining, particularly relative to the size of our economy. We are one of only two G7 countries rated AAA by at least two of the three major global ratings agencies. This has been achieved through the government's responsible economic plan that has enabled proactive investments to support Canadians and Canada's long-term prosperity, which will have a direct and lasting impact for future generations.
Budget 2024 is a responsible economic plan that makes generational investments by raising revenues from those with the greatest ability to pay and investing in economic growth and opportunity for every generation. Transformative investments in clean energy, in opportunities for workers, in innovation, and to improve housing affordability will support a business environment that gives investors confidence Canada's workforce is ready for more opportunities. This will enable our economy to attract more investment and to create more jobs, supporting reductions to Canada's net debt- and deficit-to-GDP ratios, which are already the lowest in the G7.
Budget 2024 supports fairness for every generation by sticking to the fiscal objectives laid out in the fall economic statement, setting both deficits and the federal debt burden on a downward track.
As a result of these actions, and incorporating the results of the March 2024 survey of private sector economists, the budgetary balance is expected to improve slightly from the $40.1 billion deficit projected for 2023-24 in Budget 2023, at $40 billion or -1.4 per cent of GDP. This improves to a $20.0 billion deficit in 2028-29, or about -0.6 per cent of GDP (Table 1).
| Projection | ||||||
|---|---|---|---|---|---|---|
| 2023- 2024 |
2024- 2025 |
2025- 2026 |
2026- 2027 |
2027- 2028 |
2028- 2029 |
|
| Budgetary balance - 2023 Fall Economic Statement (FES 2023) |
-40.0 | -38.4 | -38.3 | -27.1 | -23.8 | -18.4 |
| Economic and fiscal developments since FES 2023 |
3.4 | 3.9 | 6.9 | 6.5 | 4.1 | 4.3 |
| Budgetary balance before policy actions and measures |
-36.7 | -34.5 | -31.3 | -20.6 | -19.7 | -14.1 |
| Policy actions since FES 2023 | -3.3 | -0.3 | 0.3 | 0.3 | -0.9 | -0.7 |
| Budget 2024 measures (by chapter) | ||||||
| 1. More Affordable Homes | 0.0 | -1.0 | -1.6 | -2.0 | -2.1 | -1.9 |
| 2. Lifting Up Every Generation | 0.0 | -1.4 | -2.0 | -2.0 | -2.3 | -2.7 |
| 3. Lowering Everyday Costs | 0.0 | -0.1 | 0.0 | 0.0 | 0.0 | 0.0 |
| 4. Economic Growth for Every Generation | 0.0 | -2.9 | -0.5 | -1.7 | -0.8 | -1.7 |
| 5. Safer, Healthier Communities | 0.0 | -2.4 | -1.7 | -0.9 | -0.7 | -0.7 |
| 6. A Fair Future for Indigenous Peoples | -0.1 | -3.0 | -2.7 | -1.6 | -1.0 | -0.8 |
| 7. Protecting Canadians and Defending Democracy | 0.0 | -0.8 | -2.4 | -2.5 | -2.7 | -2.3 |
| 8. Tax Fairness for Every Generation | 0.0 | 6.5 | 3.0 | 0.3 | 3.5 | 4.9 |
| Total – Policy actions since FES 2023 and Budget 2024 measures | -3.3 | -5.3 | -7.5 | -10.1 | -7.1 | -5.9 |
| Budgetary balance | -40.0 | -39.8 | -38.9 | -30.8 | -26.8 | -20.0 |
| Budgetary balance (per cent of GDP) | -1.4 | -1.3 | -1.2 | -0.9 | -0.8 | -0.6 |
| Federal debt (per cent of GDP) | 42.1 | 41.9 | 41.5 | 40.8 | 40.0 | 39.0 |
| Budgetary balance - upside scenario | -38.4 | -33.5 | -31.2 | -23.2 | -20.2 | -13.2 |
| Budgetary balance (per cent of GDP) | -1.3 | -1.1 | -1.0 | -0.7 | -0.6 | -0.4 |
| Federal debt (per cent of GDP) | 42.0 | 41.2 | 40.5 | 39.6 | 38.7 | 37.6 |
| Budgetary balance - downside scenario | -40.4 | -48.0 | -52.1 | -39.2 | -32.3 | -24.1 |
| Budgetary balance (per cent of GDP) | -1.4 | -1.6 | -1.7 | -1.2 | -1.0 | -0.7 |
| Federal debt (per cent of GDP) | 42.1 | 42.7 | 43.2 | 42.2 | 41.2 | 40.2 |
| Budgetary balance - FES 2023 | -40.0 | -38.4 | -38.3 | -27.1 | -23.8 | -18.4 |
| Budgetary balance (per cent of GDP) | -1.4 | -1.3 | -1.2 | -0.8 | -0.7 | -0.5 |
| Federal debt (per cent of GDP) | 42.4 | 42.7 | 42.2 | 41.2 | 40.2 | 39.1 |
|
Note: Totals may not add due to rounding. |
||||||
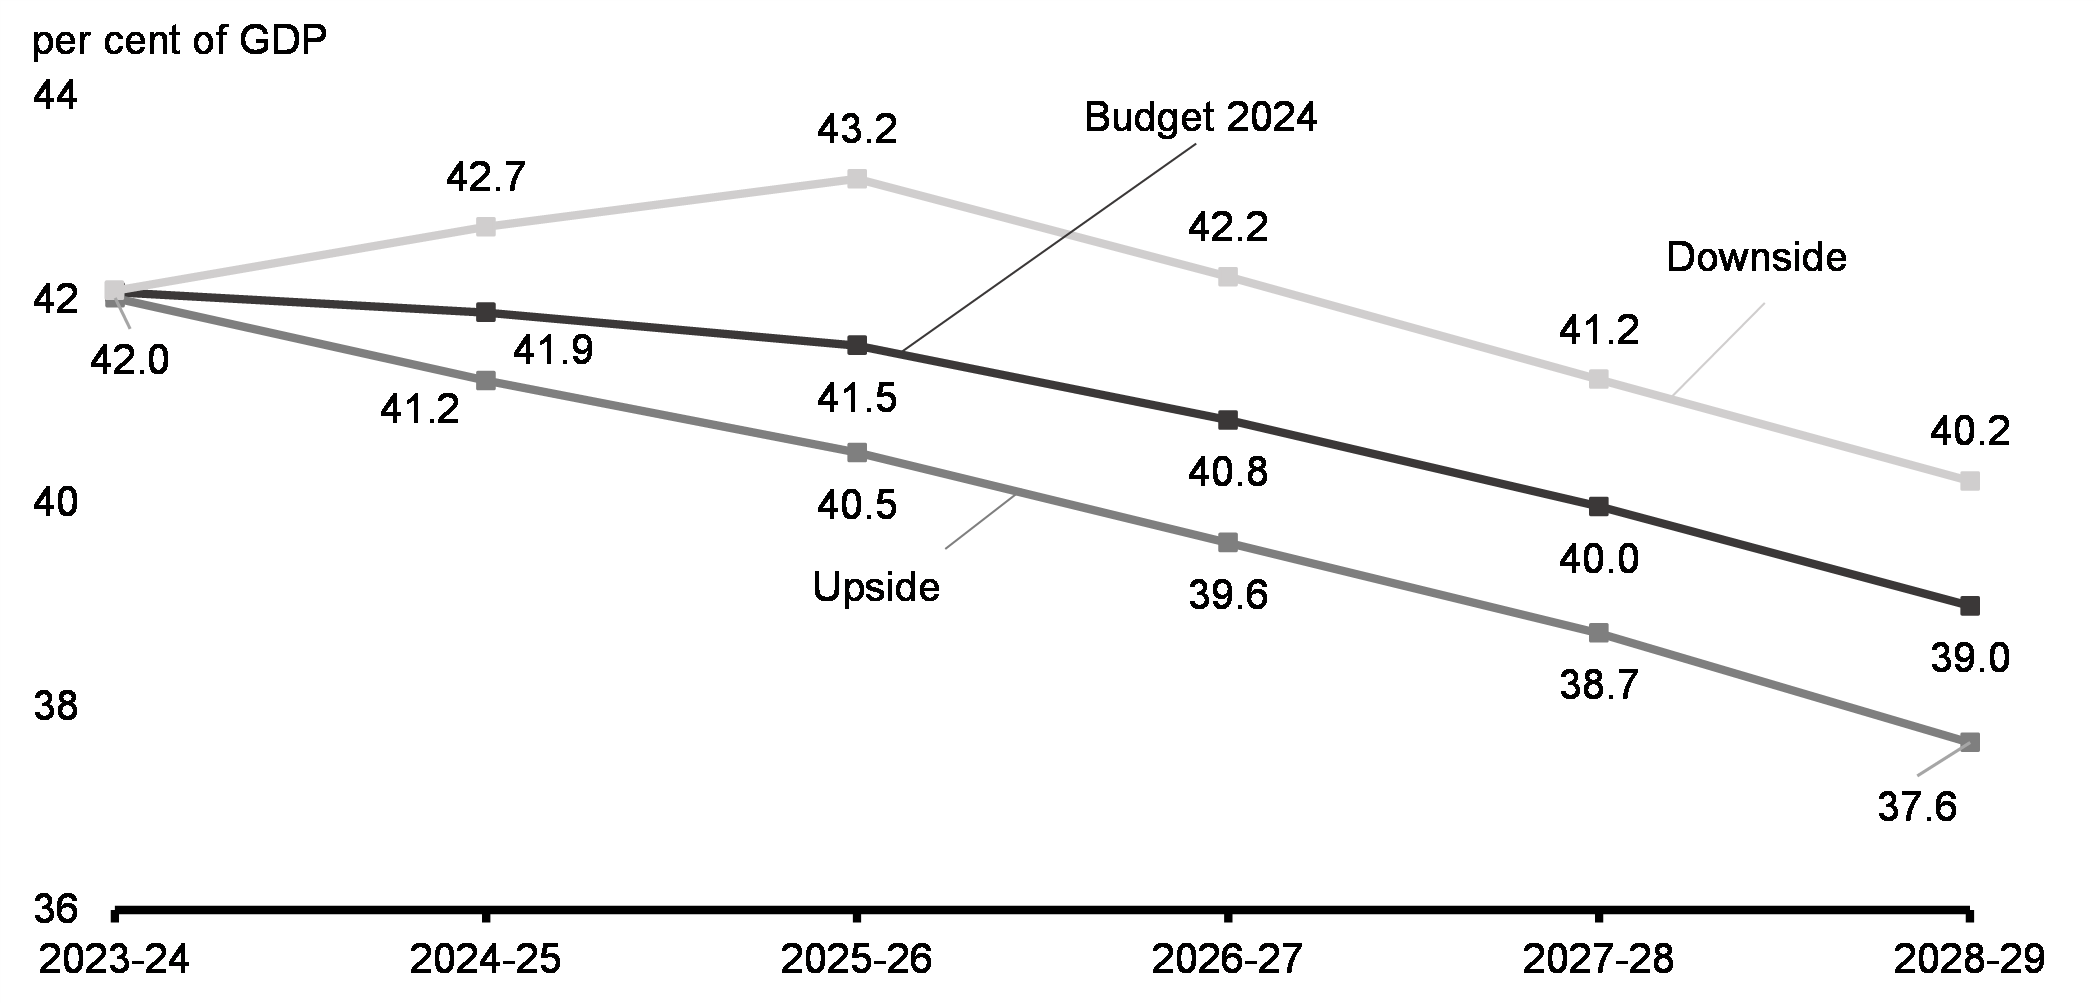
In the upside scenario, the budgetary balance would improve by an average of approximately $6.1 billion per year, and the federal debt-to-GDP ratio would fall to 41.2 per cent in 2024-25 from 42.0 per cent in 2023-24 and be 1.4 percentage points lower than the Budget 2024 outlook in 2028-29 (Chart 21).
In the downside scenario, the budgetary balance would deteriorate by an average of approximately $6.6 billion per year and add 1.2 percentage points to the federal debt-to-GDP ratio by 2028-29. That said, even under the downside scenario, the deficit would remain below 1 per cent of GDP by the end of the forecast horizon, and the federal debt-to-GDP ratio would still be lower in 2028-29 than it is today.
Details of the government's fiscal outlook and the fiscal impact of the scenarios can be found in Annex 1.
Federal Debt-to-GDP Ratio Under Economic Scenarios
Maintaining Canada's Responsible Fiscal Anchor
The government has taken action to ensure necessary new investments are paid for by those with the greatest means. This has enabled the government to maintain its commitment to its fiscal objectives and achieve its fiscal anchor to reduce the federal debt-to-GDP ratio over the medium-term. This metric is key not only for fiscal sustainability, but also to preserve Canada's AAA credit rating, which helps maintain investors' confidence and keeps Canada's borrowing costs as low as possible. Fiscal prudence supports a macroeconomic environment in which the Bank of Canada is able to bring down interest rates as soon as possible.
The government's fiscal objectives, as outlined in the 2023 Fall Economic Statement, guided decision making for Budget 2024:
-
Maintaining the 2023-24 deficit at or below the Budget 2023 projection of $40.1 billion.
-
Lowering the debt-to-GDP ratio in 2024-25, relative to the 2023 Fall Economic Statement, and keeping it on a declining track thereafter.
-
Maintaining a declining deficit-to-GDP ratio in 2024-25 and keeping deficits below 1 per cent in 2026-27 and future years.
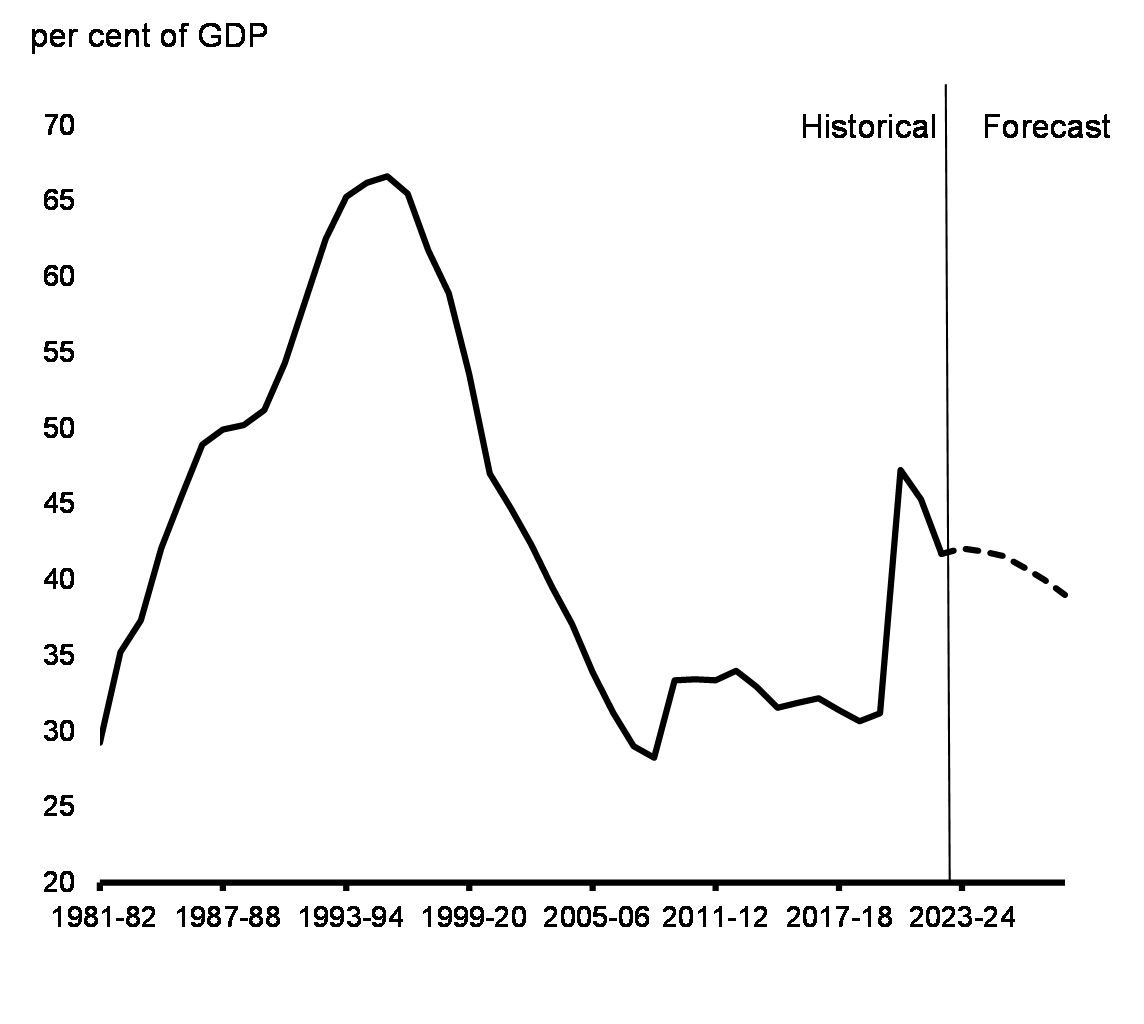
Budget 2024 is consistent with the government's fiscal anchor, and these fiscal objectives. Notably, Budget 2024 surpasses the government's debt-to-GDP fiscal objective, forecasting a significant fall from 2023-24, and onwards. Budget 2024 projects that, in 2024-25, the debt-to-GDP ratio will be 41.9 per cent, before declining to 39.0 per cent over the five year forecast horizon.
Moving forward, as part of its responsible economic plan, the government will keep deficits below 1 per cent of GDP beginning in 2026-27 and future years.
Federal Debt
Public Debt Charges
Preserving Canada's Fiscal Advantage
The fiscal objectives announced in the 2023 Fall Economic Statement reinforced the fiscal anchor of a declining federal debt-to-GDP ratio over the medium-term, further underscoring the government's commitment to long-term fiscal strength. In particular, and as discussed in more detail in Annex 1, the fiscal objective of keeping deficits below 1 per cent of GDP,beginning in 2026-27, provides additional insurance that public finances remain strong beyond the medium-term as Canada adapts to an aging population, the impacts of climate change, and the transition to net-zero.
Budget 2024's forecast upholds these fiscal objectives, with the federal debt-to-GDP ratio declining in 2024-25 and throughout the remainder of the forecast, and deficit-to-GDP ratios below 1 per cent of GDP starting in 2026-27.
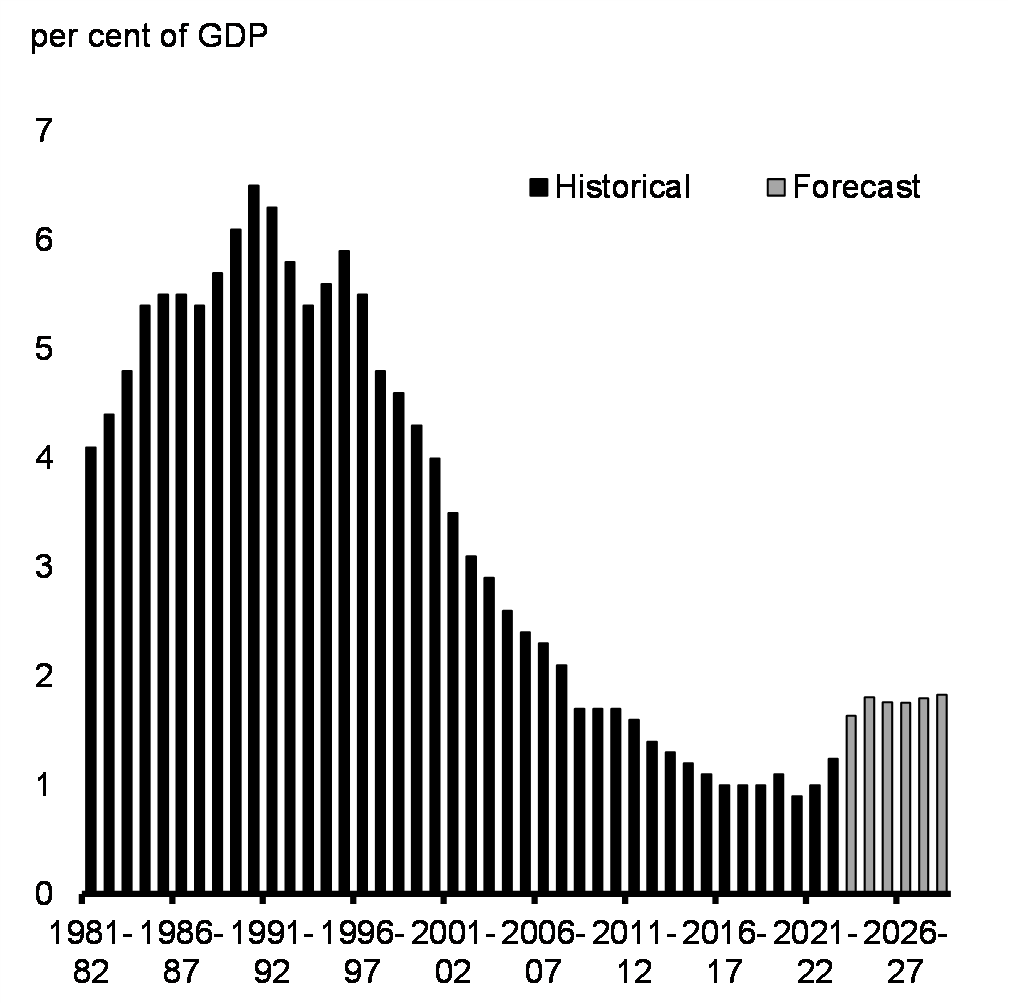
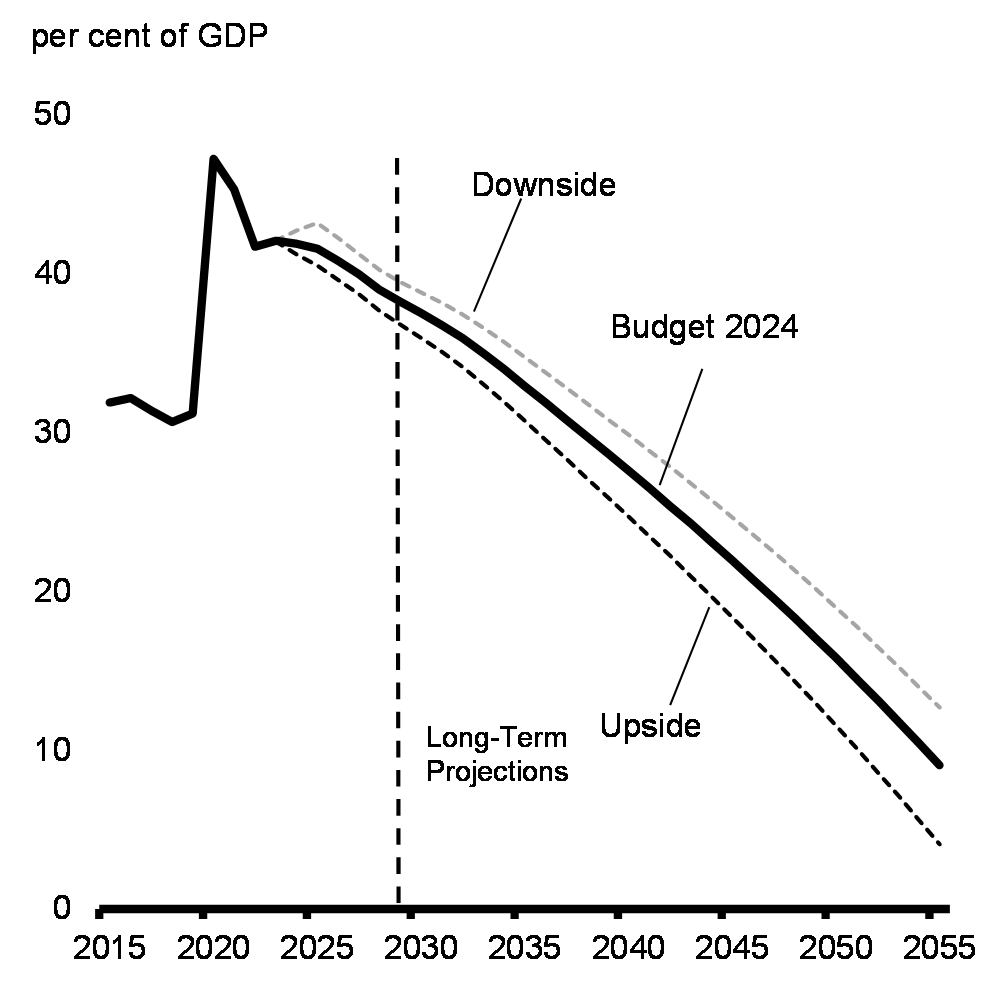
Modelling scenarios based on a set of reasonable economic and demographic assumptions show both the federal debt-to-GDP ratio (Chart 24) and the public debt charges-to-GDP ratio (Chart 25) declining over the entire long-term projection horizon spanning from 2029-30 to 2055-56. This is despite adverse demographic trends, including an aging population, assumed moderate future productivity growth rates and higher borrowing costs. Sensitivity analysis around these long-term fiscal projections also indicates fiscal sustainability would be preserved under the downside scenario (see Annex 1 for details).
Federal Debt
Public Debt Charges
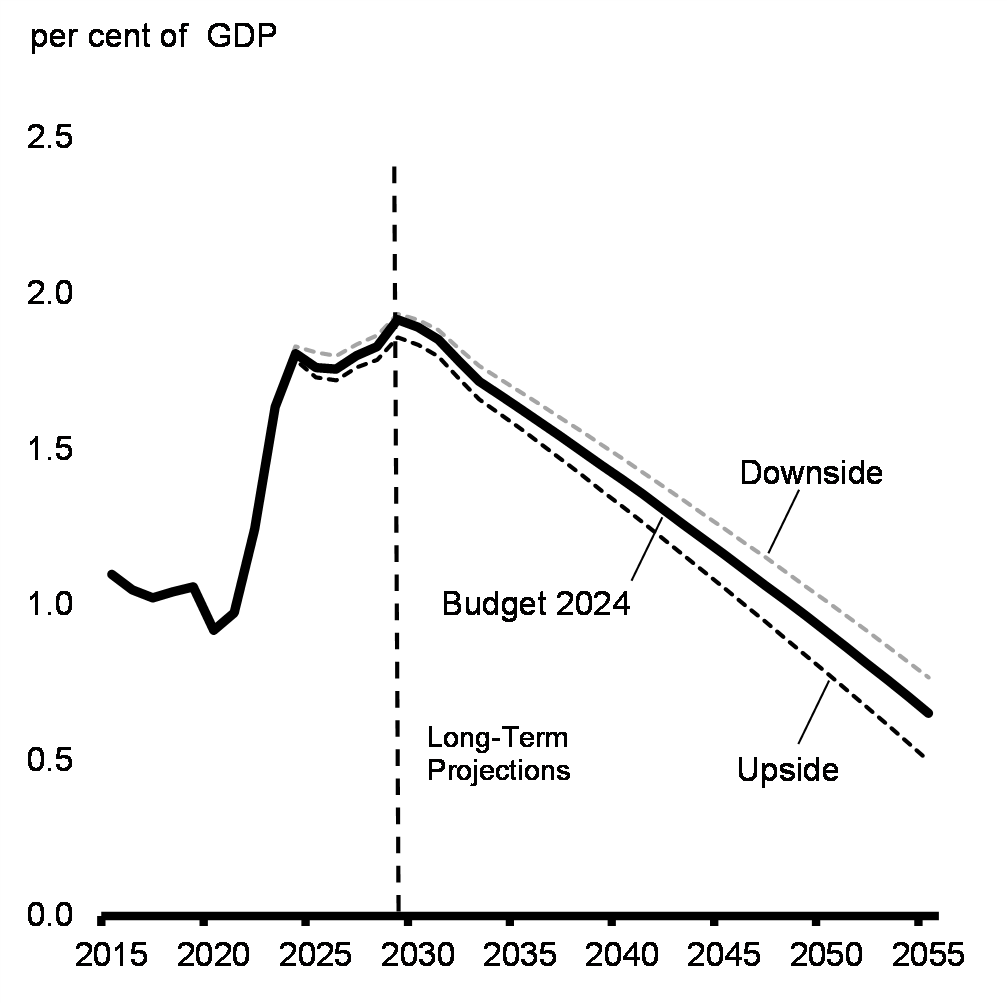
Notes: While based on reasonable assumptions, these long-term projections should not be viewed as forecasts. Notably, these projections do not reflect all potential economic and fiscal impacts of the global economic evolutions that Canada will have to navigate over the coming decades, nor do they fully reflect positive impacts that can be expected to result from the foundational investments made by the government up to now. Details and sensitivity analysis around these long-term projections are presented in Annex 1.
Sources: Statistics Canada; Department of Finance Canada.
International Comparisons
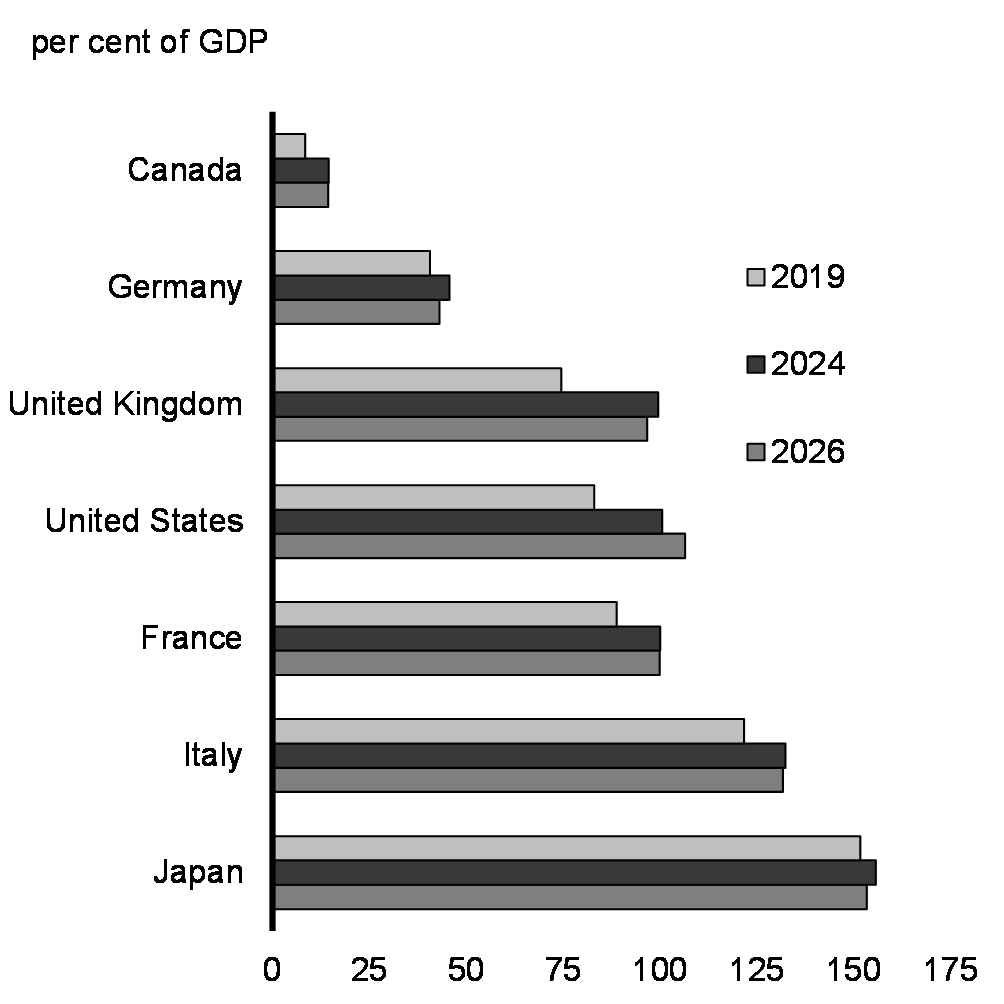
Canada's net debt as a share of the economy remains lower today than in any other G7 country—an advantage that Canada is expected to maintain (Chart 26). Canada's responsible economic plan has also delivered the fastest fiscal consolidation in the G7 since the depths of the pandemic, resulting in Canada having the smallest net debt and deficit in the G7 as a share of the economy over the current and next two years (Chart 27).
By meeting the additional fiscal objectives introduced in the 2023 Fall Economic Statement, Budget 2024 maintains a long Canadian tradition of fiscal responsibility, which is a pillar of Canada's excellent credit ratings from Moody's (Aaa), S&P (AAA), Fitch (AA+), as well as DBRS Morningstar (AAA). Along with Germany, Canada is one of only two G7 economies to have a AAA rating from at least two of the three major global credit rating agencies.
IMF General Government Net Debt Projections, G7 Economies
IMF General Government Budgetary Balance Projections, G7 Economies
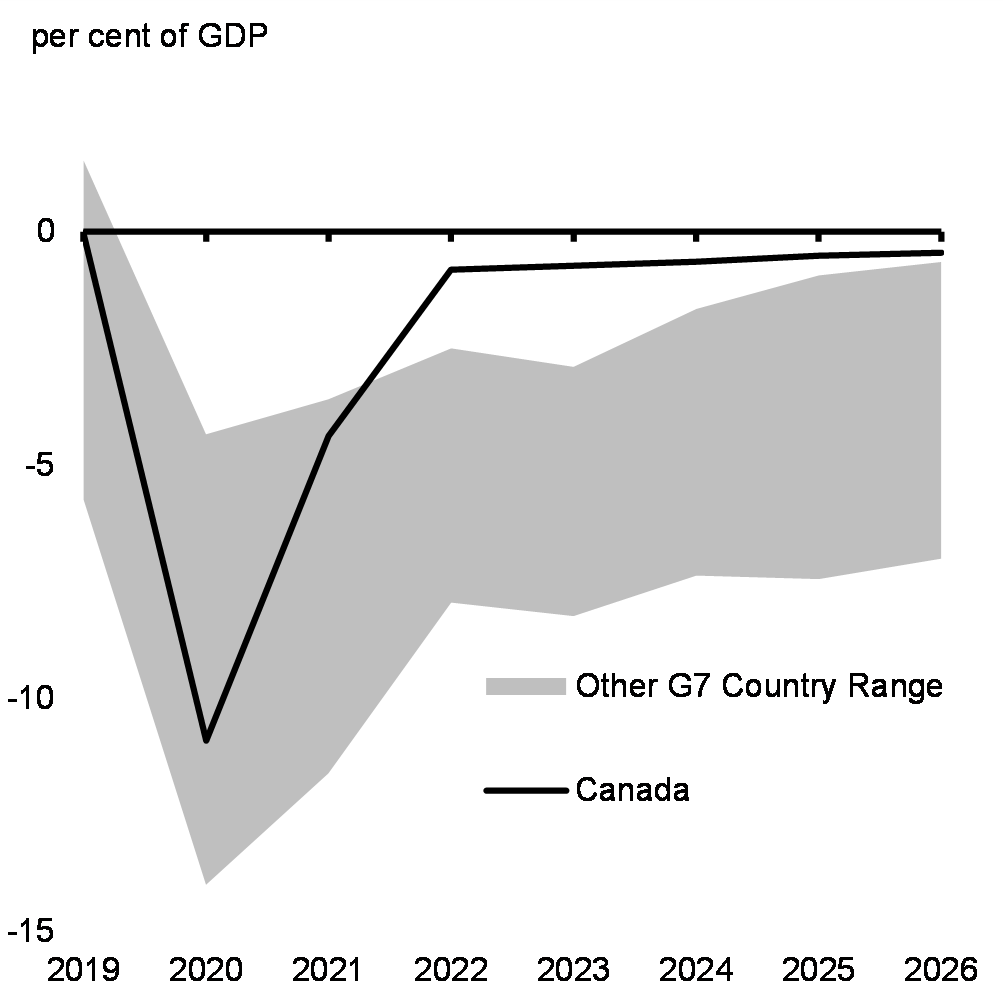
Notes: The internationally comparable definition of "general government" includes the central, state, and local orders of government, as well as social security funds. For Canada, this includes the federal, provincial/territorial, and local and Indigenous government sectors, as well as the Canada Pension Plan and the Quebec Pension Plan.
Source: International Monetary Fund, October 2023 Fiscal Monitor.
Page details
- Date modified: