
Archived -
Annex 1
Details of Economic and Fiscal Projections
On this page:
1.1 Economic Projections
The average of private sector forecasts has been used as the basis for economic and fiscal planning since 1994. This helps ensure objectivity and transparency, and introduces an element of independence into the government's economic and fiscal forecast. The economic forecast presented in this section is based on a survey conducted in early September 2022.
The September survey includes the views of 13 private sector economists:
- BMO Capital Markets,
- Caisse de dépôt et placement du Québec,
- CIBC World Markets,
- The Conference Board of Canada,
- Desjardins,
- IHS Markit,
- Industrial Alliance Insurance and Financial Services Inc.,
- Laurentian Bank Securities,
- National Bank Financial Markets,
- Royal Bank of Canada,
- Scotiabank,
- TD Bank Financial Group, and
- The University of Toronto (Policy and Economic Analysis Program).
Since the survey was conducted in early September, global economic and financial conditions have continued to deteriorate. While the macroeconomic inputs of the September 2022 survey continue to provide a reasonable basis for economic and fiscal planning, the balance of risks to the growth outlook are tilted to the downside, with growth more likely to come in below the survey than above. To facilitate prudent economic and fiscal planning, the Department of Finance has developed an alternative scenario that illustrates a slower growth track relative to the September survey (see below for details).
September 2022 Survey of Private Sector Economists
Inflation has been much higher than projected by private sector economists in Budget 2022, which was based on a survey conducted in early February 2022, before Russia's illegal invasion of Ukraine. While private sector economists continue to believe Consumer Price Index (CPI) inflation will return to the Bank of Canada's target, this process is taking longer than previously expected. CPI inflation was projected to remain above 3 per cent until the third quarter of 2023—almost a year later than private sector economists predicted in Budget 2022—before reaching 2 per cent in mid-2024.
Persistent inflationary pressures have also led to a sharp increase in interest rates. At 3.0 per cent in the third quarter of 2022, short-term interest rates were roughly 200 basis point higher than expected by private sector economists in Budget 2022. Further ahead, private sector economists expected short-term interest rates to peak at 3.8 per cent in the first half of 2023. This represents a substantial increase in the outlook for interest rates from that expected by private sector economists in Budget 2022, which had projected short-term interest rates would gradually increase to about 2 per cent by 2024 (Table A1.1).
With higher inflation and interest rates, as well as slower economic growth in the United States and globally, private sector economists anticipated Canada would see significantly weaker growth than anticipated in Budget 2022. Real gross domestic product (GDP) was projected to expand by a still strong 3.2 per cent in 2022 (from 3.9 per cent in Budget 2022) but growth was expected to slow to 0.7 per cent in 2023 (from 3.1 per cent). By the end of 2026, the level of real GDP was expected to remain about 2 per cent below Budget 2022 projections.
Overall, the September 2022 survey average indicates the Canadian economy was expected to see a period of subdued growth. Real GDP growth was projected to be just above zero for the next several quarters. As a result of expected slower economic growth, the unemployment rate was projected to increase from an average of 5.4 per cent in 2022 to 6.2 per cent in 2024—above Budget 2022 projections (5.5 per cent) but low by historical standards. The unemployment rate was then expected to gradually decline to 5.7 per cent by the end of the forecast horizon.
Despite a weakening in growth prospects since Budget 2022, commodity prices have increased sharply following Russia's illegal invasion of Ukraine. The outlook for West Texas Intermediate crude oil prices has been revised up to US$97 per barrel for 2022 and to US$88 per barrel for 2023, about US$17 and US$14 per barrel higher on average than private sector economists expected in Budget 2022. Going forward, crude oil prices were expected to remain higher than Budget 2022 projections by about US$14 per barrel on average per year.
As a result of the rise in both domestic inflation and commodity prices, the outlook for GDP inflation (the broadest measure of economy-wide price inflation) has been revised up significantly to 8.3 per cent in 2022 compared to 3.9 per cent in Budget 2022. Going forward, the GDP inflation outlook was expected to be broadly in line with Budget 2022 projections.
As a result, the projected level of nominal GDP (the broadest measure of the tax base) for 2022 in the September survey was $94 billion above expectations in Budget 2022. However, with a reduced outlook for real GDP growth in 2023, the boost to nominal GDP was expected to partly unwind next year, leaving the projected level of nominal GDP up by an average of $54 billion per year over the entire forecast horizon relative to Budget 2022 projections.
Downside Scenario
As discussed in the Economic Overview, the balance of risks to the September 2022 survey is tilted to the downside and primarily relate to the path of inflation and interest rates, both globally and in Canada. In that context, the Department of Finance has developed a downside scenario that considers the impact of more persistent inflationary pressures and further tightening in monetary policy, leading to a more pronounced economic slowdown.
In this scenario, elevated inflation becomes more deeply entrenched, particularly in the United States, leading central banks to raise interest rates by more than anticipated to return inflation to target. This increases long-term interest rates and leads to a significant tightening in global financial conditions. Tighter financial conditions result in more adverse effects on confidence, wealth and activity, resulting in a sharper correction in housing markets and consumer activity in Canada, as well as larger spillovers from tightening and weaker economic activity in other countries.
In the downside scenario, CPI inflation is 1.8 percentage points above the September 2022 survey in 2023, and stays above 3 per cent until the first quarter of 2024—about six months longer than in the survey—before reaching 2 per cent by the end of 2024. In response, short-term interest rates reach 4.5 per cent in the first half of 2023 and are up by 0.7 percentage points over the entire forecast horizon. As a result, Canada enters a mild recession in the first quarter of 2023. Real GDP contracts by 1.6 per cent from peak to trough, well below the 4.4-per-cent contraction in 2008-09. Similarly, the unemployment rate rises 1.7 percentage points to 6.9 per cent in the second half of 2023, far lower than the peak of 8.7 per cent experienced following the 2008-09 contraction. For 2023 as a whole, real GDP declines by 0.9 per cent and the unemployment rate is 0.5 percentage points above the survey. At the same time, weaker global demand weighs on commodity prices, with oil prices US$8 per barrel below the survey in 2023. Despite higher CPI inflation, lower commodity prices lead to lower GDP inflation and, combined with slower growth, result in a level of nominal GDP that is $45 billion lower than the survey, on average (Table A1.1).
| 2022 | 2023 | 2024 | 2025 | 2026 | 2027 | 2022- 2026 |
|
|---|---|---|---|---|---|---|---|
| Real GDP growth1 | |||||||
| Budget 2022 | 3.9 | 3.1 | 2.0 | 1.9 | 1.8 | --- | 2.5 |
| 2022 Fall Economic Statement | 3.2 | 0.7 | 1.9 | 2.3 | 2.1 | 1.9 | 2.0 |
| Downside Scenario | 3.1 | -0.9 | 2.3 | 2.7 | 2.3 | 2.1 | 1.9 |
| GDP inflation1 | |||||||
| Budget 2022 | 3.9 | 1.7 | 1.8 | 1.9 | 1.9 | --- | 2.3 |
| 2022 Fall Economic Statement | 8.3 | 1.9 | 1.8 | 1.9 | 1.9 | 1.9 | 3.2 |
| Downside Scenario | 7.6 | 1.8 | 1.9 | 1.8 | 1.9 | 1.9 | 3.0 |
| Nominal GDP growth1 | |||||||
| Budget 2022 | 8.0 | 4.8 | 3.9 | 3.8 | 3.7 | --- | 4.8 |
| 2022 Fall Economic Statement | 11.8 | 2.6 | 3.7 | 4.2 | 4.1 | 3.9 | 5.3 |
| Downside Scenario | 11.0 | 0.9 | 4.3 | 4.6 | 4.3 | 4.0 | 5.0 |
| Nominal GDP level (billions of dollars)1 | |||||||
| Budget 2022 | 2,693 | 2,823 | 2,933 | 3,044 | 3,157 | --- | |
| 2022 Fall Economic Statement (FES) | 2,787 | 2,859 | 2,965 | 3,091 | 3,217 | 3,342 | |
| Downside Scenario | 2,767 | 2,793 | 2,913 | 3,046 | 3,177 | 3,305 | |
Difference between 2022 FES and Budget 2022 |
94 | 37 | 32 | 47 | 60 | --- | 54 |
Difference between Downside Scenario and 2022 FES |
-19 | -67 | -53 | -45 | -41 | -38 | -45 |
| 3-month treasury bill rate | |||||||
| Budget 2022 | 0.8 | 1.7 | 2.0 | 2.1 | 2.1 | --- | 1.7 |
| 2022 Fall Economic Statement | 2.2 | 3.6 | 2.8 | 2.3 | 2.1 | 2.1 | 2.6 |
| Downside Scenario | 2.4 | 4.4 | 3.5 | 3.2 | 3.0 | 3.0 | 3.3 |
| 10-year government bond rate | |||||||
| Budget 2022 | 2.0 | 2.4 | 2.6 | 2.8 | 3.0 | --- | 2.6 |
| 2022 Fall Economic Statement | 2.8 | 3.1 | 2.8 | 2.8 | 2.9 | 3.0 | 2.9 |
| Downside Scenario | 2.8 | 3.2 | 3.1 | 3.2 | 3.3 | 3.5 | 3.1 |
| Exchange rate (US cents/C$) | |||||||
| Budget 2022 | 79.9 | 80.2 | 80.5 | 80.4 | 80.1 | --- | 80.2 |
| 2022 Fall Economic Statement | 77.9 | 77.1 | 77.9 | 78.8 | 79.2 | 79.7 | 78.2 |
| Downside Scenario | 77.0 | 73.0 | 73.9 | 76.9 | 78.2 | 78.4 | 75.8 |
| Unemployment rate | |||||||
| Budget 2022 | 5.8 | 5.5 | 5.5 | 5.5 | 5.5 | --- | 5.5 |
| 2022 Fall Economic Statement | 5.4 | 6.1 | 6.2 | 6.0 | 5.8 | 5.7 | 5.9 |
| Downside Scenario | 5.5 | 6.6 | 6.6 | 6.3 | 6.0 | 5.9 | 6.2 |
| Consumer Price Index inflation | |||||||
| Budget 2022 | 3.9 | 2.4 | 2.2 | 2.1 | 2.0 | --- | 2.5 |
| 2022 Fall Economic Statement | 6.8 | 3.5 | 2.1 | 2.1 | 2.1 | 2.1 | 3.3 |
| Downside Scenario | 6.8 | 5.3 | 2.5 | 1.6 | 2.0 | 2.1 | 3.7 |
| U.S. real GDP growth | |||||||
| Budget 2022 | 3.8 | 2.6 | 2.0 | 1.8 | 1.9 | --- | 2.4 |
| 2022 Fall Economic Statement | 1.7 | 0.6 | 1.7 | 2.2 | 2.1 | 2.0 | 1.6 |
| Downside Scenario | 1.4 | -1.2 | 2.6 | 2.5 | 2.5 | 2.1 | 1.6 |
| West Texas Intermediate crude oil price ($US per barrel) | |||||||
| Budget 2022 | 80 | 74 | 70 | 68 | 66 | --- | 72 |
| 2022 Fall Economic Statement | 97 | 88 | 85 | 82 | 81 | 81 | 87 |
| Downside Scenario | 95 | 80 | 76 | 77 | 77 | 78 | 81 |
|
Note: Forecast averages may not equal average of years due to rounding. Numbers may not add due to rounding. 1 Figures have been restated to reflect the historical revisions in the Canadian System of National Accounts. Sources: Statistics Canada; for Budget 2022, Department of Finance Canada February 2022 survey of private sector economists, which has been adjusted to incorporate the actual results of the National Accounts for the fourth quarter of 2021 released on March 1, 2022; for the 2022 Fall Economic Statement, Department of Finance Canada September 2022 survey of private sector economists; Department of Finance Canada calculations. |
|||||||
1.2 Changes to Fiscal Projections Since Budget 2022
The baseline fiscal outlook presented in this Fall Economic Statement is centered on the economic projections provided by the September 2022 survey of private sector economists. In addition, given that economic risks are tilted to the downside, the fiscal impact of the Department of Finance's downside scenario is also provided. The tables that follow present changes to the fiscal outlook since Budget 2022, including the impact of government policy actions taken since Budget 2022 and measures in this Fall Economic Statement, year-to-date financial results, and updated economic projections provided by both the private sector survey and under the downside scenario.
Changes to the Fiscal Outlook Since Budget 2022
| Projection | |||||||
|---|---|---|---|---|---|---|---|
| 2021– 2022 |
2022– 2023 |
2023– 2024 |
2024– 2025 |
2025– 2026 |
2026– 2027 |
2027– 2028 |
|
| Budgetary balance – Budget 2022 | -113.8 | -52.8 | -39.9 | -27.8 | -18.6 | -8.4 | - |
| Impact of September private sector survey and other fiscal developments | 23.6 | 29.8 | 18.8 | 11.0 | 10.2 | 11.4 | - |
| Budgetary balance before policy actions and measures | -90.2 | -23.0 | -21.1 | -16.8 | -8.4 | 3.0 | 12.8 |
| Policy actions since Budget 2022 | - | -7.3 | -4.3 | -2.9 | -1.8 | -1.8 | -3.5 |
| 2022 Fall Economic Statement measures (by chapter) | |||||||
| Making Life More Affordable | - | -4.4 | -1.3 | -1.3 | -1.3 | -1.4 | -1.4 |
| Jobs, Growth, and an Economy That Works for Everyone | - | -0.1 | -2.1 | -2.3 | -1.8 | -2.3 | -2.4 |
| Fair and Effective Government | - | -0.6 | -0.8 | -0.2 | 0.4 | 0.5 | 0.6 |
| Provision for anticipated near-term pressures1 | - | -1.0 | -1.0 | -2.0 | -1.5 | -1.5 | -1.5 |
| Total – 2022 Fall Economic Statement measures | - | -6.1 | -5.2 | -5.8 | -4.2 | -4.6 | -4.7 |
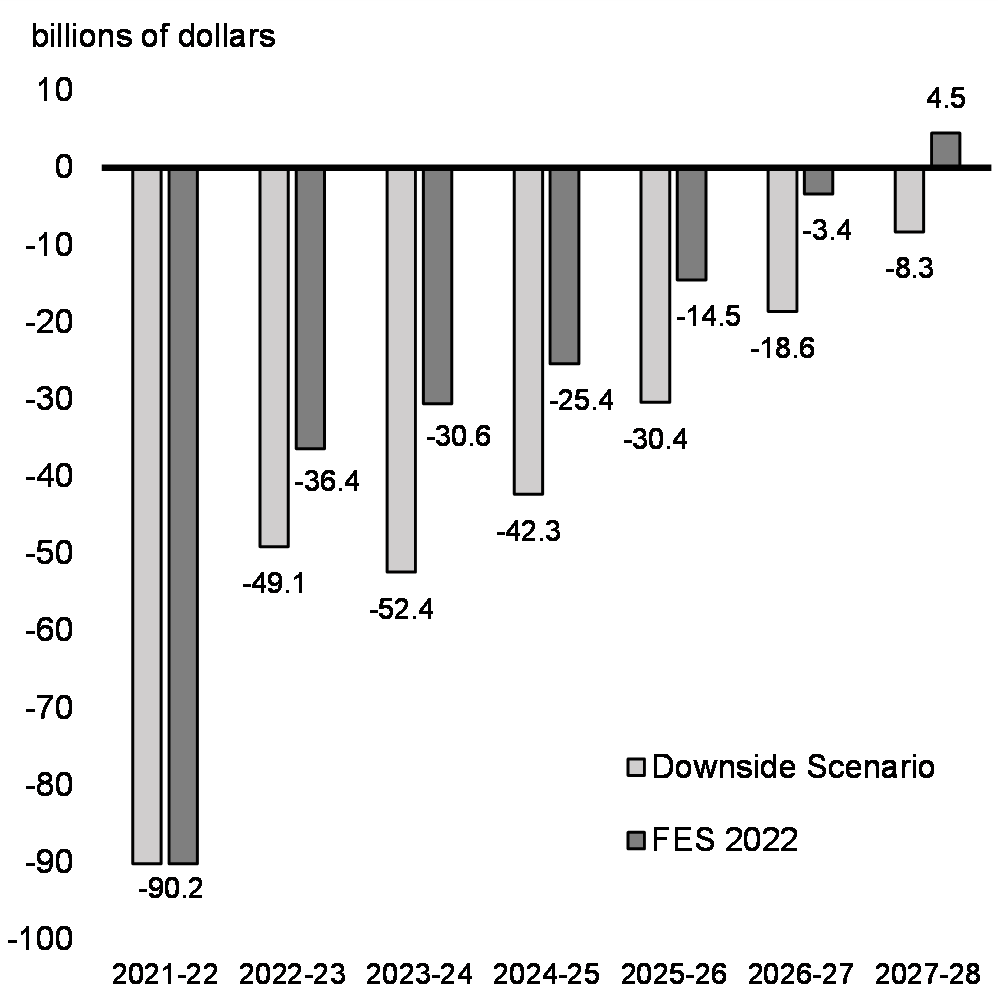
| Budgetary Balance – Baseline Scenario | -90.2 | -36.4 | -30.6 | -25.4 | -14.5 | -3.4 | 4.5 |
| Fiscal impact of downside economic scenario | - | -12.7 | -21.8 | -16.8 | -15.9 | -15.3 | -12.8 |
| Budgetary Balance – Downside Scenario | -90.2 | -49.1 | -52.4 | -42.3 | -30.4 | -18.6 | -8.3 |
| Baseline Scenario | |||||||
| Budgetary Balance (per cent of GDP) | -3.6 | -1.3 | -1.1 | -0.9 | -0.5 | -0.1 | 0.1 |
| Federal Debt (per cent of GDP) | 45.5 | 42.3 | 42.2 | 41.6 | 40.4 | 38.9 | 37.3 |
| Downside Scenario | |||||||
| Budgetary Balance (per cent of GDP) | -3.6 | -1.8 | -1.9 | -1.5 | -1.0 | -0.6 | -0.3 |
| Federal Debt (per cent of GDP) | 45.5 | 43.0 | 44.5 | 44.1 | 43.2 | 42.0 | 40.6 |
| Budget 2022 Projections | |||||||
| Budgetary Balance (per cent of GDP) | -4.6 | -2.0 | -1.4 | -0.9 | -0.6 | -0.3 | - |
| Federal Debt (per cent of GDP) | 46.5 | 45.1 | 44.5 | 43.8 | 42.8 | 41.5 | - |
|
Note: Totals may not add due to rounding. 1 Provision of $8.5 billion over six years, for pressures that are anticipated to materialize in the near term. |
|||||||
Economic and Fiscal Developments Since Budget 2022 – Baseline Scenario
| Projection | ||||||
|---|---|---|---|---|---|---|
| 2021– 2022 |
2022– 2023 |
2023– 2024 |
2024– 2025 |
2025– 2026 |
2026– 2027 |
|
| Economic and fiscal developments by component1 | ||||||
| Change in budgetary revenues | ||||||
| (1.1) Income taxes | 15.5 | 37.6 | 29.6 | 25.0 | 23.9 | 22.3 |
| (1.2) Excise taxes/duties | 2.5 | 3.0 | 2.9 | 3.7 | 3.9 | 4.0 |
| (1.3) Proceeds from the pollution pricing framework | -0.3 | -0.5 | -0.4 | -0.5 | -0.8 | -1.2 |
| (1.4) Other revenues2 | 1.3 | -0.1 | 1.8 | 0.8 | -0.8 | -0.4 |
| (1) Total budgetary revenues | 18.9 | 40.1 | 33.8 | 28.9 | 26.1 | 24.7 |
| Change in program expenses | ||||||
| (2.1) Major transfers to persons | 2.5 | 6.1 | -2.5 | -4.7 | -5.4 | -5.2 |
| (2.2) Major transfers to other levels of government | 0.0 | 1.0 | 0.1 | -0.4 | 0.0 | -0.1 |
| (2.3) Proceeds from the pollution pricing framework returned | 0.3 | 0.4 | 0.7 | 0.5 | 0.8 | 1.2 |
| (2.4) Direct program expenses | 1.3 | -9.1 | -3.0 | -5.4 | -5.8 | -5.7 |
| (2) Total program expenses, excluding net actuarial losses | 4.1 | -1.6 | -4.7 | -10.0 | -10.3 | -9.7 |
| (3) Net actuarial losses (gains) | 0.2 | -0.9 | 0.1 | -2.2 | -2.5 | -2.4 |
| (4) Public debt charges | 0.4 | -7.8 | -10.4 | -5.7 | -3.1 | -1.2 |
| (5) Total economic and fiscal developments | 23.6 | 29.8 | 18.8 | 11.0 | 10.2 | 11.4 |
|
1 A negative number implies a deterioration in the budgetary balance (lower revenues or higher spending). A positive number implies an improvement in the budgetary balance (higher revenues or lower spending). 2 Includes Employment Insurance premiums, Digital Services Tax and Underused Housing Tax in this table only for presentation purposes |
||||||
The outlook for budgetary revenues has improved relative to Budget 2022 reflecting upward revisions to nominal GDP projections, in addition to the carry-forward of stronger-than-expected results from 2021-22.
- As a result of improvements in corporate financial performance, as well as employment and wage growth, income tax revenue gains are expected to be higher by approximately $27.7 billion per year on average over the forecast horizon.
- The outlook for excise taxes/duties is revised up largely due to the carry-forward of better-than-expected 2021-22 results.
- Proceeds from the federal pollution pricing framework that arise from the provinces and territories that are a part of the federal backstop (Ontario, Manitoba, Saskatchewan, Alberta, Nunavut, and Yukon) are projected to be lower. The adjustment is largely due to lower emission estimates that stem from more stringent efficiency standards for light duty vehicles. Direct proceeds will continue to be fully returned in the provinces or territories where they are generated. The pollution pricing framework is revenue neutral so this has no impact on the budgetary balance.
- Projected other revenuesFootnote 1 are revised down in 2022-23 largely due to the impact of higher interest rates on the Bank of Canada's income. Going forward, this element is offset by upward revisions to interest-related components of other revenues including interest and penalties on tax debt and interest on lending to Crown corporations.
Program expenses have been revised up from 2023-24 onwards relative to Budget 2022, primarily reflecting the impact of higher expected CPI inflation on major transfers to persons, and the impact of revised actuarial assumptions on pension and benefits liabilities within direct program spending.
- Relative to Budget 2022, major transfers to persons are lower in 2022-23, largely due to revised costings for EI transition benefit measures. Over the remainder of the forecast horizon, the outlook for major transfers to persons has been revised upwards to reflect the impact of higher expected CPI inflation, to which the Canada Child Benefit and elderly benefit rates are indexed.
- Relative to Budget 2022, major transfers to other levels of government are projected to be lower in 2022-23 and 2023-24, primarily because of improved economic projections resulting in higher recoveries for the Quebec Abatement— the reduction in cash transfers owed to Quebec reflecting the increased value of tax points that were transferred to the province in the 1960s and 1970s. This impact is more than offset in most remaining years of the forecast due to the impact of the revised economic outlook on the Canada Health Transfer and Equalization payments, which are indexed to growth in nominal GDP.
- Proceeds from the pollution pricing framework returned are revised down across the horizon in line with lower anticipated proceeds resulting from the impact of climate action measures, as discussed above, on projected emissions.
- Direct program expenses have been adjusted upward across the forecast horizon relative to the Budget 2022 forecast.
- Higher expenses in 2022-23 reflect revised timing of rapid testing kit purchases that were announced in January 2022, and revised timing and amounts of provisions for contingent liabilities and losses.
- Across the horizon, higher expenses are driven by higher projected pension and benefit service costs due to changes in actuarial assumptions and increased usage of benefits, higher bad debt expenses on taxes receivable, which is assumed to increase with upward revisions to tax revenues, as discussed above, and accelerated timing of the Budget 2022 commitment to reduce planned spending by $3 billion as discussed in Chapter 3. This increase in expenses is partially offset by decreases in the forecast of refundable corporate and personal income tax credits relative to previous expectations based on a carry-forward of 2021-22 results.
Net actuarial losses, which represent changes in the measurement of the government's obligations for pensions and other employee future benefits accrued in previous fiscal years and pension fund assets, are expected to be higher in 2022-23 and again in 2024-25 onwards relative to Budget 2022. This increase is largely a result of the amortization of 2021-22 losses on RCMP and veterans benefit plans that resulted from changes to actuarial assumptions related to claim intake and medical inflation. These losses are offset in 2023-24 and in part across the horizon by projected gains resulting from higher projected long-term interest rates used to measure the present value of the obligations.
Relative to Budget 2022, public debt charges are higher in all years of the forecast. Increases are more pronounced in the first three years due to higher short- and long-term interest rates as forecast by private sector economists and higher inflation impacts on Real Return Bonds concentrated in 2022-23. These increases are partially offset by improvements in the budgetary balance and reductions in projected borrowing requirements.
Incremental Fiscal Impact of Downside Scenario
| 2022– 2023 |
2023– 2024 |
2024– 2025 |
2025– 2026 |
2026– 2027 |
2027- 2028 |
|
|---|---|---|---|---|---|---|
| Economic and fiscal developments by component1 | ||||||
| Change in budgetary revenues | ||||||
| (1.1) Income taxes | -8.1 | -14.6 | -11.1 | -10.0 | -9.2 | -8.3 |
| (1.2) Excise taxes/duties | -1.1 | -0.4 | 0.0 | -0.1 | -0.1 | 0.0 |
| (1.3) Proceeds from the pollution pricing framework | -0.0 | -0.2 | -0.1 | -0.1 | -0.1 | -0.1 |
| (1.4) Other revenues2 | -1.8 | -1.4 | 0.2 | 1.6 | 1.9 | 1.7 |
| (1) Total budgetary revenues | -11.0 | -16.6 | -11.0 | -8.7 | -7.5 | -6.7 |
| Change in program expenses | ||||||
| (2.1) Major transfers to persons | -0.5 | -2.7 | -3.2 | -3.4 | -3.3 | -3.2 |
| (2.2) Major transfers to other levels of government | 0.0 | 0.6 | 1.0 | 1.3 | 1.0 | 0.9 |
| (2.3) Proceeds from the pollution pricing framework returned | 0.0 | 0.2 | 0.1 | 0.1 | 0.1 | 0.1 |
| (2.4) Direct program expenses | 0.1 | 0.5 | 0.7 | 0.7 | 1.1 | 1.2 |
| (2) Total program expenses, excluding net actuarial losses | -0.4 | -1.4 | -1.4 | -1.4 | -1.1 | -1.1 |
| (3) Net actuarial losses (gains) | 0.0 | 0.9 | 0.9 | 1.2 | 1.7 | 2.1 |
| (4) Public debt charges | -1.3 | -4.7 | -5.3 | -7.0 | -8.3 | -7.2 |
| (5) Total economic and fiscal developments | -12.7 | -21.8 | -16.8 | -15.9 | -15.3 | -12.8 |
|
1 A negative number implies a deterioration in the budgetary balance (lower revenues or higher spending). A positive number implies an improvement in the budgetary balance (higher revenues or lower spending). 2 Includes Employment Insurance premiums, Digital Services Tax and Underused Housing Tax in this table only for presentation purposes. |
||||||
The reduction in economic activity in the downside scenario would lead to lower revenues in all years of the forecast horizon, driven by the following factors:
- Lower expected income tax revenues, down by approximately $10 billion annually arising from weaker commodity prices and lower forecasted nominal GDP. This effect is led by lower corporate and personal income tax revenues, due to both lower projected corporate profits and personal incomes.
- Reduced excise taxes and duties owing primarily to a projected reduction in consumption, particularly early in the forecast horizon.
- Lower proceeds from the pollution pricing framework due to the impact of reduced economic activity on energy consumption, which will in turn result in lower proceeds returned, as described below.
- Higher interest rates result in the short-term decrease in Bank of Canada net profits, which moderates in the outer years of the forecast.
The negative impact of reduced revenues under the downside scenario would be further worsened by higher projected program expenses primarily due to the higher outlook for CPI, to which some benefit programs are indexed. These higher expenses would be partially offset by lower transfers to other levels of government and direct program spending as described below:
- Major transfers to persons would be expected to rise relative to the baseline projection as the higher unemployment rate and lower incomes in the downside scenario increase the use of income supports, particularly Employment Insurance benefits, and higher and more persistent CPI inflation also raises the cost of inflation-indexed programs such as elderly benefits and the Canada Child Benefit.
- Major transfers to other levels of government, however, would be expected to be lower, as social transfers, including the Canada Health Transfer and Equalization, are indexed to nominal GDP, which is lower under this scenario.
- A reduction in pollution pricing framework proceeds returned in line with the decrease in proceeds collected owing to the impact of reduced economic activity on energy consumption.
Direct program spending would also be expected to be lower under this scenario, largely reflecting lower employee pension and future benefit service charges as a result of higher interest rates.
Net actuarial losses would be projected to be lower as a result of higher projected long-term interest rates used to measure the present value of the obligations.
Public debt charges are the expense most affected under the downside scenario, rising by approximately $6.0 billion annually over the forecast horizon as sustained higher projected interest rates lead to higher interest payments on the government's interest-bearing debt.
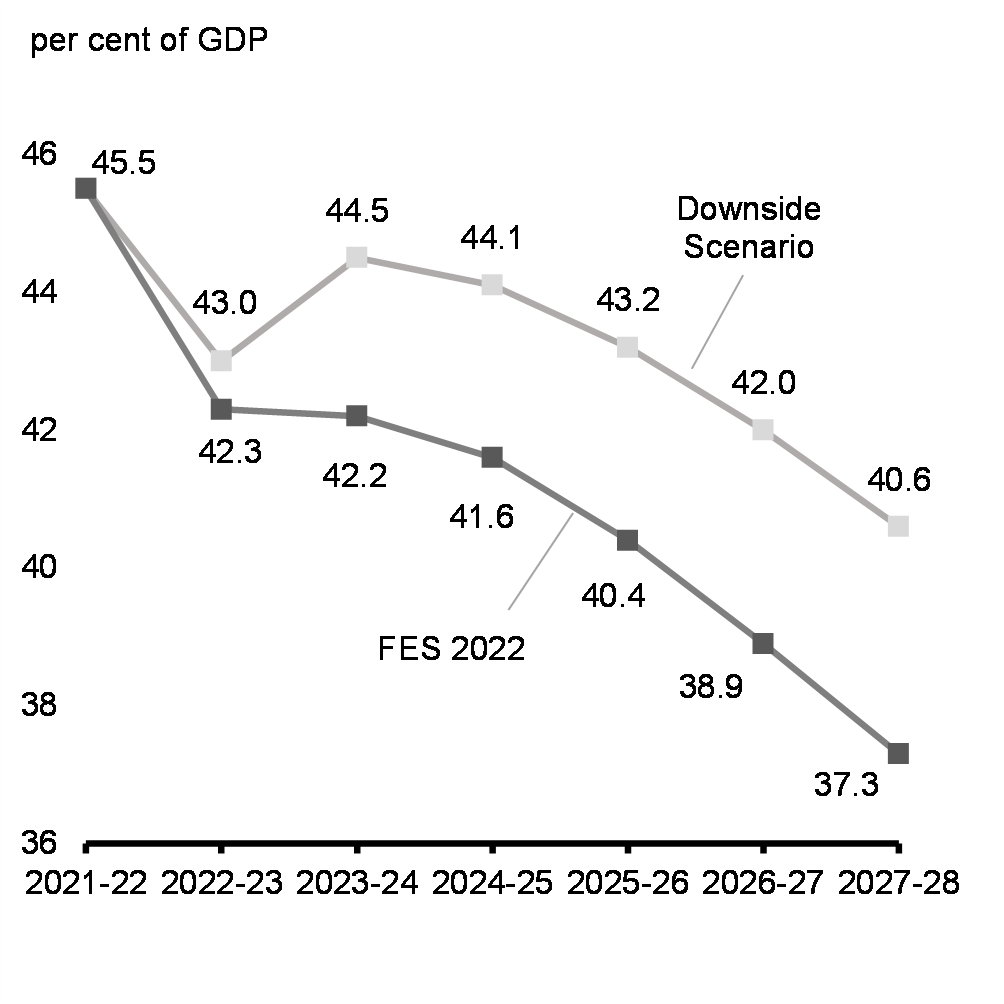
In total, the downside scenario could be expected to add about $16 billion on average to the deficit across the horizon, and the federal debt-to-GDP ratio would be 3.3 percentage points higher, at 40.6 per cent, by 2027-28 as shown in Charts A1.1 and A1.2 below.
Budgetary Balance: FES 2022 Baseline and Downside Scenario
Federal Debt-to-GDP Ratio: FES 2022 Baseline and Downside Scenario
Summary Statement of Transactions
| Projection | |||||||
|---|---|---|---|---|---|---|---|
| 2021– 2022 |
2022– 2023 |
2023– 2024 |
2024– 2025 |
2025– 2026 |
2026– 2027 |
2027– 2028 |
|
| Budgetary revenues | 413.3 | 445.9 | 462.5 | 479.4 | 500.8 | 520.3 | 542.4 |
| Program expenses, excluding net actuarial losses | 468.8 | 437.8 | 443.8 | 457.6 | 469.1 | 479.0 | 491.9 |
| Public debt charges | 24.5 | 34.7 | 43.3 | 42.7 | 42.9 | 44.1 | 44.8 |
| Total expenses, excluding net actuarial losses | 493.3 | 472.5 | 487.1 | 500.3 | 512.0 | 523.1 | 536.7 |
| Budgetary balance before net actuarial losses | -80.0 | -26.6 | -24.6 | -20.9 | -11.1 | -2.7 | 5.7 |
| Net actuarial losses | -10.2 | -9.8 | -6.0 | -4.6 | -3.3 | -0.6 | -1.2 |
| Budgetary balance | -90.2 | -36.4 | -30.6 | -25.4 | -14.5 | -3.4 | 4.5 |
| Financial Position | |||||||
| Total liabilities | 1,838.7 | 1,851.4 | 1,884.7 | 1,946.3 | 1,997.6 | 2,032.1 | 2,052.3 |
| Financial assets | 600.3 | 568.5 | 567.7 | 599.3 | 631.3 | 659.2 | 681.8 |
| Net debt | 1,238.4 | 1,282.9 | 1,317.0 | 1,347.0 | 1,366.3 | 1,372.9 | 1,370.5 |
| Non-financial assets | 103.9 | 105.6 | 109.1 | 113.6 | 118.5 | 121.7 | 123.9 |
| Federal debt1,2 | 1,134.5 | 1,177.3 | 1,207.9 | 1,233.4 | 1,247.8 | 1,251.2 | 1,246.7 |
| Per cent of GDP | |||||||
| Budgetary revenues | 16.6 | 16.0 | 16.2 | 16.2 | 16.2 | 16.2 | 16.2 |
| Program expenses, excluding net actuarial losses | 18.8 | 15.7 | 15.5 | 15.4 | 15.2 | 14.9 | 14.7 |
| Public debt charges | 1.0 | 1.2 | 1.5 | 1.4 | 1.4 | 1.4 | 1.3 |
| Budgetary balance | -3.6 | -1.3 | -1.1 | -0.9 | -0.5 | -0.1 | 0.1 |
| Federal debt | 45.5 | 42.3 | 42.2 | 41.6 | 40.4 | 38.9 | 37.3 |
|
1 The opening financial position for 2022-23 has been adjusted from the closing position shown in the Public Accounts of Canada 2022 to reflect the impact of two new accounting standards for financial instruments and asset retirement obligations that came into effect in 2022-23. For further details regarding these adjustments, see Note 8 in The Fiscal Monitor – August 2022, available on the Department of Finance website. 2 The projected level of federal debt for 2022-23 includes an estimate of other comprehensive income of $0.7 billion for enterprise Crown corporations and other government business enterprises, and an estimate of $0.2 billion for net remeasurement gains on swap agreements and foreign exchange forward agreements. |
|||||||
Outlook for Budgetary Revenues
| Projection | |||||||
|---|---|---|---|---|---|---|---|
| 2021– 2022 |
2022– 2023 |
2023– 2024 |
2024– 2025 |
2025– 2026 |
2026– 2027 |
2027– 2028 |
|
| Income tax revenues | |||||||
| Personal income tax | 198.4 | 209.4 | 216.3 | 226.2 | 238.7 | 249.5 | 261.6 |
| Corporate income tax | 78.8 | 91.0 | 86.4 | 85.2 | 87.1 | 88.2 | 91.6 |
| Non-resident income tax | 10.8 | 13.8 | 13.7 | 12.9 | 13.0 | 13.4 | 14.3 |
| Total | 288.0 | 314.2 | 316.4 | 324.3 | 338.8 | 351.1 | 367.6 |
| Excise tax and duty revenues | |||||||
| Goods and Services Tax | 46.2 | 47.2 | 51.5 | 53.9 | 55.8 | 57.9 | 60.0 |
| Customs import duties | 5.2 | 6.4 | 6.6 | 6.8 | 7.0 | 7.3 | 7.6 |
| Other excise taxes/duties | 11.3 | 12.3 | 12.6 | 12.9 | 13.0 | 13.2 | 13.3 |
| Total | 62.7 | 65.8 | 70.6 | 73.5 | 75.9 | 78.4 | 80.9 |
| Other taxes | 0.0 | 0.2 | 0.9 | 0.9 | 1.0 | 1.0 | 1.0 |
| Total tax revenues | 350.7 | 380.1 | 387.9 | 398.8 | 415.7 | 430.6 | 449.5 |
| Proceeds from the pollution pricing framework | 6.3 | 7.8 | 9.8 | 11.8 | 13.4 | 15.0 | 16.3 |
| Employment Insurance premium revenues | 23.9 | 26.6 | 28.2 | 29.6 | 30.7 | 31.7 | 32.8 |
| Other revenues | |||||||
| Enterprise Crown corporations | 12.8 | 6.8 | 8.5 | 10.2 | 11.4 | 12.7 | 12.8 |
| Other programs | 18.7 | 23.4 | 25.9 | 26.4 | 26.7 | 27.3 | 27.8 |
| Net foreign exchange | 0.9 | 1.1 | 2.2 | 2.6 | 2.9 | 3.1 | 3.2 |
| Total | 32.4 | 31.4 | 36.6 | 39.2 | 41.1 | 43.0 | 43.8 |
| Total budgetary revenues | 413.3 | 445.9 | 462.5 | 479.4 | 500.8 | 520.3 | 542.4 |
| Per cent of GDP | |||||||
| Total tax revenues | 14.1 | 13.6 | 13.6 | 13.4 | 13.4 | 13.4 | 13.4 |
| Proceeds from the pollution pricing framework | 0.3 | 0.3 | 0.3 | 0.4 | 0.4 | 0.5 | 0.5 |
| Employment Insurance premium revenues | 1.0 | 1.0 | 1.0 | 1.0 | 1.0 | 1.0 | 1.0 |
| Other revenues | 1.3 | 1.1 | 1.3 | 1.3 | 1.3 | 1.3 | 1.3 |
| Total budgetary revenues | 16.6 | 16.0 | 16.2 | 16.2 | 16.2 | 16.2 | 16.2 |
|
Note: Totals may not add due to rounding. |
|||||||
Table A1.6 above provides an overview of projected budgetary revenues by major component.
Income Tax Revenues
Personal income tax revenues—the largest component of budgetary revenues at 48 per cent in 2021-22—are projected to increase to $209.4 billion in 2022-23, or 5.6 per cent, based on revised estimates for household incomes, particularly labour income and higher levels of employment. For the remainder of the forecast horizon, personal income tax revenue growth will average 4.6 per cent, in line with projected nominal GDP growth.
Corporate income tax revenues are projected to increase by 15.4 per cent, to $91 billion in 2022-23, propelled by broad-based gains, particularly in the financial and natural resource sectors. Beyond this, corporate income tax revenues are expected to retreat by 5.1 per cent in 2023-24, due to the projected slowdown in economic growth in 2023 and then grow at an average rate of 1.5 per cent per year for the remainder of the forecast horizon.
Income taxes paid by non-residents on Canadian-sourced income, notably dividends and interest payments, are expected to grow to $13.8 billion in 2022-23, or 27.9 per cent, driven by higher corporate profits. Over the remainder of the forecast horizon, growth in non-resident income tax revenues is expected to average 0.7 per cent, consistent with the expected slowdown in corporate profit growth.
Excise Tax and Duty Revenues
Goods and Services Tax (GST) revenues are projected to grow 2.2 per cent to $47.2 billion in 2022-23, in line with retail sales and partially offset by the cost of the temporary GST credit increase. Over the remainder of the projection period, GST revenues are expected to grow on average by 4.9 per cent per year, reflecting the outlook for taxable consumption with expected growth in both consumer prices and consumption volumes.
Customs import duties are projected to increase 21.4 per cent in 2022-23 driven by the repeal of remission of duties on personal protective equipment and other medical goods, and the outlook for projected imports reflecting growth in both import prices and real imports. Over the remainder of the forecast horizon, growth averages 3.6 per cent driven by projected growth in imports.
Other excise taxes and duties are expected to increase to $12.3 billion in 2022-23, or 8.6 per cent, reflecting year-to-date data particularly for cannabis and the air travel security surcharge, before normalizing to trend growth of an average annual rate of 1.7 per cent over the remainder of the forecast period. This primarily reflects the outlook for the consumption of tobacco products and alcohol products.
Other taxes include revenues from the Underused Housing Tax announced in the 2021 Economic and Fiscal Update and the Digital Services Tax. Revenues from these taxes are projected to be $0.2 billion in 2022-23 and grow to $1.0 billion by 2027-28.
Proceeds From the Pollution Pricing Framework
Growth in the proceeds from the federal pollution pricing framework will be driven primarily by the increasing carbon price.Footnote 2 Direct proceeds will continue to be fully returned in the provinces or territories where they are generated.
Employment Insurance Premium Revenues
Employment Insurance (EI) premium revenues are projected to grow at 11.7 per cent in 2022-23 due to continued strength in the labour market, with the unemployment rate expected to be near pre-pandemic rates. For the remainder of the forecast, EI premium revenues are projected to grow at an average of 4.2 per cent, reflecting steady earnings growth and increases in the premium rate according to the legislated premium-rate setting mechanism from $1.58 per $100 of insurable earnings in 2022 to $1.63 in 2023 and $1.66 in 2024 (see Box A1.1 for details of the outlook for the EI Operating Account). After an increase to $1.63, the EI premium rate will still be 10 cents lower than it was between 2008 and 2010, having reached its lowest levels in 2019, 2020, and 2021 ($1.58).
Box A1.1 Employment Insurance Operating Account
| 2021-2022 | 2022-2023 | 2023-2024 | 2024-2025 | 2025-2026 | 2026-2027 | 2027-2028 | ||||
|---|---|---|---|---|---|---|---|---|---|---|
| EI premium revenues | 23.9 | 26.6 | 28.2 | 29.6 | 30.7 | 31.7 | 32.8 | |||
| EI benefits1 | 38.9 | 24.8 | 24.3 | 25.9 | 26.5 | 27.0 | 27.7 | |||
| EI administration and other expenses2 | 2.6 | 2.6 | 2.1 | 2.0 | 2.0 | 2.0 | 2.0 | |||
| 20213 | 2022 | 2023 | 2024 | 2025 | 2026 | 2027 | 2028 | 2029 | 2030 | |
| EI Operating Account annual balance | -24.6 | -0.8 | 2.2 | 2.2 | 2.5 | 3.3 | 3.6 | 4.0 | 4.2 | 4.4 |
| EI Operating Account cumulative balance | -25.9 | -26.7 | -24.4 | -22.2 | -19.7 | -16.4 | -12.8 | -8.8 | -4.6 | -0.14 |
| Projected premium rate (per $100 of insurable earnings) | 1.58 | 1.58 | 1.63 | 1.66 | 1.66 | 1.66 | 1.66 | 1.66 | 1.66 | 1.66 |
|
1 EI benefits include regular EI benefits, sickness, maternity, parental, compassionate care, fishing and work sharing benefits, and employment benefits and support measures. EI benefits exclude EI-Emergency Response Benefit costs in line with the government's commitment to credit the EI Operating Account. 2 The remaining EI costs relate mainly to administration and are included in direct program expenses. 3 Values for 2021 are actual data. Values for 2022 and future years are a projection. 4 The EI Operating Account cumulative balance does not reach exactly zero at the end of the seven-year period as projected EI rates are rounded to the nearest whole cent per $100 of insurable earnings, in accordance with the Employment Insurance Act. |
||||||||||
The Employment Insurance (EI) Operating Account operates within the Consolidated Revenue Fund. As such, EI-related revenues and expenses that are credited and charged to the Account, respectively, in accordance with the Employment Insurance Act, are consolidated with those of the government, and impact the budgetary balance. For consistency with the EI premium rate, which is set on a calendar-year basis with the objective of having the Account break even over time, the annual and cumulative balances of the Account are also presented on a calendar-year basis.
The EI Operating Account is expected to record a small annual deficit in 2022 and is then projected to record annual surpluses due to projected increases in the premium rate starting in 2023 to $1.63 and $1.66 in 2024. The increases reflect the practice of the break-even rate-setting mechanism that started with the setting of the 2017 premium rate.
Other Revenues
Other revenues consist of three broad components: net income from enterprise Crown corporations; other program revenues from returns on investments, proceeds from the sales of goods and services, and other miscellaneous revenues; and net foreign exchange revenues.
- Enterprise Crown corporation revenues are projected to decline by $6.0 billion in 2022-23, largely reflecting Bank of Canada income losses. Beyond this, growth averages 13.4 per cent annually, as this impact recedes and the outlook of enterprise Crown corporations improves more broadly.
- Other program revenues are affected by consolidated Crown corporation revenues, interest rates, inflation, and exchange rate movements (which affect the Canadian-dollar value of foreign-denominated assets). These revenues are projected to increase by an average of 17.6 per cent in 2022-23 and 2023-24 primarily due to an increase in interest and penalty revenue on tax debt as a result of higher interest rates, additional spectrum auction revenue, and the rebound in the sales of goods and services (e.g. fees for passports and visas, VIA Rail revenue). Over the remainder of the forecast horizon, other program revenues are projected to continue to grow by 1.8 per cent.
- Net foreign exchange revenues, which consist mainly of returns on Canada's official international reserves held in the Exchange Fund Account, are volatile and sensitive to fluctuations in foreign exchange rates and foreign interest rates. Assets in the Exchange Fund Account are mainly invested in debt securities of sovereigns and their agencies, and are held to aid in the control and protection of the external value of the Canadian dollar and to provide a source of liquidity for the government, if required. These revenues are projected to increase as a result of growth in reserves over the forecast horizon, as well as higher interest rates.
Outlook for Expenses
| Projection | |||||||
|---|---|---|---|---|---|---|---|
| 2021– 2022 |
2022– 2023 |
2023– 2024 |
2024– 2025 |
2025– 2026 |
2026– 2027 |
2027– 2028 |
|
| Major transfers to persons | |||||||
| Elderly benefits | 60.8 | 69.0 | 76.6 | 81.6 | 86.6 | 91.7 | 96.6 |
| Employment Insurance benefits1 | 38.9 | 24.8 | 24.3 | 25.9 | 26.5 | 27.0 | 27.7 |
| COVID-19 Income Support for Workers2 | 15.6 | 0.2 | 0.0 | 0.0 | 0.0 | 0.0 | 0.0 |
| Canada Child Benefit3 | 26.2 | 24.9 | 26.3 | 27.7 | 28.7 | 29.4 | 30.1 |
| Total | 141.5 | 118.9 | 127.1 | 135.1 | 141.8 | 148.0 | 154.4 |
| Major transfers to other levels of government | |||||||
| Canada Health Transfer | 45.1 | 45.2 | 49.3 | 52.3 | 54.1 | 56.3 | 58.6 |
| Canada Social Transfer | 15.5 | 15.9 | 16.4 | 16.9 | 17.4 | 17.9 | 18.5 |
| Equalization | 20.9 | 21.9 | 23.9 | 25.4 | 26.3 | 27.3 | 28.4 |
| Territorial Formula Financing | 4.4 | 4.6 | 4.9 | 5.2 | 5.4 | 5.5 | 5.8 |
| Canada Community-Building Fund | 2.3 | 2.3 | 2.4 | 2.4 | 2.5 | 2.5 | 2.6 |
| Home care and mental health | 2.5 | 1.2 | 1.2 | 1.2 | 1.2 | 1.2 | 0.0 |
| Canada-wide early learning and child care4 | 2.9 | 4.5 | 5.6 | 6.6 | 7.9 | 7.9 | 7.7 |
| Other fiscal arrangements5 | -5.3 | -6.6 | -7.0 | -7.3 | -7.7 | -8.1 | -8.4 |
| Total | 88.4 | 89.0 | 96.8 | 102.7 | 107.2 | 110.6 | 113.1 |
| Proceeds from the pollution pricing framework returned | 3.8 | 7.7 | 11.1 | 11.9 | 13.5 | 15.0 | 16.3 |
| Direct program expenses | |||||||
| Canada Emergency Wage Subsidy | 22.3 | -0.1 | 0.0 | 0.0 | 0.0 | 0.0 | 0.0 |
| Other transfer payments | 88.5 | 96.0 | 86.7 | 85.8 | 84.8 | 83.0 | 83.5 |
| Operating expenses6 | 124.3 | 126.2 | 122.1 | 122.1 | 121.8 | 122.2 | 124.5 |
| Total | 235.1 | 222.1 | 208.7 | 207.9 | 206.6 | 205.3 | 208.0 |
| Total program expenses, excluding net actuarial losses | 468.8 | 437.8 | 443.8 | 457.6 | 469.1 | 479.0 | 491.9 |
| Public debt charges | 24.5 | 34.7 | 43.3 | 42.7 | 42.9 | 44.1 | 44.8 |
| Total expenses, excluding net actuarial losses | 493.3 | 472.5 | 487.1 | 500.3 | 512.0 | 523.1 | 536.7 |
| Net actuarial losses (gains) | 10.2 | 9.8 | 6.0 | 4.6 | 3.3 | 0.6 | 1.2 |
| Total expenses | 503.5 | 482.3 | 493.1 | 504.8 | 515.3 | 523.7 | 537.9 |
| Per cent of GDP | |||||||
| Major transfers to persons | 5.7 | 4.3 | 4.4 | 4.6 | 4.6 | 4.6 | 4.6 |
| Major transfers to other levels of government | 3.5 | 3.2 | 3.4 | 3.5 | 3.5 | 3.4 | 3.4 |
| Direct program expenses | 9.4 | 8.0 | 7.3 | 7.0 | 6.7 | 6.4 | 6.2 |
| Total program expenses, excluding net actuarial losses | 18.8 | 15.7 | 15.5 | 15.4 | 15.2 | 14.9 | 14.7 |
| Total expenses | 20.2 | 17.3 | 17.2 | 17.0 | 16.7 | 16.3 | 16.1 |
|
Note: Totals may not add due to rounding. 1 EI benefits include regular EI benefits, sickness, maternity, parental, compassionate care, fishing and work-sharing benefits, and employment benefits and support measures. Remaining EI costs relate mainly to administration and are part of operating expenses. 2 Includes the Canada Emergency Response Benefit, the Canada Recovery Benefit, the Canada Recovery Caregiving Benefit, the Canada Recovery Sickness Benefit, and the Canada Worker Lockdown Benefit. 3 Includes the Child Disability Benefit. 4 Canada-wide early learning and child care transfer payments to provinces and territories exclude funding for Indigenous early learning and child care, which are included in the other transfer payments line. 5 Other fiscal arrangements include the Quebec Abatement (offsetting amounts to reflect the reduction in federal tax collected for the Youth Allowances Recovery and Alternative Payments for Standing Programs); statutory subsidies; payments under the Canada-Nova Scotia Arrangement on Offshore Revenues; payments for the Transfer of Hibernia Net Profits Interest (NPI) and Incidental Net Profits Interest (INPI) Net Revenues to Newfoundland and Labrador; and potential Fiscal Stabilization payments. 6 This includes capital amortization expenses. |
|||||||
Table A1.7, above, provides an overview of the projection for program expenses by major component. As shown in the outlook, total program expenses as a share of GDP will continue to track downward, reflecting prudent and responsible fiscal management and a more normal trend in spending post-pandemic.
Program expenses consist of four main categories: major transfers to persons, major transfers to other levels of government, proceeds from the pollution pricing framework returned, and direct program expenses.
Major Transfers to Persons
Major transfers to persons consist of elderly benefits, Employment Insurance (EI) benefits, the COVID-19 income supports for workers, and the Canada Child Benefit.
Elderly benefits are projected to reach $69.0 billion in 2022-23, up 13.5 per cent. Over the forecast horizon, elderly benefits are forecast to grow by 7.0 per cent on average annually. Growth in elderly benefits is due to the increasing population of seniors and projected consumer price inflation, to which benefits are fully indexed, as well as the 10 per cent increase to Old Age Security payments for pensioners 75 and over on an ongoing basis as of July 2022, announced in Budget 2021.
EI benefits are projected to decrease to $24.8 billion in 2022-23, largely reflecting the expiry of temporary measures to facilitate access to EI, and a lower unemployment rate. EI benefits are expected to fall further to $24.3 billion by 2023-24 as a result of the projected improvement in the labour market and grow at an average of 3.3 per cent annually thereafter.
The government provided support to Canadians through the Canada Emergency Response Benefit, the Canada Recovery Benefit, the Canada Recovery Sickness Benefit, the Canada Recovery Caregiving Benefit, and the Canada Worker Lockdown Benefit. These temporary programs are now closed and expected to cost $0.2 billion in 2022-23.
Canada Child Benefit (CCB) payments are projected to decrease 4.9 per cent to $24.9 billion in 2022-23, largely reflecting the phasing out of the COVID-19 temporary supplement for families with young children. CCB payments are then expected to grow by 5.3 per cent in 2023-24 and 5.4 in 2024-25 due to higher consumer price inflation to which benefits are indexed, before moderating to an average 2.8 per cent growth over the remainder of the forecast.
Major Transfers to Other Levels of Government
Major transfers to other levels of government are expected to increase from $89.0 billion in 2022-23 to $113.1 billion in 2027-28 largely due to expected nominal GDP growth.
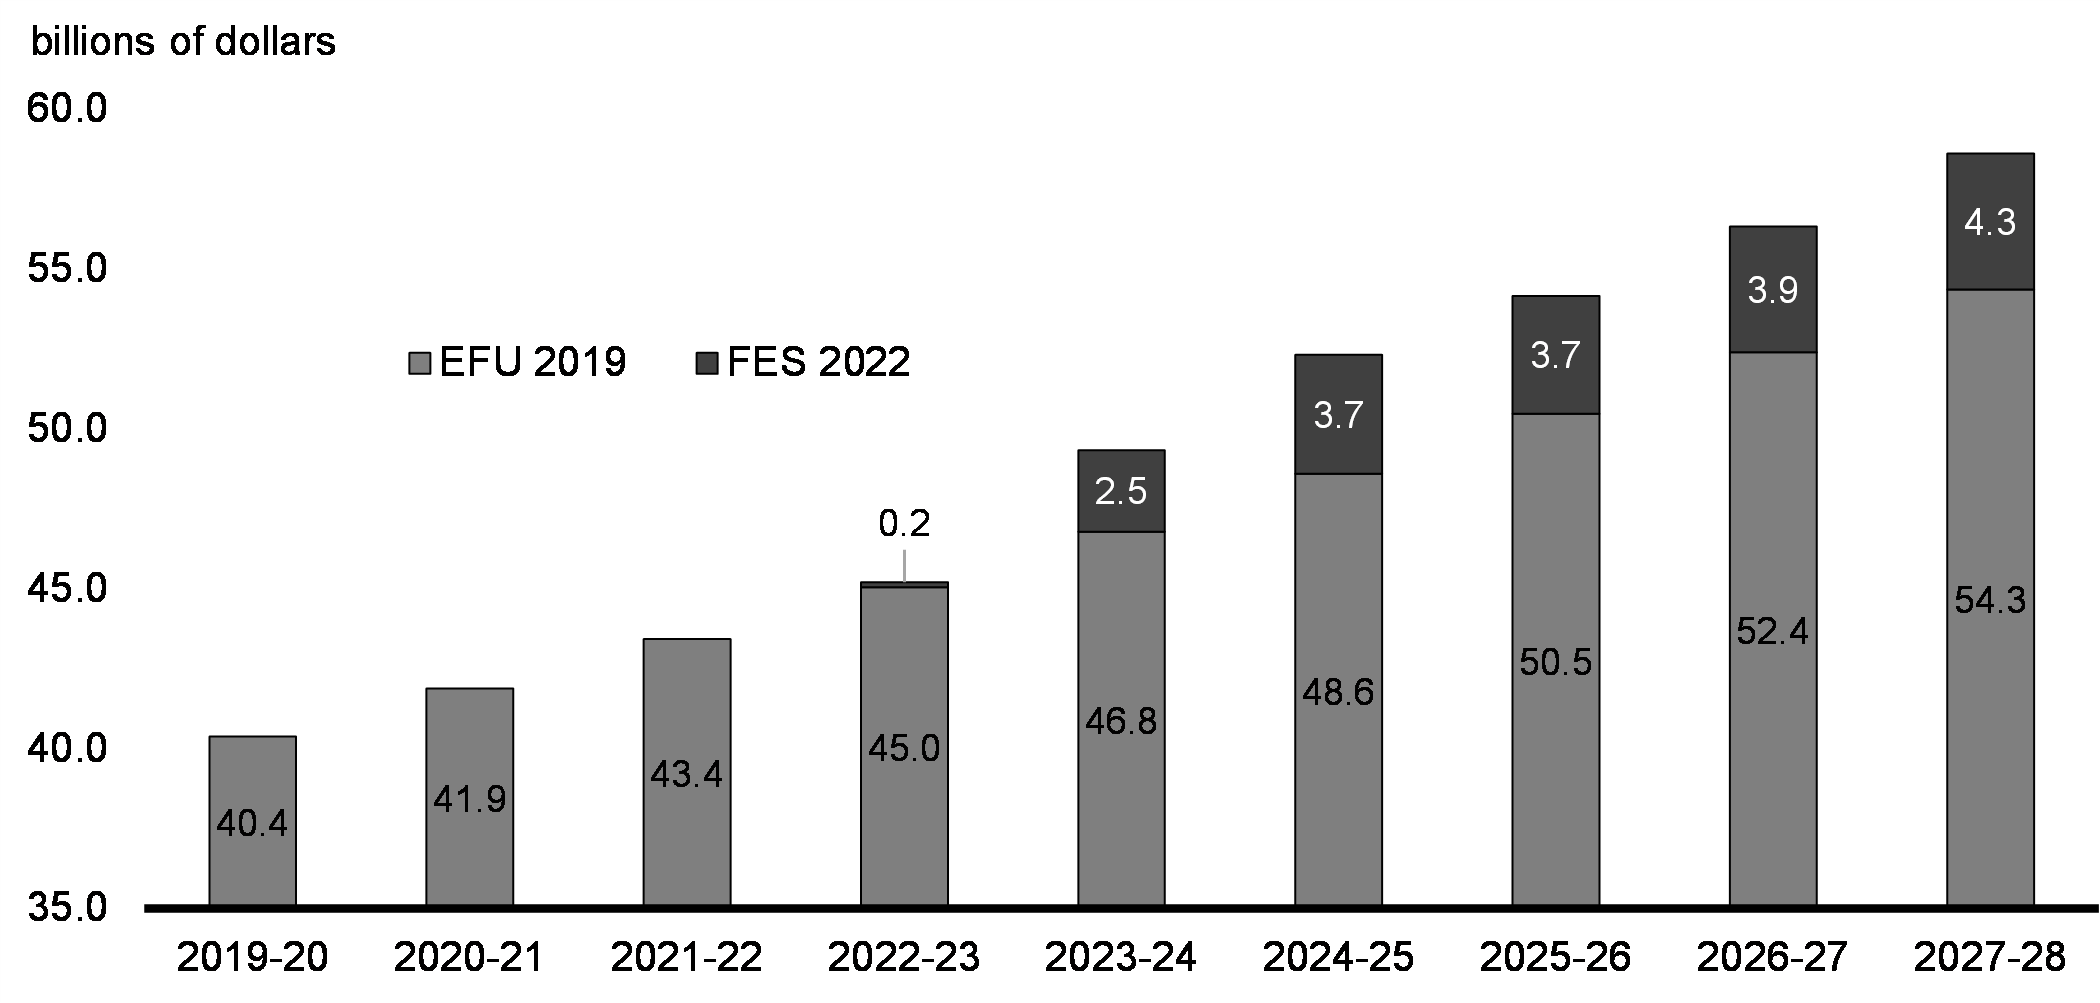
Total Canada Health Transfer support is projected to grow from $45.2 billion in 2022-23 to $58.6 billion in 2027-28, in line with a three-year moving average of nominal GDP growth, with funding guaranteed to increase by at least 3 per cent per year. In 2023-24, the Canada Health Transfer is forecast to provide $49.3 billion in support—an increase of 9.1 per cent over 2022-23. Thanks to Canada's strong economic recovery, the Canada Health Transfer will provide provinces and territories with $18.1 billion more in funding over the next five years than what was expected prior to the pandemic in the 2019 Economic and Fiscal Update (Chart A1.3).
Canada Health Transfer Forecast - Economic and Fiscal Update 2019 vs. Fall Economic Statement 2022
The Canada Social Transfer is legislated to grow at 3 per cent per year, from $15.9 billion in 2022-23 to $18.5 billion in 2027-28. Equalization is projected to increase from $21.9 billion in 2022-23 to $28.4 billion in 2027-28, in line with a three-year moving average of nominal GDP growth. Territorial Formula Financing is projected to increase from $4.6 billion in 2022-23 to $5.8 billion in 2027-28 mainly due to growth in provincial/local expenditures, which are major components of the formula. Canada Community-Building Fund payments will increase from $2.3 billion in 2022-23 to $2.6 billion in 2027-28 as they are indexed at 2 per cent per year, with increases applied in $100 million increments.
Home care and mental health transfers are stabilizing at $1.2 billion starting in 2022-23 for the remainder of the 10-year bilateral agreements between Canada and provinces and territories until 2026-27. Canada-wide early learning and child care transfer payments are expected to increase from $4.5 billion in 2022-23 to $7.7 billion in 2027-28, and include funding of $625 million over four years, beginning in 2023-24, to Employment and Social Development Canada for an Early Learning and Child Care Infrastructure Fund.
Other Fiscal Arrangements are projected to decrease from -$6.6 billion in 2022-23 to -$8.4 billion in 2027-28 primarily due to the Quebec Abatement. This reflects the increased value of tax points transferred to Quebec in the 1960s and 1970s, which resulted in a commensurate reduction in cash transfers to the province.
Proceeds From the Pollution Pricing Framework Returned
Proceeds from the pollution pricing framework returned represent the return of all direct proceeds from the federal fuel charge and Output Based Pricing System to the jurisdiction from which they were collected. Proceeds from the pollution pricing framework returned are expected to be $7.7 billion in 2022-23, increasing to $16.3 billion by 2027-28, reflecting a higher price on carbon pollution.
Direct Program Expenses
Direct program expenses consist of the Canada Emergency Wage Subsidy, other transfer payments administered by departments, and operating expenses.
Budget 2022 did not anticipate expenses from the Canada Emergency Wage Subsidy in 2022-23, but since Budget 2022 the Canada Revenue Agency has undertaken further assessments of previous returns. Anticipated repayments are expected to result in negative expenses of $0.1 billion.
Other transfer payments administered by departments are projected to increase to $96.0 billion in 2022-23 due in part to measures in the 2022 Fall Economic Statement, such as measures to help rebuild after Hurricane Fiona, financial and other aid for Ukraine, and affordability supports for housing. After 2022-23, other transfer payments are projected to decline to $83.0 billion in 2026-27 and then grow to $83.5 billion in 2027-28. The decline reflects the profile of 2022 Fall Economic Statement measures that extend partway into the horizon such as investments in the Youth Employment and Skills Strategy, and earlier measures such as the end of remaining COVID-19 related rent and wage supports including the Tourism and Hospitality Recovery Program and Local Lockdown Program.
Operating expenses reflect the cost of doing business for more than 100 government departments, agencies, and Crown corporations. Operating expenses are forecasted to reach $126.2 billion in 2022-23, including from accruals of contingent liabilities and spending related to the procurement of rapid testing kits. Operating expenses are projected to fall to $121.8 billion in 2025-26 before growing at a modest 1.1 per cent to $124.5 billion in 2027-28. Growth in operating expenses, owing to price and volume cost pressures, and wages, is tempered by a gradual decline in expenses such as the pandemic-related procurement of vaccines and personal protective equipment.
Net Actuarial Losses
Net actuarial losses, which represent changes in the measurement of the government's obligations for pensions and other employee future benefits, are expected to gradually decline over the forecast horizon, from a projected loss of $9.8 billion in 2022-23 to $1.2 billion in 2027-28, reflecting higher expected interest rates used to measure the present value of the obligations.
Public Debt Charges
Public debt charges are expected to increase to $34.7 billion in 2022-23, due to the sharp rise in short-term interest rates and the impact of higher inflation on Real Return Bonds. Public debt charges fall slightly in 2024-25 as inflation and interest rates are forecasted to subside, before growing modestly with additional borrowing requirements in 2025-26 through 2027-28. As a share of GDP, public debt charges remain very low by historical standards—they are expected to rise to 1.5 per cent in 2023-24 before declining to 1.3 per cent by 2027-28. This is still near historic lows, and well below the peak of 6.5 per cent of GDP in the 1990s and 2.1 per cent in 2007-2008 before the financial crisis.
Long-Term Debt Projections
As with any projection that extends over several decades, the long-term debt-to-GDP ratio projections presented in the 2022 Fall Economic Statement are subject to a high degree of uncertainty and are sensitive to assumptions. They should not be viewed as predictions of the future, but instead as modelling scenarios based on a set of reasonable economic and demographic assumptions, assuming no future changes in policies.
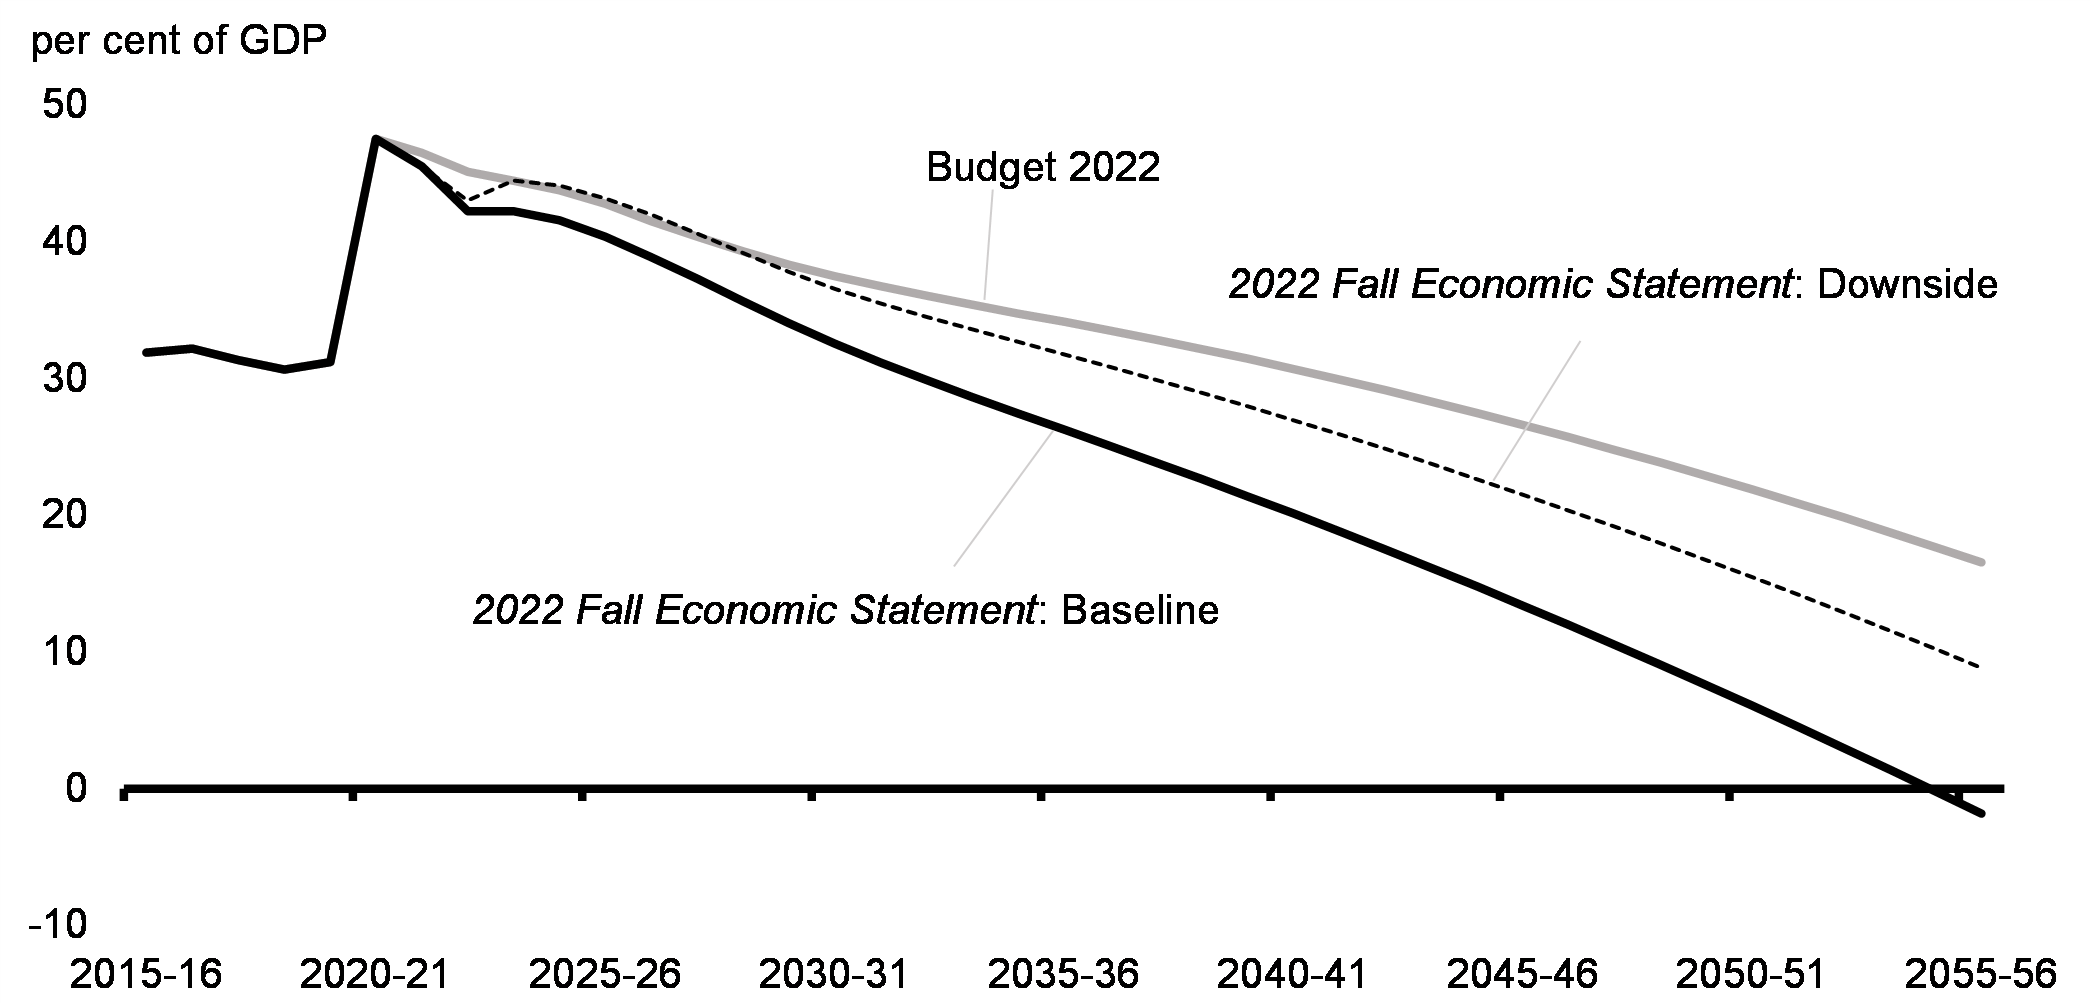
Building on the 2022 Fall Economic Statement forecasts, the long-term fiscal projections continue to indicate that federal public finances are sustainable beyond the usual forecast horizon, as demonstrated by a continuously declining debt-to-GDP ratio over the whole projection horizon under both the baseline and downside scenarios (Chart A1.4). Even in the downside scenario, the projected debt-to-GDP ratio is also on a steeper downward track than projected in Budget 2022. This is despite adverse demographic trends, assumed modest future productivity growth rates, and projected increases in interest rates. As discussed in more detail below, this conclusion is also robust to some changes in individual long-term assumptions.
Keeping the federal debt-to-GDP ratio on a downward trend over the medium and longer term will help ensure that future generations are not burdened with debt and that fiscal room remains available to face future challenges and risks that are not accounted for in this projection. These include, among others, climate change, the transition to net-zero, recessions, new pandemics, and geopolitical risk.
Long-Term Projections of the Federal Debt
To form the long-term economic projections, the medium-term (2022 to 2027) economic forecasts presented in the 2022 Fall Economic Statement are extended to 2055 using the long-term economic projection model of the Department of Finance Canada. In this model, annual real GDP growth depends on labour productivity growth (1 per cent per year), which is calibrated over its 1974-2019 historical average, and labour supply growth (average of 0.6 per cent per year), which is based on demographic projections produced by Statistics Canada and projections for the labour force participation rate and average hours worked using econometric models developed by the Department. Assuming a constant 2 per cent annual rate for GDP inflation, nominal GDP is projected to grow by an average of 3.6 per cent per year from 2028 to 2055 (Table A1.8).
| 1970–2021 | 2022–2027 | 2028–2055 | |
|---|---|---|---|
| Real GDP growth | 2.6 | 2.0 | 1.6 |
| Contributions of (percentage points): | |||
| Labour supply growth | 1.5 | 1.3 | 0.6 |
Working-age population |
1.5 | 1.4 | 0.8 |
Labour force participation |
0.2 | -0.5 | -0.2 |
Unemployment rate |
-0.1 | 0.3 | 0.0 |
Average hours worked |
-0.2 | 0.1 | 0.0 |
| Labour productivity growth | 1.1 | 0.7 | 1.0 |
| Nominal GDP growth | 6.8 | 5.1 | 3.6 |
|
Note: Contributions may not add up due to rounding. Sources: Statistics Canada; Department of Finance Canada calculations. |
|||
The long-term federal debt projections are obtained through an accounting model in which each revenue and expense category is modelled as a function of its underlying demographic and economic variables, with the relationships defined by a mix of current government policies and assumptions. The key assumptions underlying fiscal projections from 2028-29 through 2055-56 are the following:
- All tax revenues as well as direct program expenses grow broadly with nominal GDP.
- The Canada Health Transfer, Canada Social Transfer, and Equalization grow with their respective legislated escalators. The remaining federal transfers to other levels of government, depending on the transfer, grow with nominal GDP, the targeted populations and inflation, or current legislation.
- The Old Age Security program and children's benefits grow with the targeted populations and inflation. Employment Insurance (EI) benefits grow in line with the number of beneficiaries and the growth in average weekly earnings. The EI premium rate grows according to current program parameters.
- The effective interest rate on interest-bearing federal debt is assumed, under the baseline scenario, to gradually increase from about 2.6 per cent in 2027–28 to 3.5 per cent by 2055-56.
Sensitivity analysis shows that the long-term fiscal projections are robust to some changes to key assumptions (Tables A1.9 and A1.10).
| Baseline2 | High | Low | |
|---|---|---|---|
| Demographic: | |||
| Fertility rate (average births per woman) | 1.6 births | +0.5 births | -0.5 births |
| Immigration (per cent of population) | 0.9 | +0.25 p.p. | -0.25 p.p. |
| Life expectancy at 65 | 23.2 years | +3 years | -3 years |
| Economic: | |||
| Total labour force participation rate (per cent) | 61.2 | +2.0 p.p. | -2.0 p.p. |
| Average weekly hours worked (hours) | 33.2 | +1.0 hour | -1.0 hour |
| Unemployment rate (per cent) | 5.7 | +1.0 p.p. | -1.0 p.p. |
| Labour productivity (per cent) | 1.0 | +0.25 p.p. | -0.25 p.p. |
| Interest rates (per cent) | 3.2 | +1.0 p.p. | -1.0 p.p. |
|
Note: p.p. = percentage point. 1 These alternative assumptions are applied starting in 2028 except for changes in life expectancy, which are gradually applied over the projection horizon. 2 Baseline shown as the average over the period 2028 to 2055. |
|||
| Baseline | High | Low | ||||
|---|---|---|---|---|---|---|
| Budgetary Balance | Debt | Budgetary Balance | Debt | Budgetary Balance | Debt | |
| Demographic: | ||||||
| Fertility rate | 1.6 | -1.8 | 1.4 | 2.1 | 1.8 | -5.9 |
| Immigration | 1.6 | -1.8 | 2.0 | -6.5 | 1.2 | 3.7 |
| Life expectancy at 65 | 1.6 | -1.8 | 1.6 | -1.4 | 1.9 | -4.7 |
| Economic: | ||||||
| Total labour force participation rate | 1.6 | -1.8 | 1.9 | -6.4 | 1.3 | 3.2 |
| Average weekly hours worked | 1.6 | -1.8 | 1.9 | -6.0 | 1.4 | 2.7 |
| Unemployment rate | 1.6 | -1.8 | 1.5 | -0.3 | 1.7 | -3.3 |
| Labour productivity | 1.6 | -1.8 | 2.1 | -7.1 | 1.2 | 3.9 |
| Interest rates | 1.6 | -1.8 | 1.4 | 3.3 | 1.7 | -5.7 |
Supplementary Information
Policy Actions Taken Since Budget 2022
Since 2016, the government has provided a transparent overview of all policy actions taken between budgets and updates. These measures, listed in Table A1.11, ensure that Canadians are continually well served by the programs they rely on and that government operations carry on as usual.
| Dept. | 2022– 2023 |
2023– 2024 |
2024– 2025 |
2025– 2026 |
2026– 2027 |
2027– 2028 |
|||||||||||||||||||||||||||||||||||||||||||||||||||||||||||||||||||||||||||||||||||||||||||||||||||||||||||||||||||||||||
|---|---|---|---|---|---|---|---|---|---|---|---|---|---|---|---|---|---|---|---|---|---|---|---|---|---|---|---|---|---|---|---|---|---|---|---|---|---|---|---|---|---|---|---|---|---|---|---|---|---|---|---|---|---|---|---|---|---|---|---|---|---|---|---|---|---|---|---|---|---|---|---|---|---|---|---|---|---|---|---|---|---|---|---|---|---|---|---|---|---|---|---|---|---|---|---|---|---|---|---|---|---|---|---|---|---|---|---|---|---|---|---|---|---|---|---|---|---|---|---|---|---|---|---|---|---|---|---|
| Government Operations, Fairness and Openness | |||||||||||||||||||||||||||||||||||||||||||||||||||||||||||||||||||||||||||||||||||||||||||||||||||||||||||||||||||||||||||||||
| Supporting Core CER Activities | CER | 4 | 10 | 9 | 8 | 8 | 8 | ||||||||||||||||||||||||||||||||||||||||||||||||||||||||||||||||||||||||||||||||||||||||||||||||||||||||||||||||||||||||
Less: Costs to be Recovered |
-4 | -10 | -9 | -8 | -8 | -8 | |||||||||||||||||||||||||||||||||||||||||||||||||||||||||||||||||||||||||||||||||||||||||||||||||||||||||||||||||||||||||
| Alternative Worksites for Government of Canada Employees | PSPC | 5 | 6 | 7 | 0 | 0 | 0 | ||||||||||||||||||||||||||||||||||||||||||||||||||||||||||||||||||||||||||||||||||||||||||||||||||||||||||||||||||||||||
Less: Funds Sourced from Existing Departmental Resources |
-5 | -6 | -7 | 0 | 0 | 0 | |||||||||||||||||||||||||||||||||||||||||||||||||||||||||||||||||||||||||||||||||||||||||||||||||||||||||||||||||||||||||
| Government of Canada Human Resources Management | TBS | 0 | 13 | 13 | 14 | 14 | 14 | ||||||||||||||||||||||||||||||||||||||||||||||||||||||||||||||||||||||||||||||||||||||||||||||||||||||||||||||||||||||||
| Implementing Amendments to the Public Service Employment Act | PSC | 2 | 1 | 0 | 0 | 0 | 0 | ||||||||||||||||||||||||||||||||||||||||||||||||||||||||||||||||||||||||||||||||||||||||||||||||||||||||||||||||||||||||
| Strengthening the Public Service Pay System | PSPC | 10 | 0 | 0 | 0 | 0 | 0 | ||||||||||||||||||||||||||||||||||||||||||||||||||||||||||||||||||||||||||||||||||||||||||||||||||||||||||||||||||||||||
| Increasing Bilingual Capacity in the Public Service | TBS | 1 | 1 | 0 | 0 | 0 | 0 | ||||||||||||||||||||||||||||||||||||||||||||||||||||||||||||||||||||||||||||||||||||||||||||||||||||||||||||||||||||||||
| Modern and Reliable Government of Canada Information Technology Infrastructure and Services | TBS | 51 | 0 | 0 | 0 | 0 | 0 | ||||||||||||||||||||||||||||||||||||||||||||||||||||||||||||||||||||||||||||||||||||||||||||||||||||||||||||||||||||||||
| Strengthening Legislative Services | JUS | 4 | 10 | 13 | 13 | 13 | 13 | ||||||||||||||||||||||||||||||||||||||||||||||||||||||||||||||||||||||||||||||||||||||||||||||||||||||||||||||||||||||||
| Improving Responses to Offender Grievances | CSC | 1 | 1 | 1 | 1 | 1 | 1 | ||||||||||||||||||||||||||||||||||||||||||||||||||||||||||||||||||||||||||||||||||||||||||||||||||||||||||||||||||||||||
| Investing in Access to Information Services | LAC | 33 | 33 | 8 | 8 | 8 | 8 | ||||||||||||||||||||||||||||||||||||||||||||||||||||||||||||||||||||||||||||||||||||||||||||||||||||||||||||||||||||||||
| Processing Additional Requests Under the Privacy Act | IRCC, CBSA, OPC | 21 | 0 | 0 | 0 | 0 | 0 | ||||||||||||||||||||||||||||||||||||||||||||||||||||||||||||||||||||||||||||||||||||||||||||||||||||||||||||||||||||||||
| CBSA National Guard Contracts | CBSA | 37 | 47 | 47 | 49 | 49 | 50 | ||||||||||||||||||||||||||||||||||||||||||||||||||||||||||||||||||||||||||||||||||||||||||||||||||||||||||||||||||||||||
Less: Funds Sourced from Existing Departmental Resources |
-21 | -26 | -26 | -26 | -26 | -26 | |||||||||||||||||||||||||||||||||||||||||||||||||||||||||||||||||||||||||||||||||||||||||||||||||||||||||||||||||||||||||
| Supporting Aviation Security | TC, RCMP | 27 | 32 | 5 | 8 | 7 | 7 | ||||||||||||||||||||||||||||||||||||||||||||||||||||||||||||||||||||||||||||||||||||||||||||||||||||||||||||||||||||||||
| Supporting RCMP Disability Insurance Plan and Supplemental Health Benefits | TBS, RCMP | 577 | 135 | 156 | 182 | 206 | 206 | ||||||||||||||||||||||||||||||||||||||||||||||||||||||||||||||||||||||||||||||||||||||||||||||||||||||||||||||||||||||||
Less: Funds Previously Provisioned in the Fiscal Framework |
-547 | -85 | -95 | -110 | -121 | -121 | |||||||||||||||||||||||||||||||||||||||||||||||||||||||||||||||||||||||||||||||||||||||||||||||||||||||||||||||||||||||||
Less: Projected Revenues |
-1 | -5 | -9 | -13 | -18 | -18 | |||||||||||||||||||||||||||||||||||||||||||||||||||||||||||||||||||||||||||||||||||||||||||||||||||||||||||||||||||||||||
| Supporting the Public Order Emergency Commission1 | PCO | 20 | 5 | 0 | 0 | 0 | 0 | ||||||||||||||||||||||||||||||||||||||||||||||||||||||||||||||||||||||||||||||||||||||||||||||||||||||||||||||||||||||||
| Ensuring the Safety of Air Travel | CATSA | 330 | 0 | 0 | 0 | 0 | 0 | ||||||||||||||||||||||||||||||||||||||||||||||||||||||||||||||||||||||||||||||||||||||||||||||||||||||||||||||||||||||||
| Temporary Lodgings for Asylum Seekers in Need of Shelter | IRCC | 135 | 0 | 0 | 0 | 0 | 0 | ||||||||||||||||||||||||||||||||||||||||||||||||||||||||||||||||||||||||||||||||||||||||||||||||||||||||||||||||||||||||
| Supporting Old Age Security and Employment Insurance Operations | ESDC | 78 | 106 | 120 | 122 | 92 | 18 | ||||||||||||||||||||||||||||||||||||||||||||||||||||||||||||||||||||||||||||||||||||||||||||||||||||||||||||||||||||||||
Less: Funds From CPP Account |
-8 | -8 | -9 | -9 | -6 | -1 | |||||||||||||||||||||||||||||||||||||||||||||||||||||||||||||||||||||||||||||||||||||||||||||||||||||||||||||||||||||||||
| Enhancements to the Security, Corporate Services and Information Technology Systems of the Supreme Court | SCC | 5 | 6 | 6 | 6 | 7 | 7 | ||||||||||||||||||||||||||||||||||||||||||||||||||||||||||||||||||||||||||||||||||||||||||||||||||||||||||||||||||||||||
| Expanding National Court Facilities | CAS | 2 | 4 | 10 | 16 | 20 | 37 | ||||||||||||||||||||||||||||||||||||||||||||||||||||||||||||||||||||||||||||||||||||||||||||||||||||||||||||||||||||||||
Less: Funds Previously Provisioned in the Fiscal Framework |
0 | 0 | 0 | -1 | -1 | -1 | |||||||||||||||||||||||||||||||||||||||||||||||||||||||||||||||||||||||||||||||||||||||||||||||||||||||||||||||||||||||||
| Funding for CFIA to Meet Post-Pandemic Operational Requirements | CFIA | 19 | 24 | 19 | 0 | 0 | 0 | ||||||||||||||||||||||||||||||||||||||||||||||||||||||||||||||||||||||||||||||||||||||||||||||||||||||||||||||||||||||||
| Regulating Animal Imports | CFIA | 3 | 5 | 6 | 6 | 0 | 0 | ||||||||||||||||||||||||||||||||||||||||||||||||||||||||||||||||||||||||||||||||||||||||||||||||||||||||||||||||||||||||
| Government Postage and Banking Costs | PSPC | 9 | 20 | 18 | 18 | 18 | 18 | ||||||||||||||||||||||||||||||||||||||||||||||||||||||||||||||||||||||||||||||||||||||||||||||||||||||||||||||||||||||||
| Labour Markets, Health, Safety and Culture | |||||||||||||||||||||||||||||||||||||||||||||||||||||||||||||||||||||||||||||||||||||||||||||||||||||||||||||||||||||||||||||||
| CSC Network and Facilities Upgrades | CSC | 13 | 14 | 18 | 24 | 33 | 40 | ||||||||||||||||||||||||||||||||||||||||||||||||||||||||||||||||||||||||||||||||||||||||||||||||||||||||||||||||||||||||
Less: Funds Sourced from Existing Departmental Resources |
0 | 0 | 0 | -1 | -1 | -2 | |||||||||||||||||||||||||||||||||||||||||||||||||||||||||||||||||||||||||||||||||||||||||||||||||||||||||||||||||||||||||
| Independent Review Body for the RCMP and CBSA1 | CRCC, CBSA | 18 | 17 | 19 | 19 | 19 | 19 | ||||||||||||||||||||||||||||||||||||||||||||||||||||||||||||||||||||||||||||||||||||||||||||||||||||||||||||||||||||||||
Less: Funds Previously Provisioned in the Fiscal Framework |
-6 | -7 | -7 | -7 | -7 | -7 | |||||||||||||||||||||||||||||||||||||||||||||||||||||||||||||||||||||||||||||||||||||||||||||||||||||||||||||||||||||||||
| Support for the CRCC | CRCC | 7 | 5 | 5 | 5 | 5 | 5 | ||||||||||||||||||||||||||||||||||||||||||||||||||||||||||||||||||||||||||||||||||||||||||||||||||||||||||||||||||||||||
| Support to Rebuild the Village of Lytton1 | INFC, PacifiCan | 10 | 26 | 19 | 19 | 3 | 0 | ||||||||||||||||||||||||||||||||||||||||||||||||||||||||||||||||||||||||||||||||||||||||||||||||||||||||||||||||||||||||
Less: Funds Sourced from Existing Departmental Resources |
-3 | -25 | -19 | -19 | -3 | 0 | |||||||||||||||||||||||||||||||||||||||||||||||||||||||||||||||||||||||||||||||||||||||||||||||||||||||||||||||||||||||||
| Enhancing Emergency Management Capacity to Prepare for and Respond to Natural Disasters | PS | 7 | 7 | 7 | 7 | 7 | 7 | ||||||||||||||||||||||||||||||||||||||||||||||||||||||||||||||||||||||||||||||||||||||||||||||||||||||||||||||||||||||||
| Renewing Programs to Support Canada's Public Safety and Supporting the Parole Board | PS, PBC | 33 | 16 | 16 | 16 | 16 | 14 | ||||||||||||||||||||||||||||||||||||||||||||||||||||||||||||||||||||||||||||||||||||||||||||||||||||||||||||||||||||||||
Less: Projected Revenues |
-1 | -1 | -1 | -1 | -1 | -1 | |||||||||||||||||||||||||||||||||||||||||||||||||||||||||||||||||||||||||||||||||||||||||||||||||||||||||||||||||||||||||
| Combatting Firearms Crime1 | PS, RCMP | 17 | 23 | 22 | 18 | 18 | 14 | ||||||||||||||||||||||||||||||||||||||||||||||||||||||||||||||||||||||||||||||||||||||||||||||||||||||||||||||||||||||||
Less: Funds Previously Provisioned in the Fiscal Framework |
-22 | -20 | -20 | -17 | -13 | -13 | |||||||||||||||||||||||||||||||||||||||||||||||||||||||||||||||||||||||||||||||||||||||||||||||||||||||||||||||||||||||||
| Food Security in the North | CIRNAC | 20 | 0 | 0 | 0 | 0 | 0 | ||||||||||||||||||||||||||||||||||||||||||||||||||||||||||||||||||||||||||||||||||||||||||||||||||||||||||||||||||||||||
| COVID-19 Border Testing Operations (reallocation of funding from 2021-22) | PHAC | 400 | 0 | 0 | 0 | 0 | 0 | ||||||||||||||||||||||||||||||||||||||||||||||||||||||||||||||||||||||||||||||||||||||||||||||||||||||||||||||||||||||||
| COVID-19 Procurement | PSPC | 6 | 0 | 0 | 0 | 0 | 0 | ||||||||||||||||||||||||||||||||||||||||||||||||||||||||||||||||||||||||||||||||||||||||||||||||||||||||||||||||||||||||
| Drug and Medical Device Regulation | HC | 17 | 0 | 0 | 0 | 0 | 0 | ||||||||||||||||||||||||||||||||||||||||||||||||||||||||||||||||||||||||||||||||||||||||||||||||||||||||||||||||||||||||
| Front-of-Package Labelling Requirements | CFIA | 1 | 1 | 1 | 2 | 1 | 1 | ||||||||||||||||||||||||||||||||||||||||||||||||||||||||||||||||||||||||||||||||||||||||||||||||||||||||||||||||||||||||
| Regulating Cannabis | HC, PHAC, RCMP, PS, CBSA | 164 | 167 | 165 | 0 | 0 | 0 | ||||||||||||||||||||||||||||||||||||||||||||||||||||||||||||||||||||||||||||||||||||||||||||||||||||||||||||||||||||||||
Less: Costs to be Recovered |
-85 | -93 | -100 | 0 | 0 | 0 | |||||||||||||||||||||||||||||||||||||||||||||||||||||||||||||||||||||||||||||||||||||||||||||||||||||||||||||||||||||||||
Less: Funds Sourced from Existing Departmental Resources |
-2 | -2 | -2 | 0 | 0 | 0 | |||||||||||||||||||||||||||||||||||||||||||||||||||||||||||||||||||||||||||||||||||||||||||||||||||||||||||||||||||||||||
| Responding to Monkeypox Outbreaks in Canada | PHAC, CIHR | 113 | 309 | 0 | 0 | 0 | 0 | ||||||||||||||||||||||||||||||||||||||||||||||||||||||||||||||||||||||||||||||||||||||||||||||||||||||||||||||||||||||||
| Strengthening Nuclear Emergency Preparedness | HC | 3 | 3 | 3 | 3 | 3 | 3 | ||||||||||||||||||||||||||||||||||||||||||||||||||||||||||||||||||||||||||||||||||||||||||||||||||||||||||||||||||||||||
| Commemorating the Achievements and Sacrifices of Canadian Veterans1 | VAC | 3 | 5 | 11 | 2 | 2 | 0 | ||||||||||||||||||||||||||||||||||||||||||||||||||||||||||||||||||||||||||||||||||||||||||||||||||||||||||||||||||||||||
| Improving Service Delivery at the Veterans Review and Appeal Board | VRAB | 4 | 5 | 0 | 0 | 0 | 0 | ||||||||||||||||||||||||||||||||||||||||||||||||||||||||||||||||||||||||||||||||||||||||||||||||||||||||||||||||||||||||
| Maintaining the Memorial Grant Program for First Responders | PS | 43 | 35 | 35 | 0 | 0 | 0 | ||||||||||||||||||||||||||||||||||||||||||||||||||||||||||||||||||||||||||||||||||||||||||||||||||||||||||||||||||||||||
| Modernizing RCMP Networks | RCMP | 6 | 15 | 19 | 22 | 27 | 26 | ||||||||||||||||||||||||||||||||||||||||||||||||||||||||||||||||||||||||||||||||||||||||||||||||||||||||||||||||||||||||
| Renewing the Digital Citizen Initiative | PCH | 4 | 13 | 13 | 1 | 0 | 0 | ||||||||||||||||||||||||||||||||||||||||||||||||||||||||||||||||||||||||||||||||||||||||||||||||||||||||||||||||||||||||
| Implementing 10 Days of Paid Sick Leave in Federally Regulated Sectors | ESDC | 4 | 3 | 2 | 0 | 0 | 0 | ||||||||||||||||||||||||||||||||||||||||||||||||||||||||||||||||||||||||||||||||||||||||||||||||||||||||||||||||||||||||
| Support Operational Requirements and Offset Revenue Losses Related to the Ongoing Impact of the COVID-19 Pandemic for: | |||||||||||||||||||||||||||||||||||||||||||||||||||||||||||||||||||||||||||||||||||||||||||||||||||||||||||||||||||||||||||||||
National Museums and the National Battlefields Commission2 |
- | 31 | 4 | 4 | 0 | 0 | 0 | ||||||||||||||||||||||||||||||||||||||||||||||||||||||||||||||||||||||||||||||||||||||||||||||||||||||||||||||||||||||||
CBC/Radio-Canada |
CBC | 21 | 21 | 0 | 0 | 0 | 0 | ||||||||||||||||||||||||||||||||||||||||||||||||||||||||||||||||||||||||||||||||||||||||||||||||||||||||||||||||||||||||
National Arts Centre |
PCH | 16 | 0 | 0 | 0 | 0 | 0 | ||||||||||||||||||||||||||||||||||||||||||||||||||||||||||||||||||||||||||||||||||||||||||||||||||||||||||||||||||||||||
National Film Board |
PCH | 5 | 0 | 0 | 0 | 0 | 0 | ||||||||||||||||||||||||||||||||||||||||||||||||||||||||||||||||||||||||||||||||||||||||||||||||||||||||||||||||||||||||
| Donation to the Queen Elizabeth II Scholars Program1 | PCH | 20 | 0 | 0 | 0 | 0 | 0 | ||||||||||||||||||||||||||||||||||||||||||||||||||||||||||||||||||||||||||||||||||||||||||||||||||||||||||||||||||||||||
| Supporting Adult Basic Education in the North | CanNor | 5 | 0 | 0 | 0 | 0 | 0 | ||||||||||||||||||||||||||||||||||||||||||||||||||||||||||||||||||||||||||||||||||||||||||||||||||||||||||||||||||||||||
| Afterschool Supports and Addressing Barriers to Education | ESDC | 0 | 38 | 20 | 0 | 0 | 0 | ||||||||||||||||||||||||||||||||||||||||||||||||||||||||||||||||||||||||||||||||||||||||||||||||||||||||||||||||||||||||
Less: Funds Sourced from Existing Departmental Resources |
0 | -10 | 0 | 0 | 0 | 0 | |||||||||||||||||||||||||||||||||||||||||||||||||||||||||||||||||||||||||||||||||||||||||||||||||||||||||||||||||||||||||
| Equity, Diversity and Inclusion in Sport1 | PCH | 5 | 10 | 10 | 0 | 0 | 0 | ||||||||||||||||||||||||||||||||||||||||||||||||||||||||||||||||||||||||||||||||||||||||||||||||||||||||||||||||||||||||
| Supporting the Canadian Race Relations Foundation | CRRF | 0 | 9 | 9 | 0 | 0 | 0 | ||||||||||||||||||||||||||||||||||||||||||||||||||||||||||||||||||||||||||||||||||||||||||||||||||||||||||||||||||||||||
| Growth, Innovation, and Infrastructure | |||||||||||||||||||||||||||||||||||||||||||||||||||||||||||||||||||||||||||||||||||||||||||||||||||||||||||||||||||||||||||||||
| Further Support to Improve Access to Broadband Internet | ISED | 0 | 81 | 215 | 113 | 66 | 0 | ||||||||||||||||||||||||||||||||||||||||||||||||||||||||||||||||||||||||||||||||||||||||||||||||||||||||||||||||||||||||
| Extending Support for Regulatory Modernization1 | TBS | 1 | 6 | 5 | 0 | 0 | 0 | ||||||||||||||||||||||||||||||||||||||||||||||||||||||||||||||||||||||||||||||||||||||||||||||||||||||||||||||||||||||||
| Funding to Support Regional Economic Development Programming and Mandates: | |||||||||||||||||||||||||||||||||||||||||||||||||||||||||||||||||||||||||||||||||||||||||||||||||||||||||||||||||||||||||||||||
FedNor Operations |
FedNor | 5 | 6 | 6 | 6 | 6 | 6 | ||||||||||||||||||||||||||||||||||||||||||||||||||||||||||||||||||||||||||||||||||||||||||||||||||||||||||||||||||||||||
FedDev Operations |
FedDev | 1 | 1 | 1 | 0 | 0 | 0 | ||||||||||||||||||||||||||||||||||||||||||||||||||||||||||||||||||||||||||||||||||||||||||||||||||||||||||||||||||||||||
Northern Ontario Development Program |
FedNor | 5 | 5 | 0 | 0 | 0 | 0 | ||||||||||||||||||||||||||||||||||||||||||||||||||||||||||||||||||||||||||||||||||||||||||||||||||||||||||||||||||||||||
Support for Western Canada |
PacifiCan, PrairiesCan | 19 | 0 | 0 | 0 | 0 | 0 | ||||||||||||||||||||||||||||||||||||||||||||||||||||||||||||||||||||||||||||||||||||||||||||||||||||||||||||||||||||||||
| Further Support for the Wine Sector1 | AAFC | 83 | 83 | 0 | 0 | 0 | 0 | ||||||||||||||||||||||||||||||||||||||||||||||||||||||||||||||||||||||||||||||||||||||||||||||||||||||||||||||||||||||||
Less: Funds Previously Provisioned in the Fiscal Framework |
-50 | -51 | 0 | 0 | 0 | 0 | |||||||||||||||||||||||||||||||||||||||||||||||||||||||||||||||||||||||||||||||||||||||||||||||||||||||||||||||||||||||||
| Innovative Solutions Canada Program Renewal | ISED | 8 | 121 | 121 | 121 | 121 | 121 | ||||||||||||||||||||||||||||||||||||||||||||||||||||||||||||||||||||||||||||||||||||||||||||||||||||||||||||||||||||||||
Less: Funds Sourced from Existing Departmental Resources |
0 | -114 | -114 | -114 | -114 | -114 | |||||||||||||||||||||||||||||||||||||||||||||||||||||||||||||||||||||||||||||||||||||||||||||||||||||||||||||||||||||||||
| Extending NRCC Pandemic Technology Programs (reallocation of funding from 2021-22) | NRCC | 31 | 28 | 0 | 0 | 0 | 0 | ||||||||||||||||||||||||||||||||||||||||||||||||||||||||||||||||||||||||||||||||||||||||||||||||||||||||||||||||||||||||
| Interest Relief for Agriculture Producers1 | AAFC | 30 | 35 | 0 | 0 | 0 | 0 | ||||||||||||||||||||||||||||||||||||||||||||||||||||||||||||||||||||||||||||||||||||||||||||||||||||||||||||||||||||||||
| Investing in VIA Rail Trains and Infrastructure | TC | 0 | 2 | 8 | 14 | 14 | 14 | ||||||||||||||||||||||||||||||||||||||||||||||||||||||||||||||||||||||||||||||||||||||||||||||||||||||||||||||||||||||||
| Protecting Heritage Assets and Supporting Interprovincial Transit in the National Capital Region | NCC | 6 | 8 | 10 | 12 | 16 | 17 | ||||||||||||||||||||||||||||||||||||||||||||||||||||||||||||||||||||||||||||||||||||||||||||||||||||||||||||||||||||||||
Reallocation of funding from 2020-21 |
1 | 2 | 2 | 1 | 0 | 0 | |||||||||||||||||||||||||||||||||||||||||||||||||||||||||||||||||||||||||||||||||||||||||||||||||||||||||||||||||||||||||
| Support for Marine Atlantic Inc.1 | TC | 216 | 247 | 239 | 25 | 25 | 25 | ||||||||||||||||||||||||||||||||||||||||||||||||||||||||||||||||||||||||||||||||||||||||||||||||||||||||||||||||||||||||
Less: Funds Previously Provisioned in the Fiscal Framework |
-25 | -48 | -41 | -21 | -21 | -21 | |||||||||||||||||||||||||||||||||||||||||||||||||||||||||||||||||||||||||||||||||||||||||||||||||||||||||||||||||||||||||
Less: Projected Revenues |
-113 | -111 | -114 | 0 | 0 | 0 | |||||||||||||||||||||||||||||||||||||||||||||||||||||||||||||||||||||||||||||||||||||||||||||||||||||||||||||||||||||||||
| Support for the Federal Bridge Corporation Limited1 | TC | 1 | 2 | 1 | 1 | 1 | 1 | ||||||||||||||||||||||||||||||||||||||||||||||||||||||||||||||||||||||||||||||||||||||||||||||||||||||||||||||||||||||||
| Supporting Advanced Vehicle and Air Transportation Technology | TC | 31 | 0 | 0 | 0 | 0 | 0 | ||||||||||||||||||||||||||||||||||||||||||||||||||||||||||||||||||||||||||||||||||||||||||||||||||||||||||||||||||||||||
Less: Funds Sourced from Existing Departmental Resources |
-1 | 0 | 0 | 0 | 0 | 0 | |||||||||||||||||||||||||||||||||||||||||||||||||||||||||||||||||||||||||||||||||||||||||||||||||||||||||||||||||||||||||
| Supporting Digital Skills, Literacy and Connectivity1 | ISED | 3 | 13 | 8 | 0 | 0 | 0 | ||||||||||||||||||||||||||||||||||||||||||||||||||||||||||||||||||||||||||||||||||||||||||||||||||||||||||||||||||||||||
| Enhancing African Swine Fever Prevention and Preparedness | AAFC | 18 | 21 | 7 | 0 | 0 | 0 | ||||||||||||||||||||||||||||||||||||||||||||||||||||||||||||||||||||||||||||||||||||||||||||||||||||||||||||||||||||||||
Less: Funds Sourced from Existing Departmental Resources |
-4 | 0 | 0 | 0 | 0 | 0 | |||||||||||||||||||||||||||||||||||||||||||||||||||||||||||||||||||||||||||||||||||||||||||||||||||||||||||||||||||||||||
| Maintaining Canada's Regional and Remote Airports | TC | 0 | 0 | 0 | 4 | 8 | 8 | ||||||||||||||||||||||||||||||||||||||||||||||||||||||||||||||||||||||||||||||||||||||||||||||||||||||||||||||||||||||||
| Rebuilding the Fishers' Wharf at the Port of Cap-aux-Meules1 | TC | 0 | 0 | 0 | 2 | 2 | 2 | ||||||||||||||||||||||||||||||||||||||||||||||||||||||||||||||||||||||||||||||||||||||||||||||||||||||||||||||||||||||||
| Funding for the Atmospheric Science Mission1 | CSA | 0 | 17 | 2 | 2 | 2 | 2 | ||||||||||||||||||||||||||||||||||||||||||||||||||||||||||||||||||||||||||||||||||||||||||||||||||||||||||||||||||||||||
| Renewing Funding for the Business and Higher Education Roundtable1 | ISED | 6 | 6 | 6 | 0 | 0 | 0 | ||||||||||||||||||||||||||||||||||||||||||||||||||||||||||||||||||||||||||||||||||||||||||||||||||||||||||||||||||||||||
| Clean Growth and Protecting Canada's Environment | |||||||||||||||||||||||||||||||||||||||||||||||||||||||||||||||||||||||||||||||||||||||||||||||||||||||||||||||||||||||||||||||
| Canadian Climate Institute | ECCC | 5 | 6 | 6 | 6 | 6 | 6 | ||||||||||||||||||||||||||||||||||||||||||||||||||||||||||||||||||||||||||||||||||||||||||||||||||||||||||||||||||||||||
Less: Funds Sourced from Existing Departmental Resources |
-5 | -3 | 0 | 0 | 0 | 0 | |||||||||||||||||||||||||||||||||||||||||||||||||||||||||||||||||||||||||||||||||||||||||||||||||||||||||||||||||||||||||
| Climate Communications, Public Education and Advertising | ECCC | 8 | 10 | 0 | 0 | 0 | 0 | ||||||||||||||||||||||||||||||||||||||||||||||||||||||||||||||||||||||||||||||||||||||||||||||||||||||||||||||||||||||||
| Energy Innovation Program | NRCan | 17 | 62 | 63 | 63 | 63 | 63 | ||||||||||||||||||||||||||||||||||||||||||||||||||||||||||||||||||||||||||||||||||||||||||||||||||||||||||||||||||||||||
| Expansion of the Aquatic Invasive Species Program | DFO | 2 | 7 | 9 | 9 | 10 | 0 | ||||||||||||||||||||||||||||||||||||||||||||||||||||||||||||||||||||||||||||||||||||||||||||||||||||||||||||||||||||||||
| High Performance Computing Capacity for Hydro-Meteorological Services | ECCC, SSC | 3 | 13 | 25 | 60 | 60 | 51 | ||||||||||||||||||||||||||||||||||||||||||||||||||||||||||||||||||||||||||||||||||||||||||||||||||||||||||||||||||||||||
| Nuclear Environmental Remediation | AECL | 3 | 3 | 3 | 3 | 0 | 0 | ||||||||||||||||||||||||||||||||||||||||||||||||||||||||||||||||||||||||||||||||||||||||||||||||||||||||||||||||||||||||
| Administration of Carbon Pollution Pricing and Clean Fuel Regulations | ECCC | 27 | 36 | 35 | 34 | 34 | 33 | ||||||||||||||||||||||||||||||||||||||||||||||||||||||||||||||||||||||||||||||||||||||||||||||||||||||||||||||||||||||||
| Spruce Budworm Early Intervention Strategy - Phase 3 | NRCan | 13 | 15 | 18 | 16 | 0 | 0 | ||||||||||||||||||||||||||||||||||||||||||||||||||||||||||||||||||||||||||||||||||||||||||||||||||||||||||||||||||||||||
Less: Funds Sourced from Existing Departmental Resources |
-1 | -1 | -1 | -1 | 0 | 0 | |||||||||||||||||||||||||||||||||||||||||||||||||||||||||||||||||||||||||||||||||||||||||||||||||||||||||||||||||||||||||
| Supporting Canada's Fisheries Monitoring | DFO | 4 | 6 | 6 | 6 | 6 | 5 | ||||||||||||||||||||||||||||||||||||||||||||||||||||||||||||||||||||||||||||||||||||||||||||||||||||||||||||||||||||||||
| Supporting Capital Assets in Canada's National Parks, Conservation Areas, and Historic Sites | PCA | 17 | 78 | 48 | 15 | 15 | 16 | ||||||||||||||||||||||||||||||||||||||||||||||||||||||||||||||||||||||||||||||||||||||||||||||||||||||||||||||||||||||||
| NRCan's Climate Change Adaptation Program | NRCan | 5 | 9 | 9 | 9 | 9 | 0 | ||||||||||||||||||||||||||||||||||||||||||||||||||||||||||||||||||||||||||||||||||||||||||||||||||||||||||||||||||||||||
| Support for the Pacific Environment Centre | ECCC | 19 | 19 | 19 | 19 | 19 | 19 | ||||||||||||||||||||||||||||||||||||||||||||||||||||||||||||||||||||||||||||||||||||||||||||||||||||||||||||||||||||||||
Less: Funds Sourced from Existing Departmental Resources |
-14 | -14 | -14 | -14 | -14 | -14 | |||||||||||||||||||||||||||||||||||||||||||||||||||||||||||||||||||||||||||||||||||||||||||||||||||||||||||||||||||||||||
| Hosting Part 2 of the 15th Meeting of the Conference of the Parties (COP15) to the United Nations Convention on Biological Diversity | ECCC | 47 | 0 | 0 | 0 | 0 | 0 | ||||||||||||||||||||||||||||||||||||||||||||||||||||||||||||||||||||||||||||||||||||||||||||||||||||||||||||||||||||||||
Less: Funds Sourced from Existing Departmental Resources |
-10 | 0 | 0 | 0 | 0 | 0 | |||||||||||||||||||||||||||||||||||||||||||||||||||||||||||||||||||||||||||||||||||||||||||||||||||||||||||||||||||||||||
| Advancing Reconciliation with Indigenous Peoples | |||||||||||||||||||||||||||||||||||||||||||||||||||||||||||||||||||||||||||||||||||||||||||||||||||||||||||||||||||||||||||||||
| On-Reserve Income Assistance | ISC | 30 | 309 | 0 | 0 | 0 | 0 | ||||||||||||||||||||||||||||||||||||||||||||||||||||||||||||||||||||||||||||||||||||||||||||||||||||||||||||||||||||||||
| Family Violence Prevention Program | ISC | 19 | 19 | 6 | 6 | 6 | 6 | ||||||||||||||||||||||||||||||||||||||||||||||||||||||||||||||||||||||||||||||||||||||||||||||||||||||||||||||||||||||||
| Sports Programming for Indigenous Youth | PCH | 4 | 4 | 4 | 4 | 4 | 0 | ||||||||||||||||||||||||||||||||||||||||||||||||||||||||||||||||||||||||||||||||||||||||||||||||||||||||||||||||||||||||
| Indigenous Youth – Program Renewal and Establishing a National Network | CIRNAC | 6 | 6 | 0 | 0 | 0 | 0 | ||||||||||||||||||||||||||||||||||||||||||||||||||||||||||||||||||||||||||||||||||||||||||||||||||||||||||||||||||||||||
| Urban Programming for Indigenous Peoples | ISC | 34 | 34 | 34 | 0 | 0 | 0 | ||||||||||||||||||||||||||||||||||||||||||||||||||||||||||||||||||||||||||||||||||||||||||||||||||||||||||||||||||||||||
| Enhancements to the First Nations Fiscal Management Act | CIRNAC, ISC | 17 | 20 | 17 | 11 | 11 | 0 | ||||||||||||||||||||||||||||||||||||||||||||||||||||||||||||||||||||||||||||||||||||||||||||||||||||||||||||||||||||||||
| First Nations Emergency Management | ISC, CIRNAC | 117 | 117 | 117 | 0 | 0 | 0 | ||||||||||||||||||||||||||||||||||||||||||||||||||||||||||||||||||||||||||||||||||||||||||||||||||||||||||||||||||||||||
| Improving Indian Act Registration Services | ISC | 4 | 11 | 0 | 0 | 0 | 0 | ||||||||||||||||||||||||||||||||||||||||||||||||||||||||||||||||||||||||||||||||||||||||||||||||||||||||||||||||||||||||
| Improving Long-Term and Continuing Care in Indigenous Communities | ISC | 58 | 62 | 63 | 0 | 0 | 0 | ||||||||||||||||||||||||||||||||||||||||||||||||||||||||||||||||||||||||||||||||||||||||||||||||||||||||||||||||||||||||
| Indigenous Community Corrections Initiative | PS | 1 | 8 | 15 | 15 | 15 | 15 | ||||||||||||||||||||||||||||||||||||||||||||||||||||||||||||||||||||||||||||||||||||||||||||||||||||||||||||||||||||||||
| Papal Visit to Canada – Supporting Indigenous Participation | ISC, CIRNAC | 48 | 0 | 0 | 0 | 0 | 0 | ||||||||||||||||||||||||||||||||||||||||||||||||||||||||||||||||||||||||||||||||||||||||||||||||||||||||||||||||||||||||
| Strengthening Governance and Advancing the New Fiscal Relationship with First Nations | ISC | 45 | 45 | 0 | 0 | 0 | 0 | ||||||||||||||||||||||||||||||||||||||||||||||||||||||||||||||||||||||||||||||||||||||||||||||||||||||||||||||||||||||||
| Supporting Internal Services at CIRNA | CIRNAC | 20 | 21 | 22 | 23 | 23 | 23 | ||||||||||||||||||||||||||||||||||||||||||||||||||||||||||||||||||||||||||||||||||||||||||||||||||||||||||||||||||||||||
| Supporting Recognition of Indigenous Rights and Self-Determination Discussions1 | CIRNAC | 50 | 50 | 0 | 0 | 0 | 0 | ||||||||||||||||||||||||||||||||||||||||||||||||||||||||||||||||||||||||||||||||||||||||||||||||||||||||||||||||||||||||
| An Act respecting First Nations, Inuit and Métis Children, Youth and Families3 | ISC | 273 | 431 | 233 | 206 | 218 | 230 | ||||||||||||||||||||||||||||||||||||||||||||||||||||||||||||||||||||||||||||||||||||||||||||||||||||||||||||||||||||||||
| First Nations Child and Family Services and Jordan's Principle4 | ISC | 90 | 144 | 147 | 147 | 147 | 1,026 | ||||||||||||||||||||||||||||||||||||||||||||||||||||||||||||||||||||||||||||||||||||||||||||||||||||||||||||||||||||||||
Less: Year-Over-Year Reallocation of Funding |
-701 | 0 | 0 | 0 | 0 | 0 | |||||||||||||||||||||||||||||||||||||||||||||||||||||||||||||||||||||||||||||||||||||||||||||||||||||||||||||||||||||||||
| Specific Claims Settlement Fund Replenishment and Co-development | CIRNAC | 5,890 | 1 | 0 | 0 | 0 | 0 | ||||||||||||||||||||||||||||||||||||||||||||||||||||||||||||||||||||||||||||||||||||||||||||||||||||||||||||||||||||||||
Less: Funds Previously Provisioned in the Fiscal Framework |
-5,890 | 0 | 0 | 0 | 0 | 0 | |||||||||||||||||||||||||||||||||||||||||||||||||||||||||||||||||||||||||||||||||||||||||||||||||||||||||||||||||||||||||
| Recruitment and Retention of Health Professionals On Reserve | ISC | 18 | 38 | 54 | 70 | 70 | 0 | ||||||||||||||||||||||||||||||||||||||||||||||||||||||||||||||||||||||||||||||||||||||||||||||||||||||||||||||||||||||||
| Further Supports for Indigenous Priorities Regarding Major Projects | NRCan, DFO, TC, ECCC | 9 | 5 | 18 | 0 | 0 | 0 | ||||||||||||||||||||||||||||||||||||||||||||||||||||||||||||||||||||||||||||||||||||||||||||||||||||||||||||||||||||||||
| Indigenous Childhood Claims | CIRNAC | 43 | 28 | 3 | 0 | 0 | 0 | ||||||||||||||||||||||||||||||||||||||||||||||||||||||||||||||||||||||||||||||||||||||||||||||||||||||||||||||||||||||||
| Tax and Financial Sector Policy | |||||||||||||||||||||||||||||||||||||||||||||||||||||||||||||||||||||||||||||||||||||||||||||||||||||||||||||||||||||||||||||||
| Funding for Administration of Tax and Other Measures1,5 | CRA | 196 | 149 | 120 | 94 | 97 | 92 | ||||||||||||||||||||||||||||||||||||||||||||||||||||||||||||||||||||||||||||||||||||||||||||||||||||||||||||||||||||||||
| Maintaining Excise Duty Relief for Cider and Mead | FIN | 11 | 16 | 16 | 16 | 16 | 16 | ||||||||||||||||||||||||||||||||||||||||||||||||||||||||||||||||||||||||||||||||||||||||||||||||||||||||||||||||||||||||
| Trade, International Relations and Security | |||||||||||||||||||||||||||||||||||||||||||||||||||||||||||||||||||||||||||||||||||||||||||||||||||||||||||||||||||||||||||||||
| Addressing Irregular Migration in the Americas | IRCC, GAC | 18 | 22 | 25 | 25 | 25 | 16 | ||||||||||||||||||||||||||||||||||||||||||||||||||||||||||||||||||||||||||||||||||||||||||||||||||||||||||||||||||||||||
| Continental Defence and NORAD Modernization1 | DND | 14 | 159 | 325 | 509 | 783 | 1,187 | ||||||||||||||||||||||||||||||||||||||||||||||||||||||||||||||||||||||||||||||||||||||||||||||||||||||||||||||||||||||||
Less: Funds Previously Provisioned in the Fiscal Framework |
-14 | -136 | -527 | -870 | -1,238 | -192 | |||||||||||||||||||||||||||||||||||||||||||||||||||||||||||||||||||||||||||||||||||||||||||||||||||||||||||||||||||||||||
| Interim Auxiliary Oiler Replenishment Vessel Contract Extension1 | DND | 13 | 88 | 86 | 0 | 0 | 0 | ||||||||||||||||||||||||||||||||||||||||||||||||||||||||||||||||||||||||||||||||||||||||||||||||||||||||||||||||||||||||
| Maintaining Service Levels of the Controlled Goods Program | PSPC | 4 | 4 | 4 | 4 | 4 | 4 | ||||||||||||||||||||||||||||||||||||||||||||||||||||||||||||||||||||||||||||||||||||||||||||||||||||||||||||||||||||||||
| Protecting Democratic Institutions from Cyber Threats | CSE | 1 | 1 | 1 | 1 | 1 | 1 | ||||||||||||||||||||||||||||||||||||||||||||||||||||||||||||||||||||||||||||||||||||||||||||||||||||||||||||||||||||||||
| Reinforcing Government of Canada Cyber Security | SSC, TBS | 13 | 85 | 78 | 67 | 82 | 79 | ||||||||||||||||||||||||||||||||||||||||||||||||||||||||||||||||||||||||||||||||||||||||||||||||||||||||||||||||||||||||
| Renewal of Operation PRESENCE | DND | 25 | 0 | 0 | 0 | 0 | 0 | ||||||||||||||||||||||||||||||||||||||||||||||||||||||||||||||||||||||||||||||||||||||||||||||||||||||||||||||||||||||||
| Renewing the Creative Export Strategy | CH | 0 | 19 | 19 | 19 | 0 | 0 | ||||||||||||||||||||||||||||||||||||||||||||||||||||||||||||||||||||||||||||||||||||||||||||||||||||||||||||||||||||||||
| Full and Fair Compensation for Supply Managed Sectors6 | AAFC | 1,200 | 145 | 145 | 145 | 45 | 42 | ||||||||||||||||||||||||||||||||||||||||||||||||||||||||||||||||||||||||||||||||||||||||||||||||||||||||||||||||||||||||
Less: Funds Previously Provisioned in the Fiscal Framework |
0 | 0 | 0 | 0 | 0 | -13 | |||||||||||||||||||||||||||||||||||||||||||||||||||||||||||||||||||||||||||||||||||||||||||||||||||||||||||||||||||||||||
| Sanctions Administration1 | GAC, RCMP, FIN | 5 | 17 | 16 | 17 | 16 | 10 | ||||||||||||||||||||||||||||||||||||||||||||||||||||||||||||||||||||||||||||||||||||||||||||||||||||||||||||||||||||||||
Less: Funds Sourced from Existing Departmental Resources |
-1 | -1 | -1 | -1 | -1 | -1 | |||||||||||||||||||||||||||||||||||||||||||||||||||||||||||||||||||||||||||||||||||||||||||||||||||||||||||||||||||||||||
| Seventh Replenishment for Global Fund1 | GAC | 0 | 61 | 61 | 61 | 61 | 61 | ||||||||||||||||||||||||||||||||||||||||||||||||||||||||||||||||||||||||||||||||||||||||||||||||||||||||||||||||||||||||
Less: Funds Sourced from Existing Departmental Resources |
0 | -61 | -61 | -61 | -61 | -61 | |||||||||||||||||||||||||||||||||||||||||||||||||||||||||||||||||||||||||||||||||||||||||||||||||||||||||||||||||||||||||
| Providing Safe Haven to Ukrainians (including charter flights, accommodations, and financial assistance)1 | IRCC, CBSA, PHAC, GAC, IRB | 623 | 66 | 6 | 2 | 2 | 2 | ||||||||||||||||||||||||||||||||||||||||||||||||||||||||||||||||||||||||||||||||||||||||||||||||||||||||||||||||||||||||
Less: Funds Previously Provisioned in the Fiscal Framework |
-365 | 0 | 0 | 0 | 0 | 0 | |||||||||||||||||||||||||||||||||||||||||||||||||||||||||||||||||||||||||||||||||||||||||||||||||||||||||||||||||||||||||
Stand Up for Ukraine Humanitarian Support1 |
GAC | 100 | 0 | 0 | 0 | 0 | 0 | ||||||||||||||||||||||||||||||||||||||||||||||||||||||||||||||||||||||||||||||||||||||||||||||||||||||||||||||||||||||||
Less: Funds Sourced from Existing Departmental Resources |
-100 | 0 | 0 | 0 | 0 | 0 | |||||||||||||||||||||||||||||||||||||||||||||||||||||||||||||||||||||||||||||||||||||||||||||||||||||||||||||||||||||||||
| Global Food Security and Additional Support for Ukraine1 | GAC | 402 | 0 | 0 | 0 | 0 | 0 | ||||||||||||||||||||||||||||||||||||||||||||||||||||||||||||||||||||||||||||||||||||||||||||||||||||||||||||||||||||||||
| Supporting Canada's Consular Program | GAC | 44 | 54 | 56 | 56 | 55 | 55 | ||||||||||||||||||||||||||||||||||||||||||||||||||||||||||||||||||||||||||||||||||||||||||||||||||||||||||||||||||||||||
Less: Funds Sourced from Existing Departmental Resources |
-37 | -37 | -37 | -37 | -37 | -37 | |||||||||||||||||||||||||||||||||||||||||||||||||||||||||||||||||||||||||||||||||||||||||||||||||||||||||||||||||||||||||
| Eastern Europe Diplomatic Capacity1 | GAC | 8 | 13 | 13 | 13 | 13 | 13 | ||||||||||||||||||||||||||||||||||||||||||||||||||||||||||||||||||||||||||||||||||||||||||||||||||||||||||||||||||||||||
Less: Costs to be Recovered |
0 | -1 | -1 | -1 | -1 | -1 | |||||||||||||||||||||||||||||||||||||||||||||||||||||||||||||||||||||||||||||||||||||||||||||||||||||||||||||||||||||||||
| Ukraine Goods Remission Order1 | FIN | 2 | 0 | 0 | 0 | 0 | 0 | ||||||||||||||||||||||||||||||||||||||||||||||||||||||||||||||||||||||||||||||||||||||||||||||||||||||||||||||||||||||||
| Repeal of the Certain Goods Remission Order (COVID-19) | FIN | 36 | 0 | 0 | 0 | 0 | 0 | ||||||||||||||||||||||||||||||||||||||||||||||||||||||||||||||||||||||||||||||||||||||||||||||||||||||||||||||||||||||||
| Delayed Implementation of Improving Duty and Tax Collection on Imported Goods to September 1, 2023 | CBSA | 150 | 63 | 0 | 0 | 0 | 0 | ||||||||||||||||||||||||||||||||||||||||||||||||||||||||||||||||||||||||||||||||||||||||||||||||||||||||||||||||||||||||
| (Net) Fiscal Impact of Non-Announced Measures7 | 2,669 | 738 | 672 | 506 | 701 | 391 | |||||||||||||||||||||||||||||||||||||||||||||||||||||||||||||||||||||||||||||||||||||||||||||||||||||||||||||||||||||||||
| Net Fiscal Impact – Total Policy Actions Taken Since Budget 2022 | 7,279 | 4,325 | 2,870 | 1,816 | 1,765 | 3,530 | |||||||||||||||||||||||||||||||||||||||||||||||||||||||||||||||||||||||||||||||||||||||||||||||||||||||||||||||||||||||||
|
1 Measure previously released in 2022-23 Supplementary Estimates A or previously announced. 2 This includes funding for the Canadian Museum for Human Rights, the Canadian Museum of History, the Canadian Museum of Immigration, the Canadian Museum of Nature, the National Museum of Science and Technology, the National Gallery of Canada, and the National Battlefields Commission. 3 Funding will support Canada's continued efforts to work with Indigenous communities to implement An Act respecting First Nations, Inuit and Métis children, youth and families. 4 Funding for First Nations Child and Family Services and Jordan's Principle. Building on the $40 billion provisioned in Economic and Fiscal Update 2021, the Agreements in Principle announced in January 2022, and $4 billion announced for Jordan's Principle in Budget 2022, this includes funding to maintain and strengthen existing services in the short term, as well as support negotiations toward a final settlement agreement to ensure long-term reform of these programs. 5 Funding for the CRA to administer the First Home Savings Account, changes to international tax rules in accordance with OECD Pillars One and Two, new rules regarding the exchange of information on digital economy platform sellers, the Canada Recovery Hiring Program, the enhanced Canada Workers Benefit, the Multigenerational Home Renovation Tax Credit, the new Luxury Tax, the cannabis excise duty framework and the federal carbon pollution fuel pricing charge. Additionally, funding was approved for information technology systems changes in order for the CRA to implement legislative changes. 6 The government is providing $1.7 billion for full and fair compensation for the supply managed sectors related to concessions granted under the new North American Free Trade Agreement. Further details about the compensation will be made available in the coming weeks. 7 The net fiscal impact of measures that are not announced is presented at the aggregate level, and would include provisions for anticipated Cabinet decisions not yet made and funding decisions related to national security, commercial sensitivity, contract negotiations and litigation issues.
|
|||||||||||||||||||||||||||||||||||||||||||||||||||||||||||||||||||||||||||||||||||||||||||||||||||||||||||||||||||||||||||||||
Report a problem on this page
- Date modified: