
Archived - Chapter 2
The Road to Recovery
On this page:
To support Canadians during the worst economic crisis in nearly a century, the government rolled out unprecedented support to the economy. This support positioned Canada to come roaring back. The economy’s strong recovery so far has seen Canada exceed its target of restoring one million jobs and has recouped 106 per cent of jobs lost during the pandemic. Pandemic supports have also protected household and business balance sheets, which, in fact, have improved relative to before the pandemic.
There are, however, significant challenges ahead. The global phenomenon of inflation is having a real impact on Canadians’ lives and their worries about paying the bills. Rising prices are being driven by the unprecedented challenge of re-opening the world’s economy — something that has never had to be done before. Climate change has had a further impact, with floods in British Columbia further hindering supply chains and severe droughts in the Prairies, and around the world, increasing the cost of food. The Omicron variant of concern is contributing to further uncertainty about what lies ahead.
2.1 A Strong and Inclusive Economic Recovery
Last year, governments around the world and across Canada took rapid and unprecedented action to shut down economies in order to stem the spread of COVID-19. Businesses and workers made immense sacrifices, but Canadians did this to protect their communities and save lives.
The government’s COVID-19 economic response plan supported Canadians through the darkest days of the pandemic, stabilizing the economy, largely preventing economic scarring, and laying the foundations for a strong and inclusive recovery. This past spring and summer, as increasing numbers of Canadians got vaccinated, Canada and the world began the complex process of reopening their economies.
The turning off of the global economy, in 2020, was sudden and drastic. Safely turning economies back on and unwinding restrictions—while remaining vigilant against outbreaks—is a much more complex task, with global supply chain disruptions and related inflationary pressures posing a significant challenge worldwide.
So far, Canada’s recovery is faring well compared to previous economic downturns, in part due to the stabilizing effects of the federal government’s broad-based support measures, which positioned Canada for strong economic growth and job creation. Over the summer, many businesses began safely reopening and job creation surged, achieving—well ahead of expectations—the government’s commitment to create one million jobs. OECD projections suggest that by 2023, Canada’s recovery will be the second fastest in the G7. The government is committed to ensuring Canada has a full recovery that grows the middle class and builds a prosperous, more inclusive, more sustainable, and more resilient economy.
Looking forward, private sector economists expect solid growth in the year ahead as the Canadian economy continues to recover from the effects of the pandemic. However, COVID-19 is still here and there is still much unknown. The Omicron variant, and challenges resulting from the pandemic, including global supply disruptions, raise new uncertainties and have the potential to impact the speed of recovery and extend global inflationary pressures.
Safe and Steady Reopening of the Canadian Economy
The pandemic resulted in the deepest and fastest decline in economic activity in Canada since the Great Depression. In the face of this crisis, governments introduced emergency support packages to help avert an even sharper fall in output. This has minimized long-term economic scarring in the form of business closures and job losses that would have delayed and weakened the post-pandemic recovery. Canada’s fiscal policy response, consistent with that of many G7 peers, was proportional to the extent of the crisis Canada’s economy faced. Given the stabilizing effects of the programs on personal, corporate, and provincial and territorial finances, this extraordinary response has proven to be prudent fiscal management.
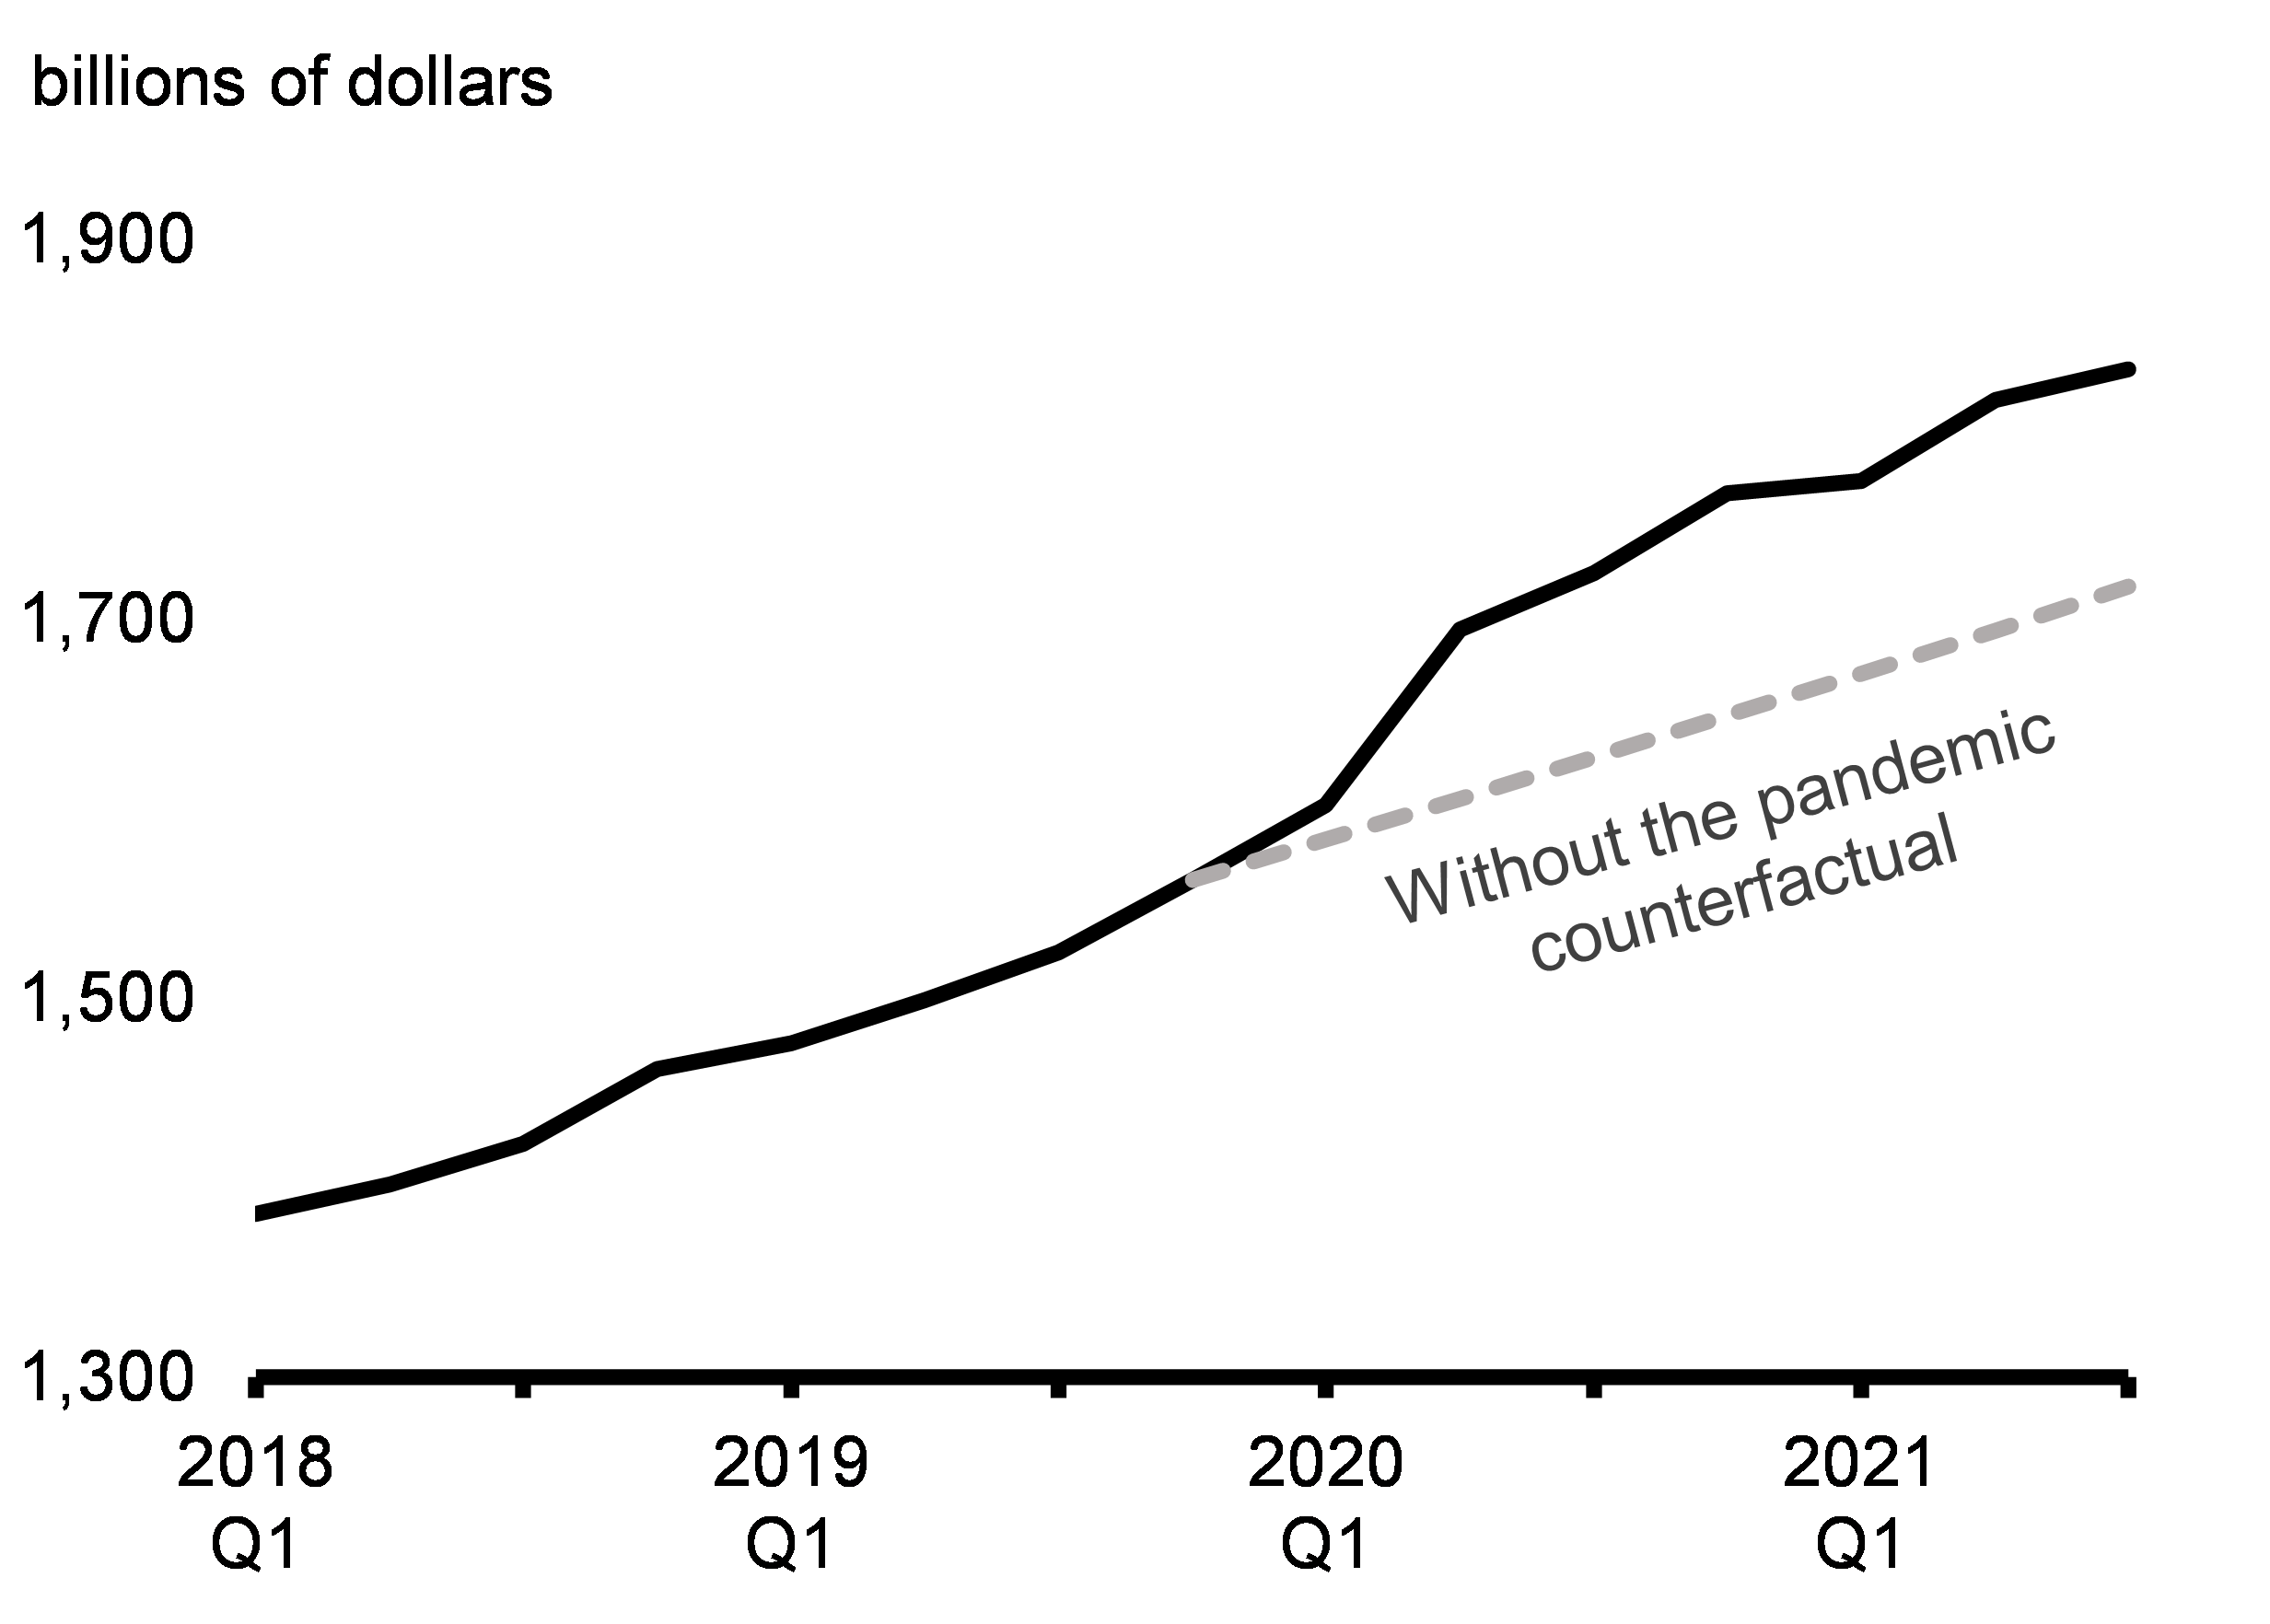
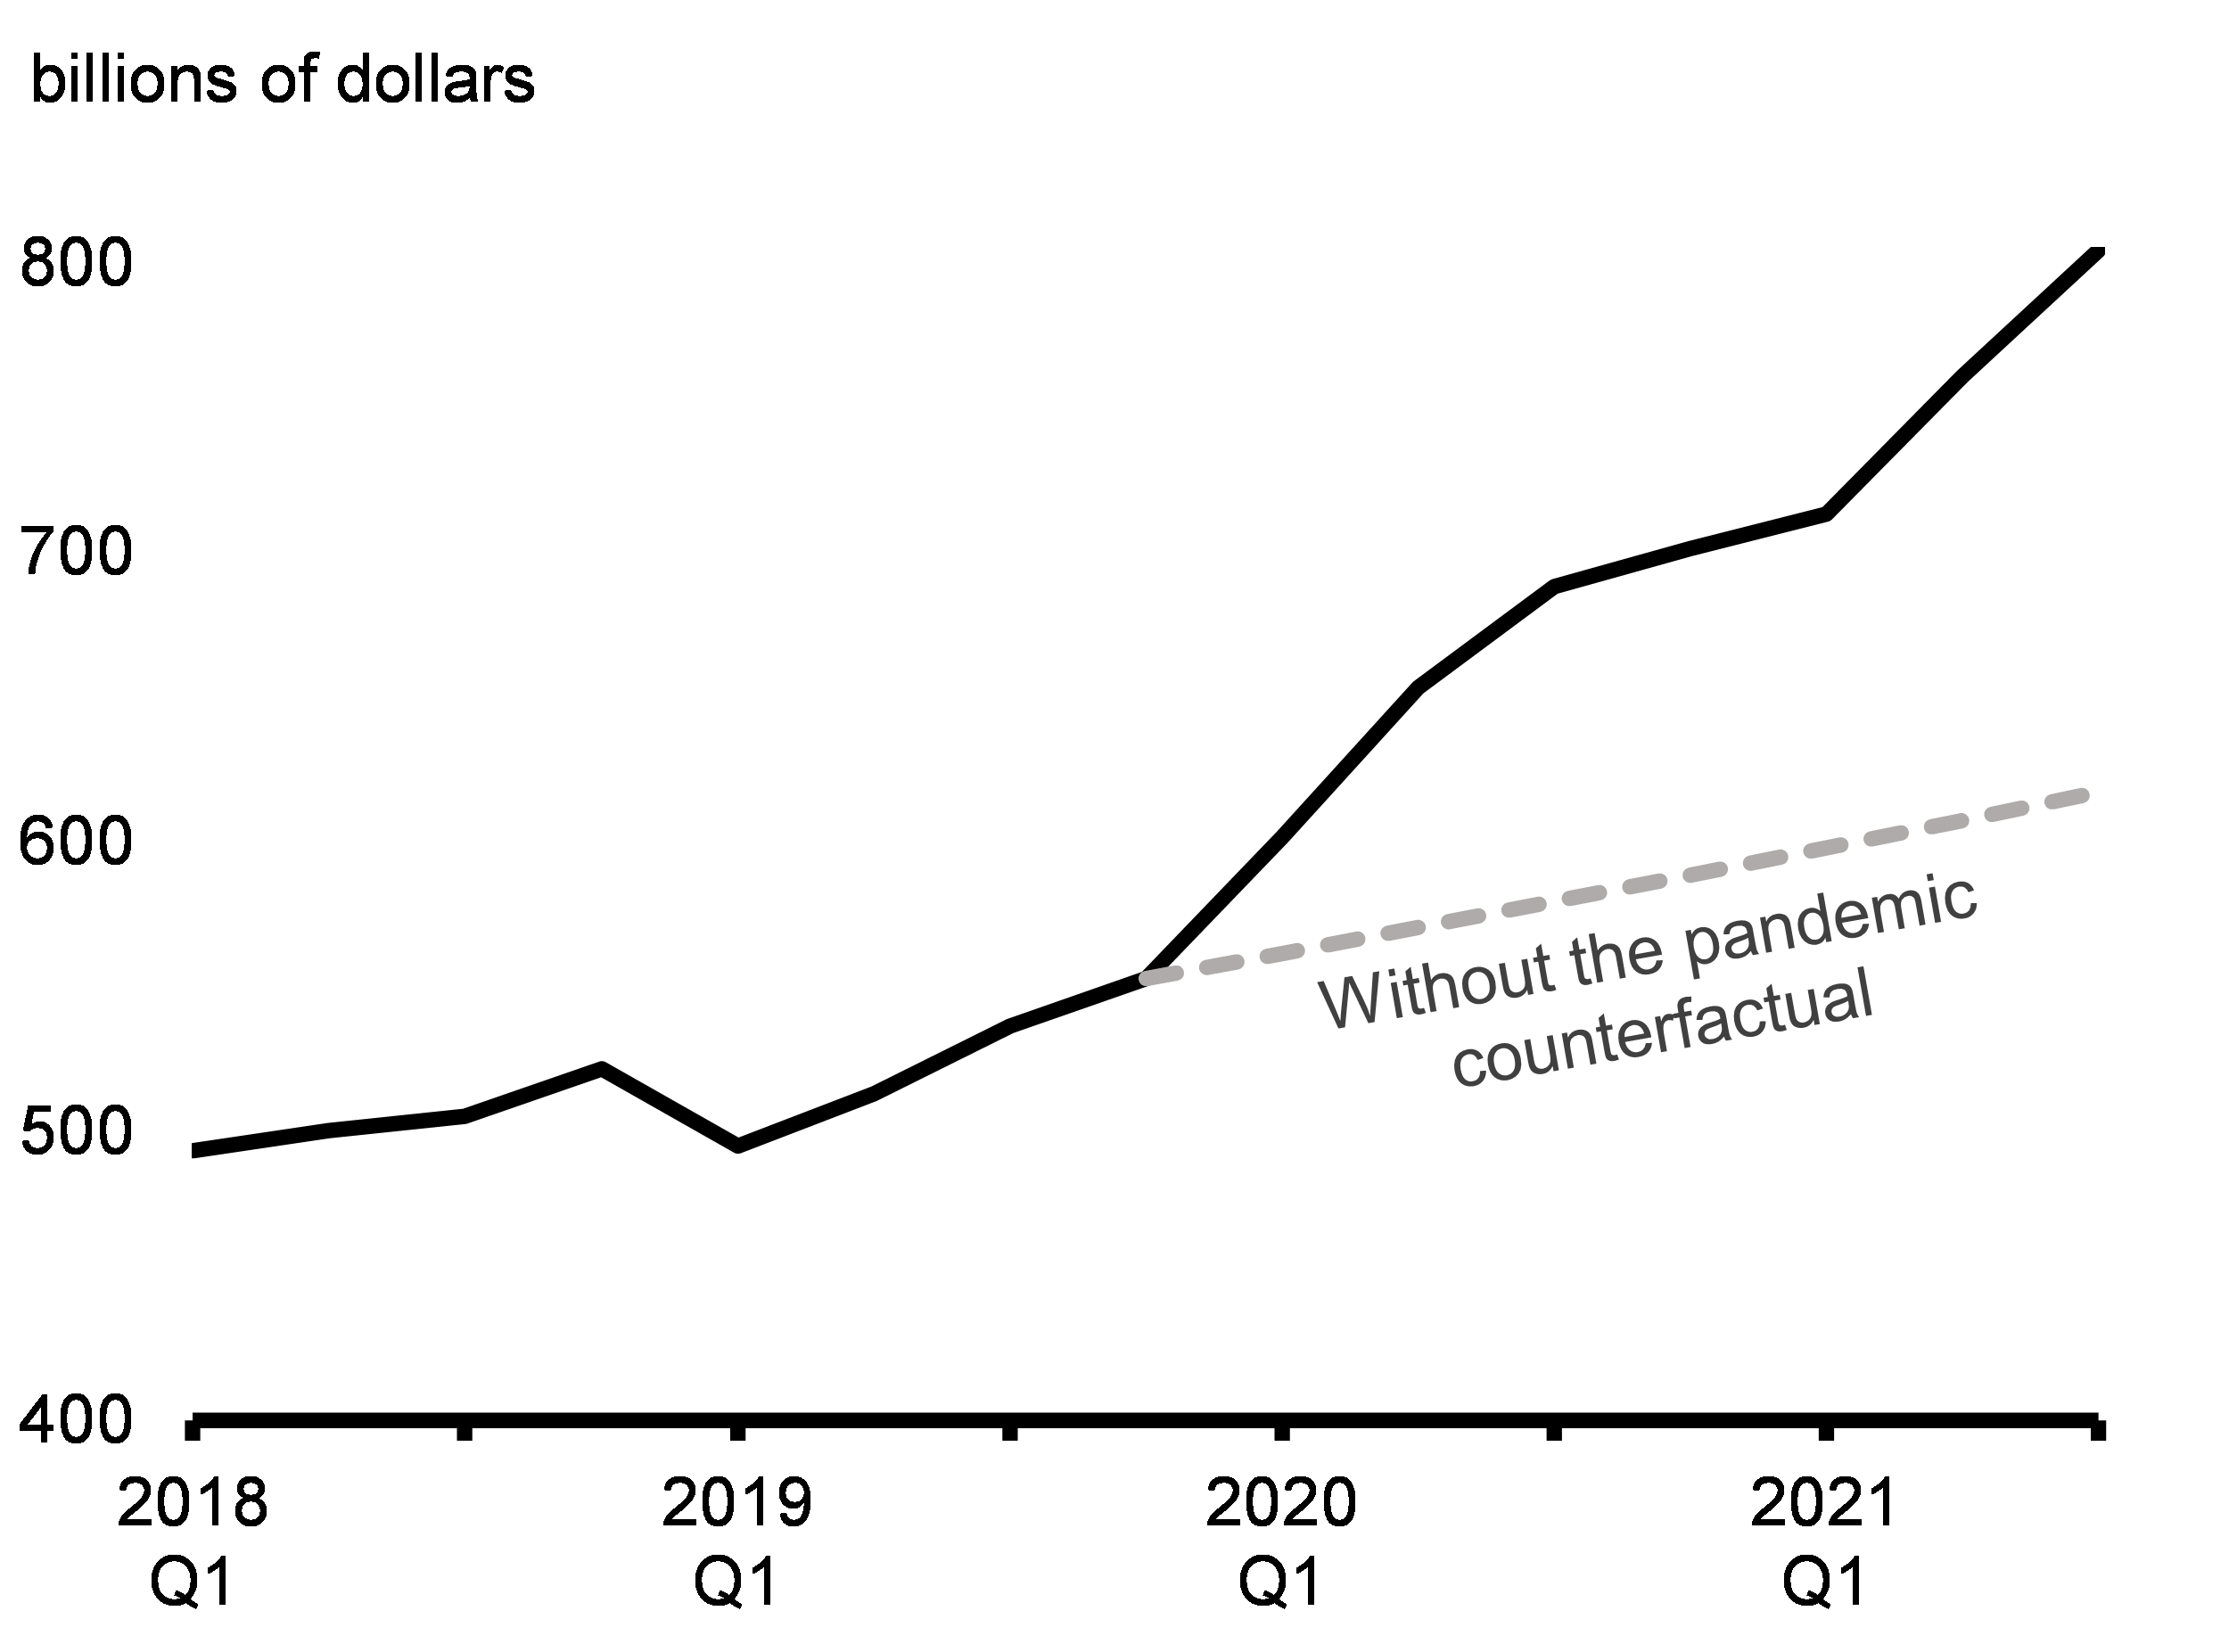
Canada’s economic recovery has been backed by solid underlying fundamentals, including improved household and corporate balance sheets, on average, due in part to significant fiscal policy support. Increased savings, reflecting fewer spending opportunities and government income supports, have enabled Canadians to pay down debt, which, in turn, has improved the resilience of household finances and overall credit quality. The government is aware that there are workers and businesses that continue to be affected by the pandemic and is moving forward on delivering targeted support. But we are also aware that Canada’s vaccination campaign and a significant build-up in savings by households and businesses could mean that a rebound in hard-hit services such as hospitality and tourism will exceed expectations (Charts 2.1 and 2.2). The ongoing pandemic and risk of variants of concern means that a degree of uncertainty remains.
Household Deposits during the Pandemic
Non-Financial Corporation Deposits during the Pandemic
Canada’s Economic Recovery Is Well on Track
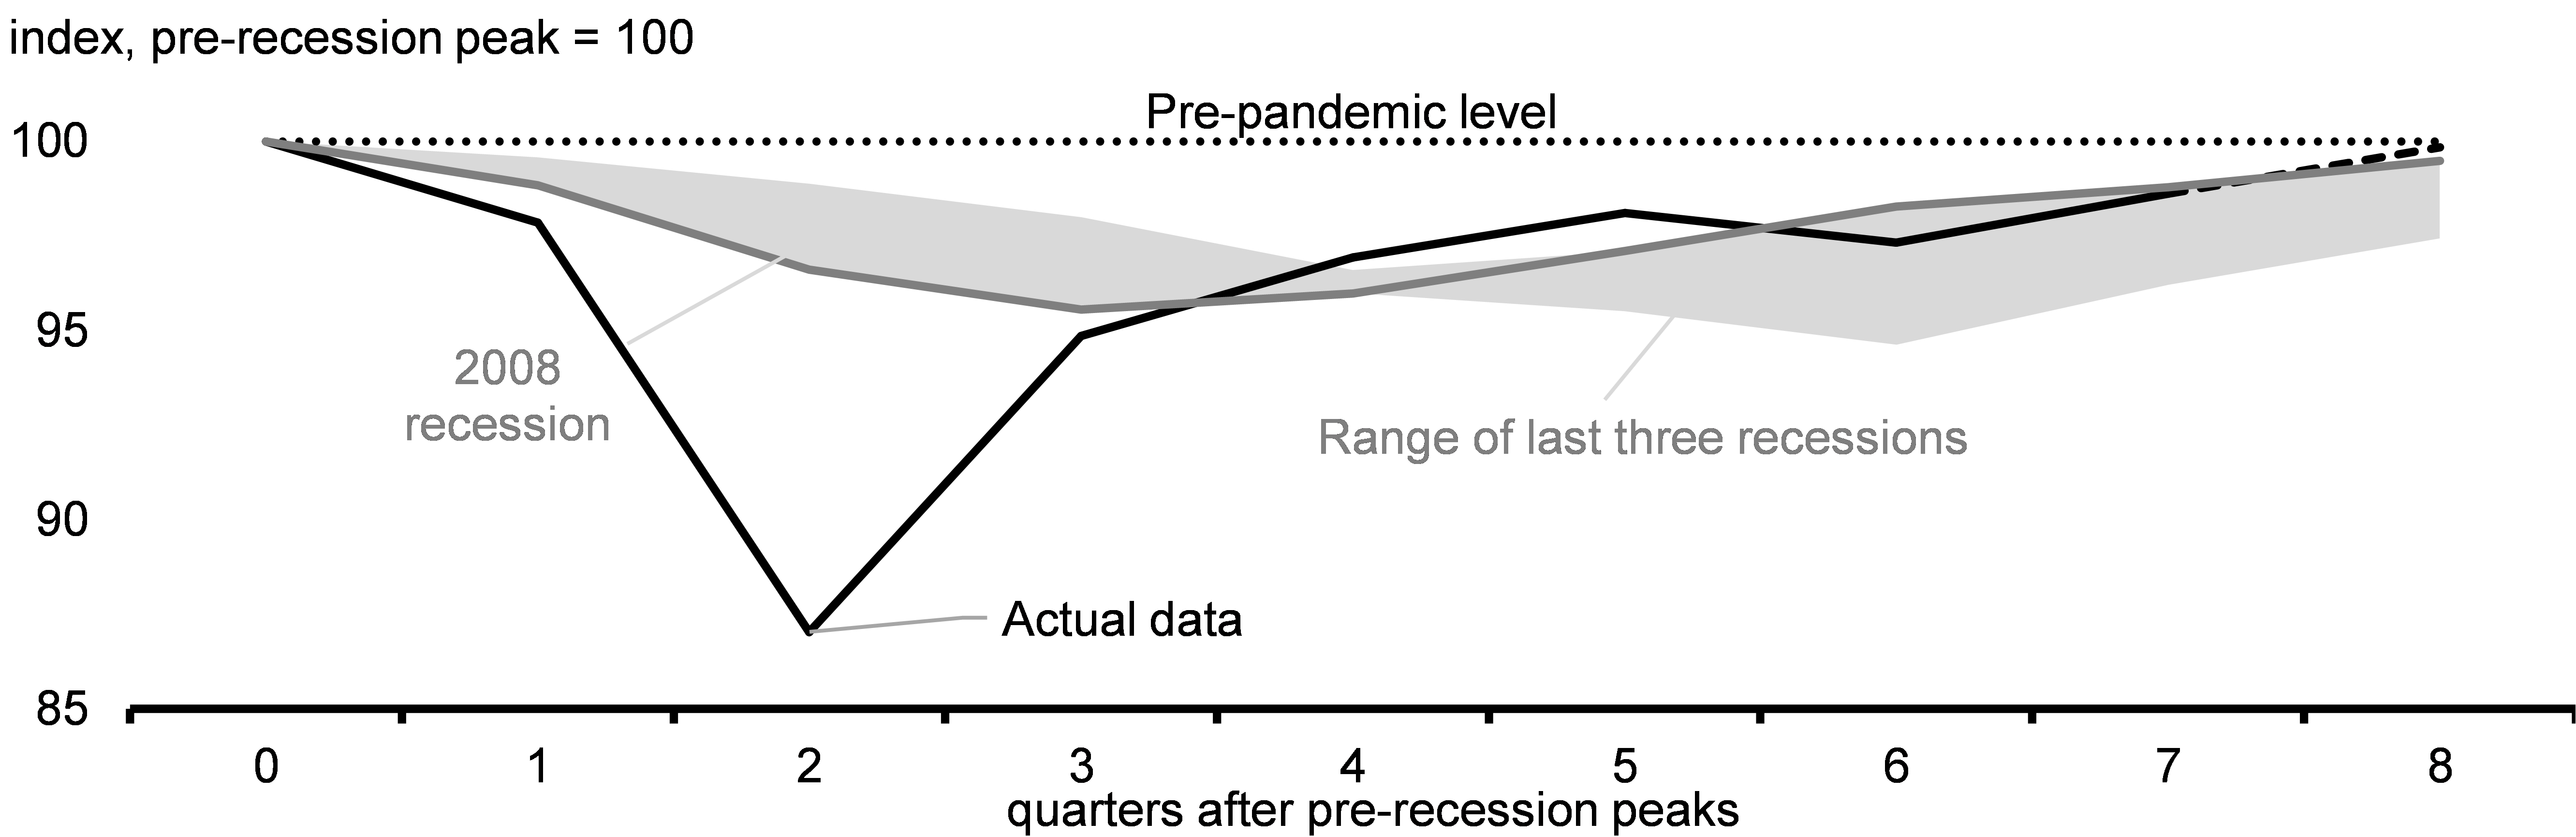
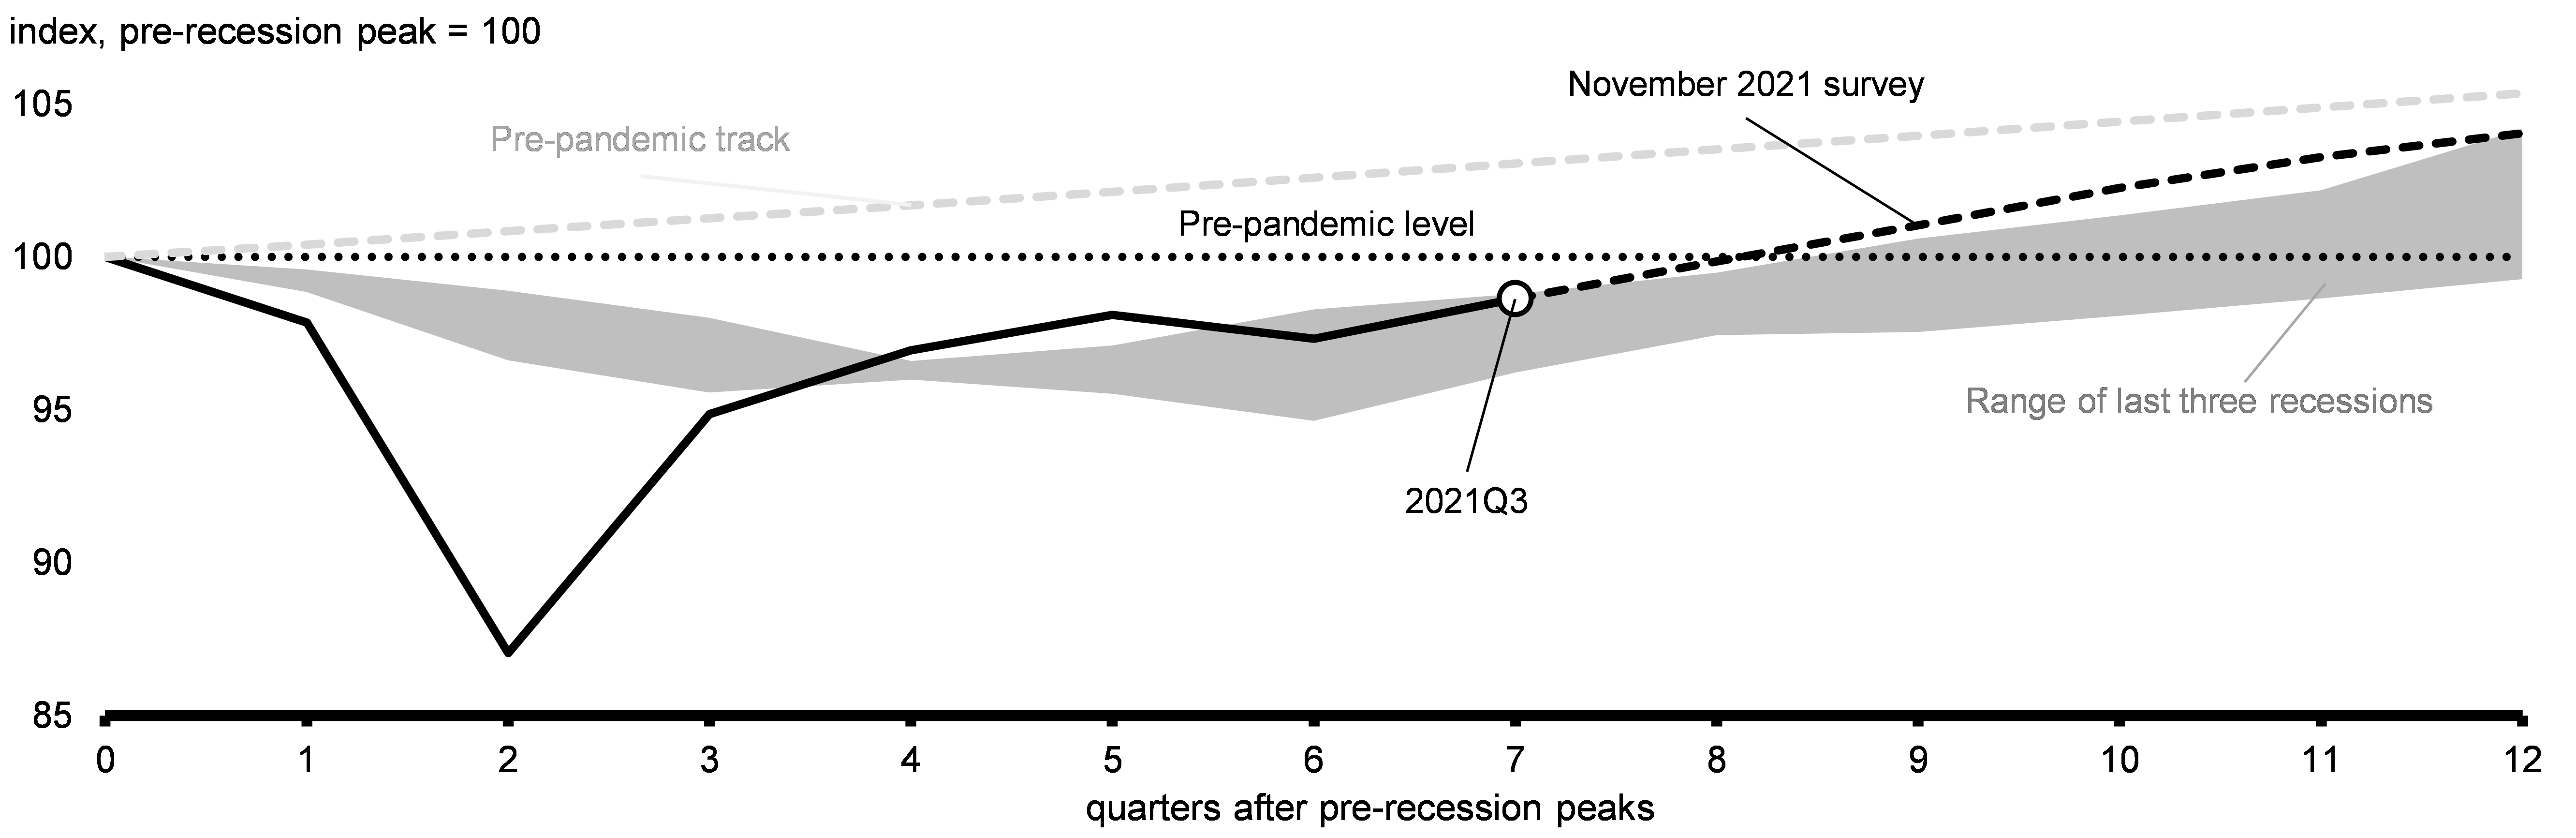
The COVID-19 recession was the largest recession since the Great Depression. But the government’s COVID-19 economic response plan has helped engineer an economic turnaround with unprecedented speed, both relative to some of our peers and relative to previous economic downturns, including the 2008-2009 recession (Chart 2.3). As of the third quarter of 2021, Canada’s real GDP is only 1.4 per cent below its pre-pandemic level and is expected to reach its pre-pandemic level by the first quarter of 2022.
Real GDP Change During COVID-19 and Previous Recessions
Canada’s COVID-19 support measures have also been highly effective in mitigating financial distress among both Canadians and businesses, preventing an unnecessary increase in bankruptcies and business closures that many had feared at the beginning of the crisis. In fact, Canada now has more active businesses than before the pandemic and bankruptcies and insolvencies are below normal levels. By keeping Canadians’ and businesses’ finances largely intact, federal government supports laid the foundations for strong growth.
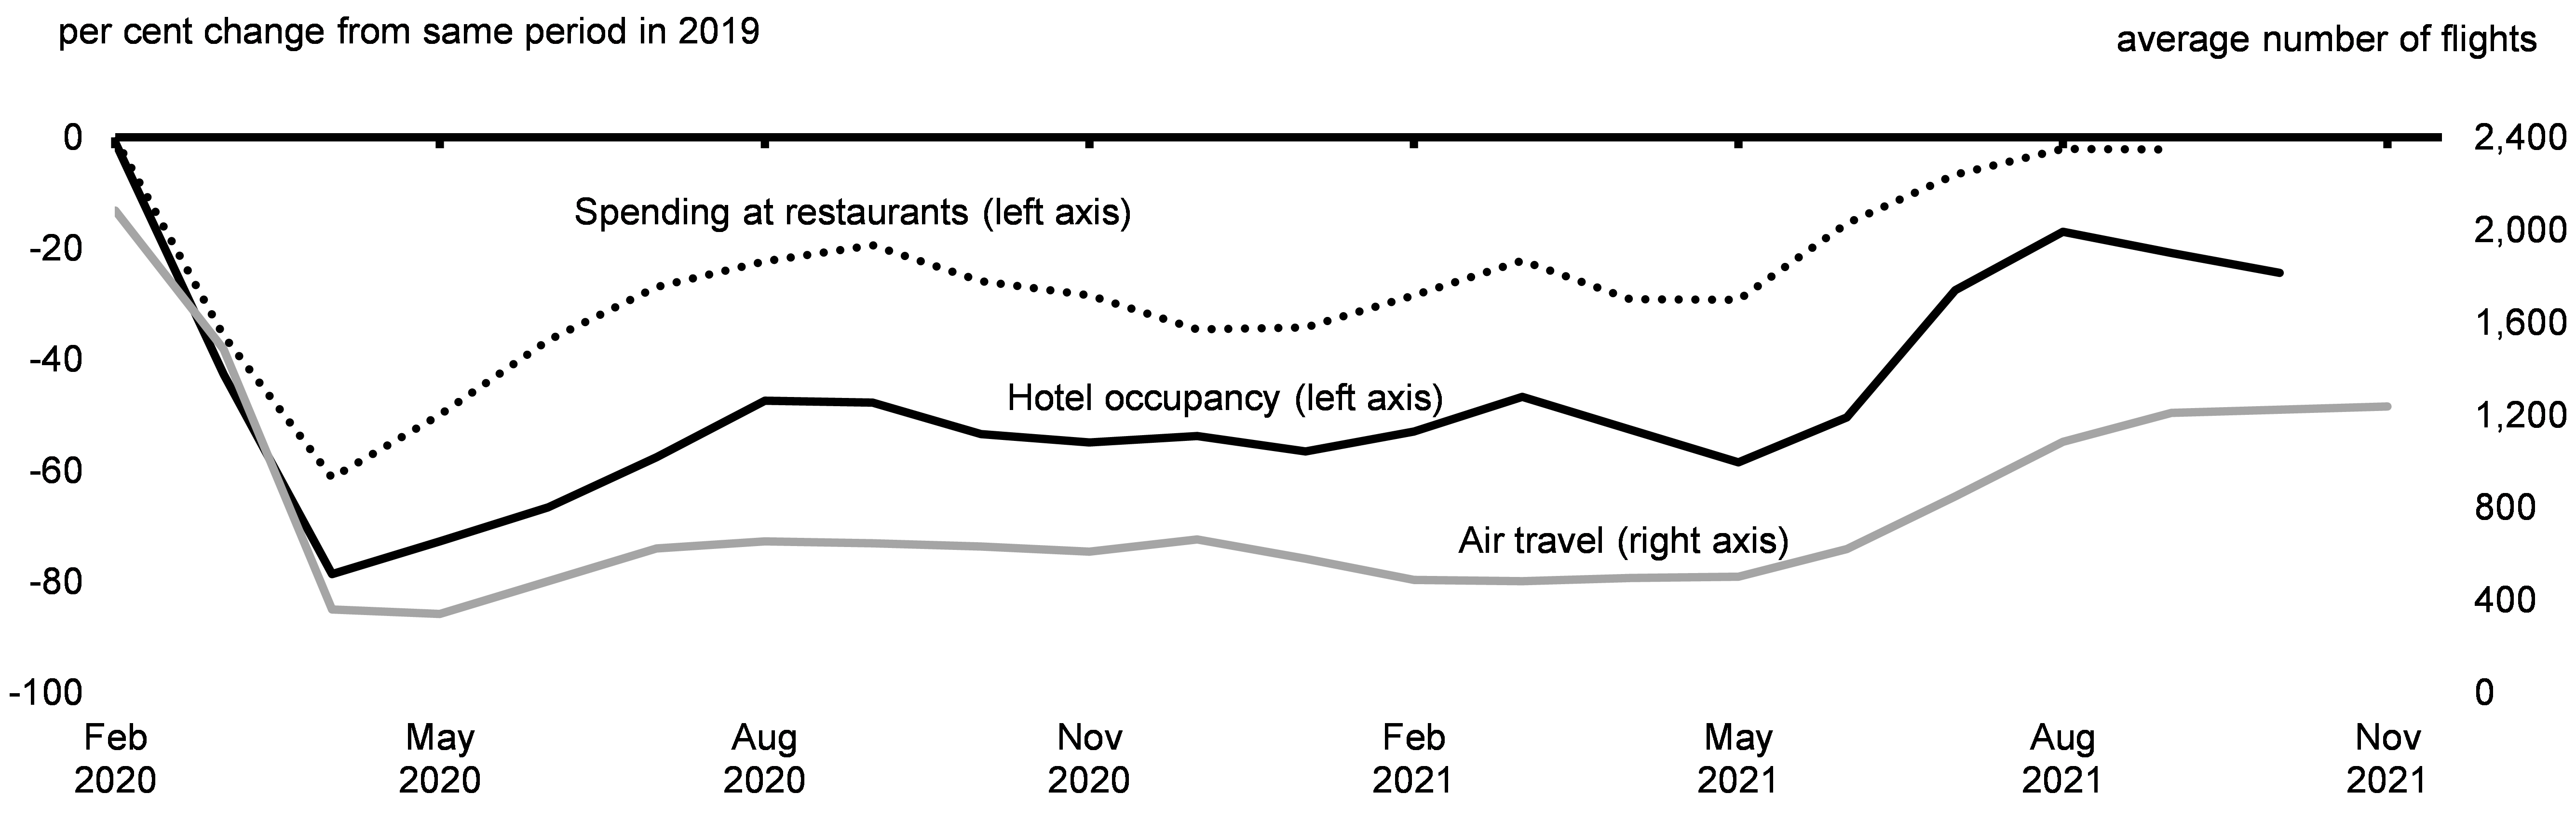
As the Canadian economy safely and carefully reopens, the recovery has been broadening—bringing along close-contact sectors like tourism, indoor dining, and air travel, which have shown clear signs of recovery (Chart 2.4). Encouragingly, strong growth in these close-contact sectors has brought them much closer to their pre-pandemic levels of activity compared to earlier in the year. This sets the stage for more sustained growth, though the recovery remains far from complete in certain sectors, particularly those that depend on tourism or large gatherings. The appearance of the Omicron variant underscores the fact that managing health risks remains key to a complete economic recovery.
Indicators for Selected Hard-hit Sectors of the Economy
Canada Exceeded its Goal of Creating One Million Jobs
At the height of lockdowns, 3 million Canadians lost their jobs and another 2.5 million Canadians were working significantly reduced hours—in total about 30 per cent of the pre-pandemic workforce. Initially, the labour market bounced back quickly, recouping 80 per cent of the jobs lost by November 2020. However, resurgent waves of the virus required public health restrictions in order to save lives, setting back the jobs recovery.
Since restrictions began being lifted in spring and summer 2021, the Canadian job market has seen a rapid recovery. Employment bounced back forcefully over the summer and fall, with 757,000 jobs having been created since June. By September, the government had achieved its commitment to create one million jobs, well ahead of initial expectations. By November, this number had grown to 1.3 million jobs. As well, the number of employed Canadians is now above its pre-pandemic level and the unemployment rate has reached its lowest level since the start of the pandemic, declining for six consecutive months.
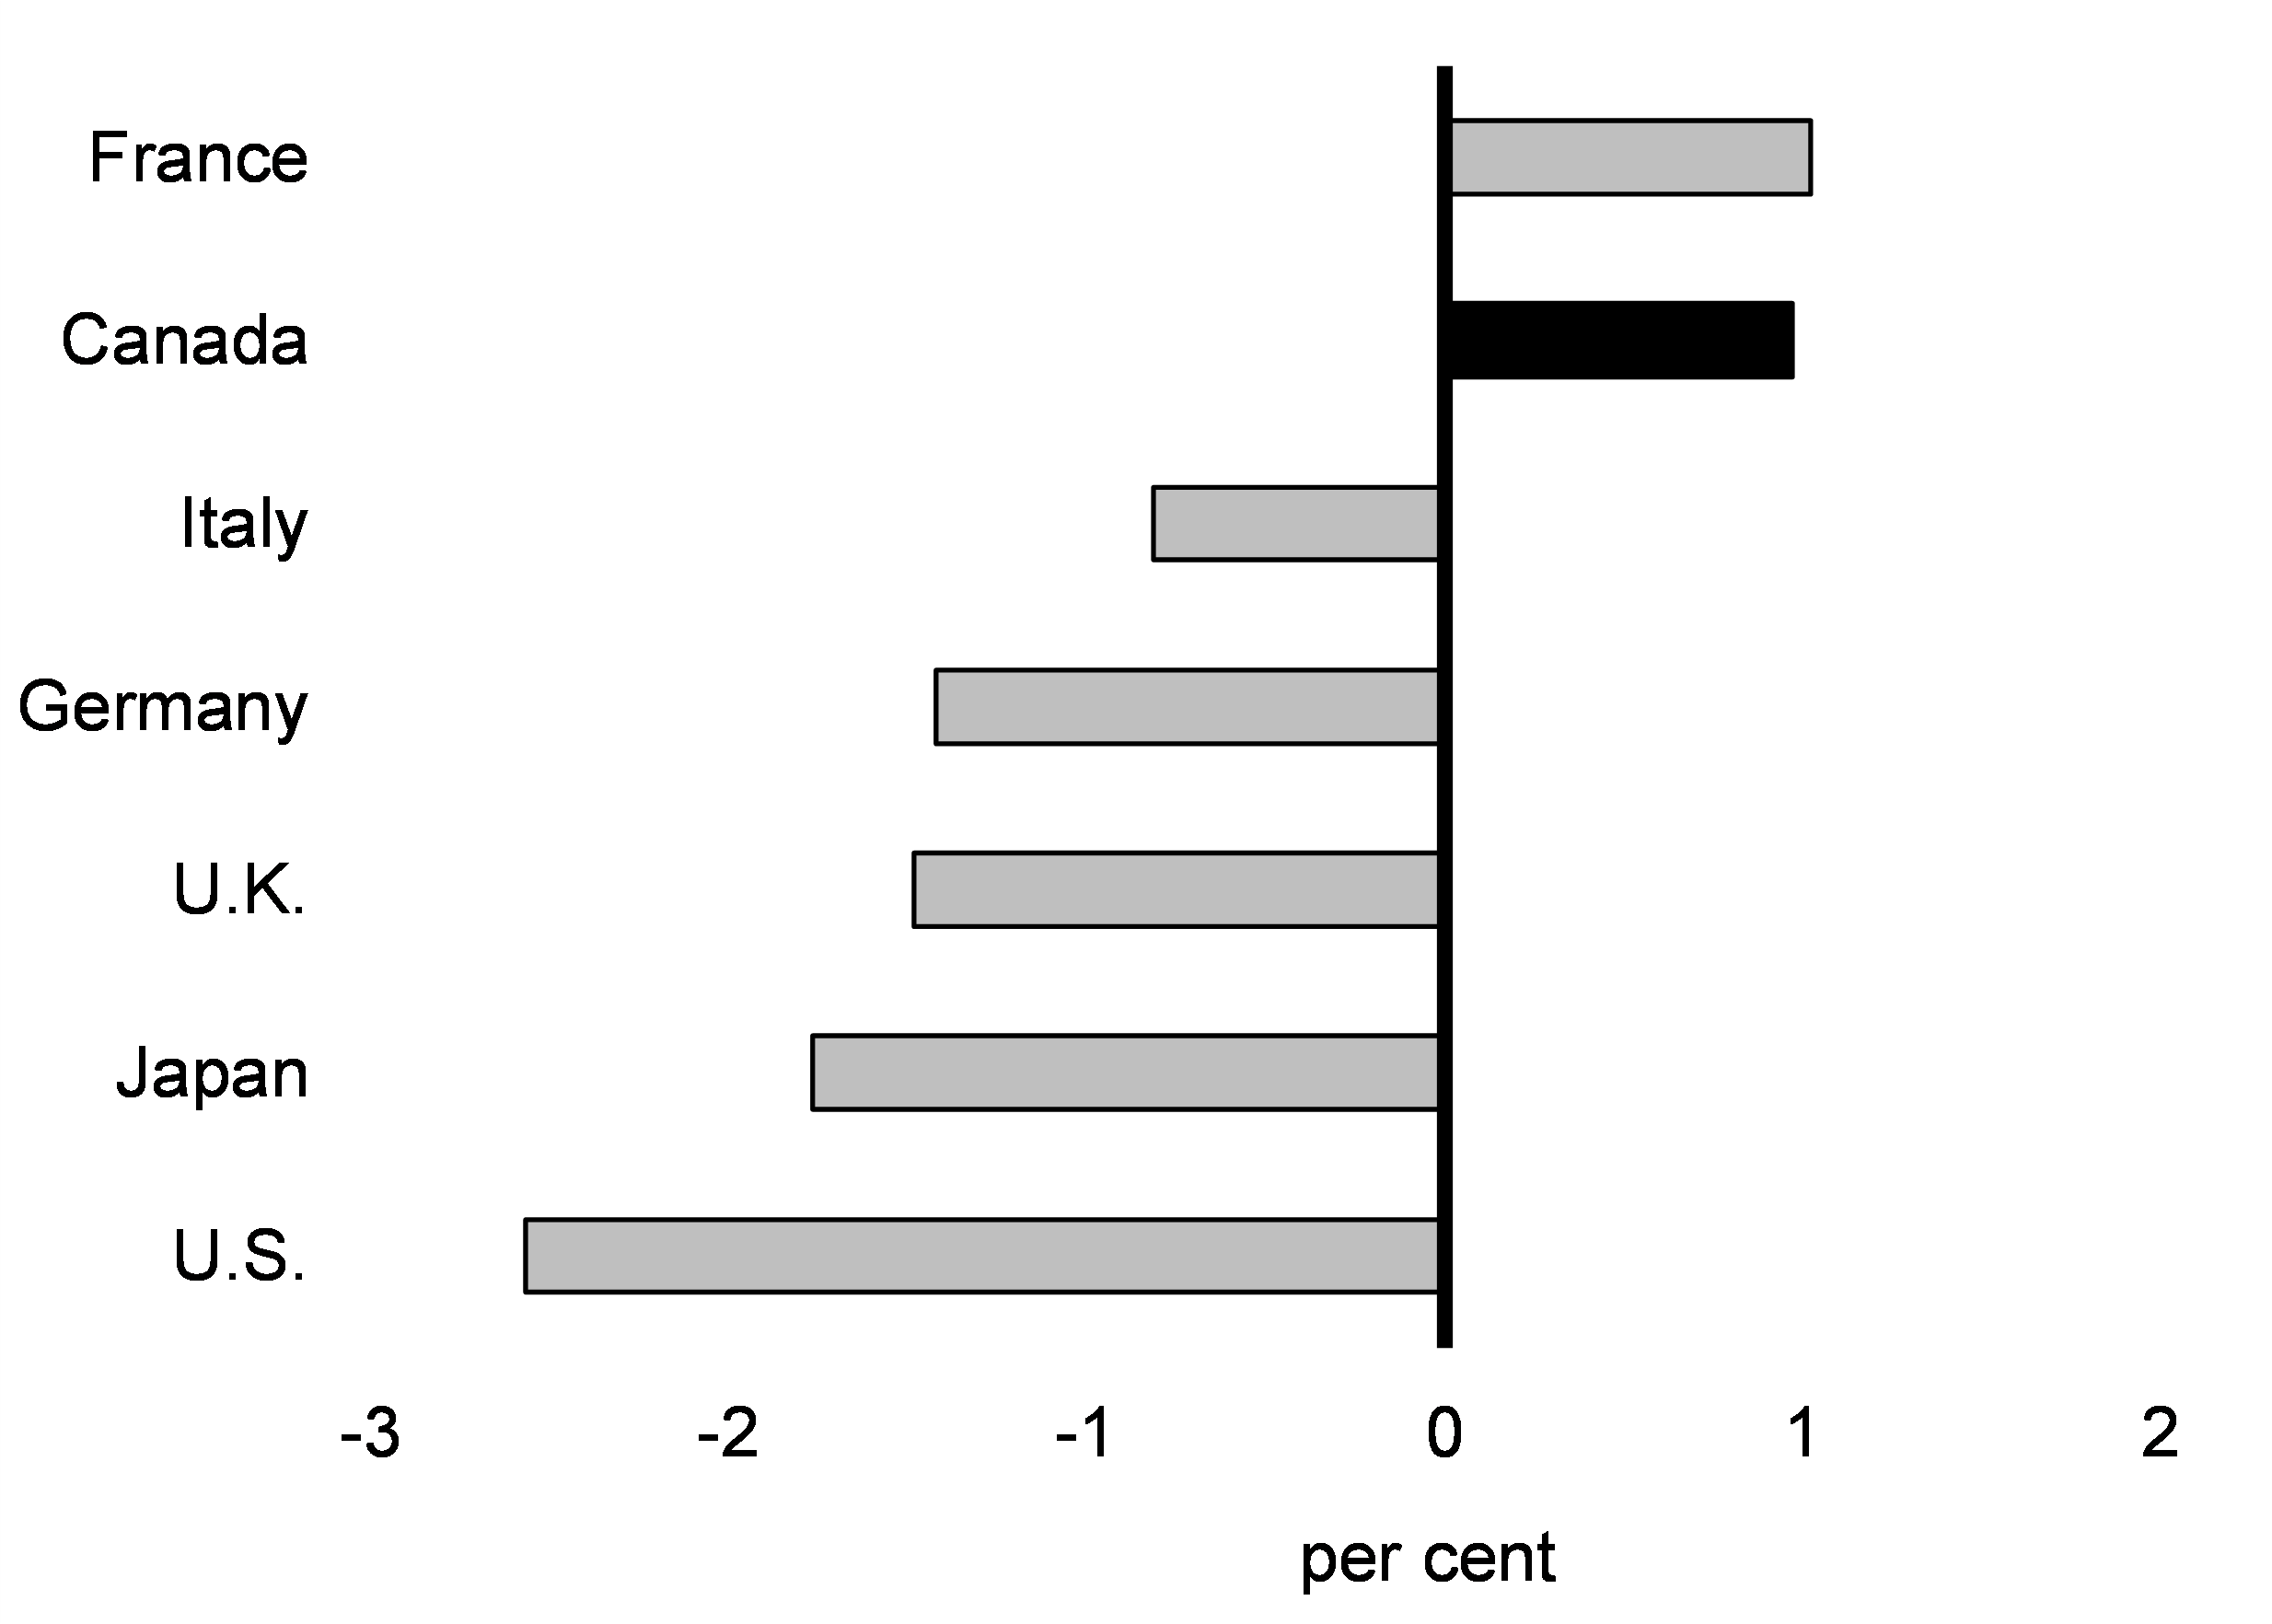
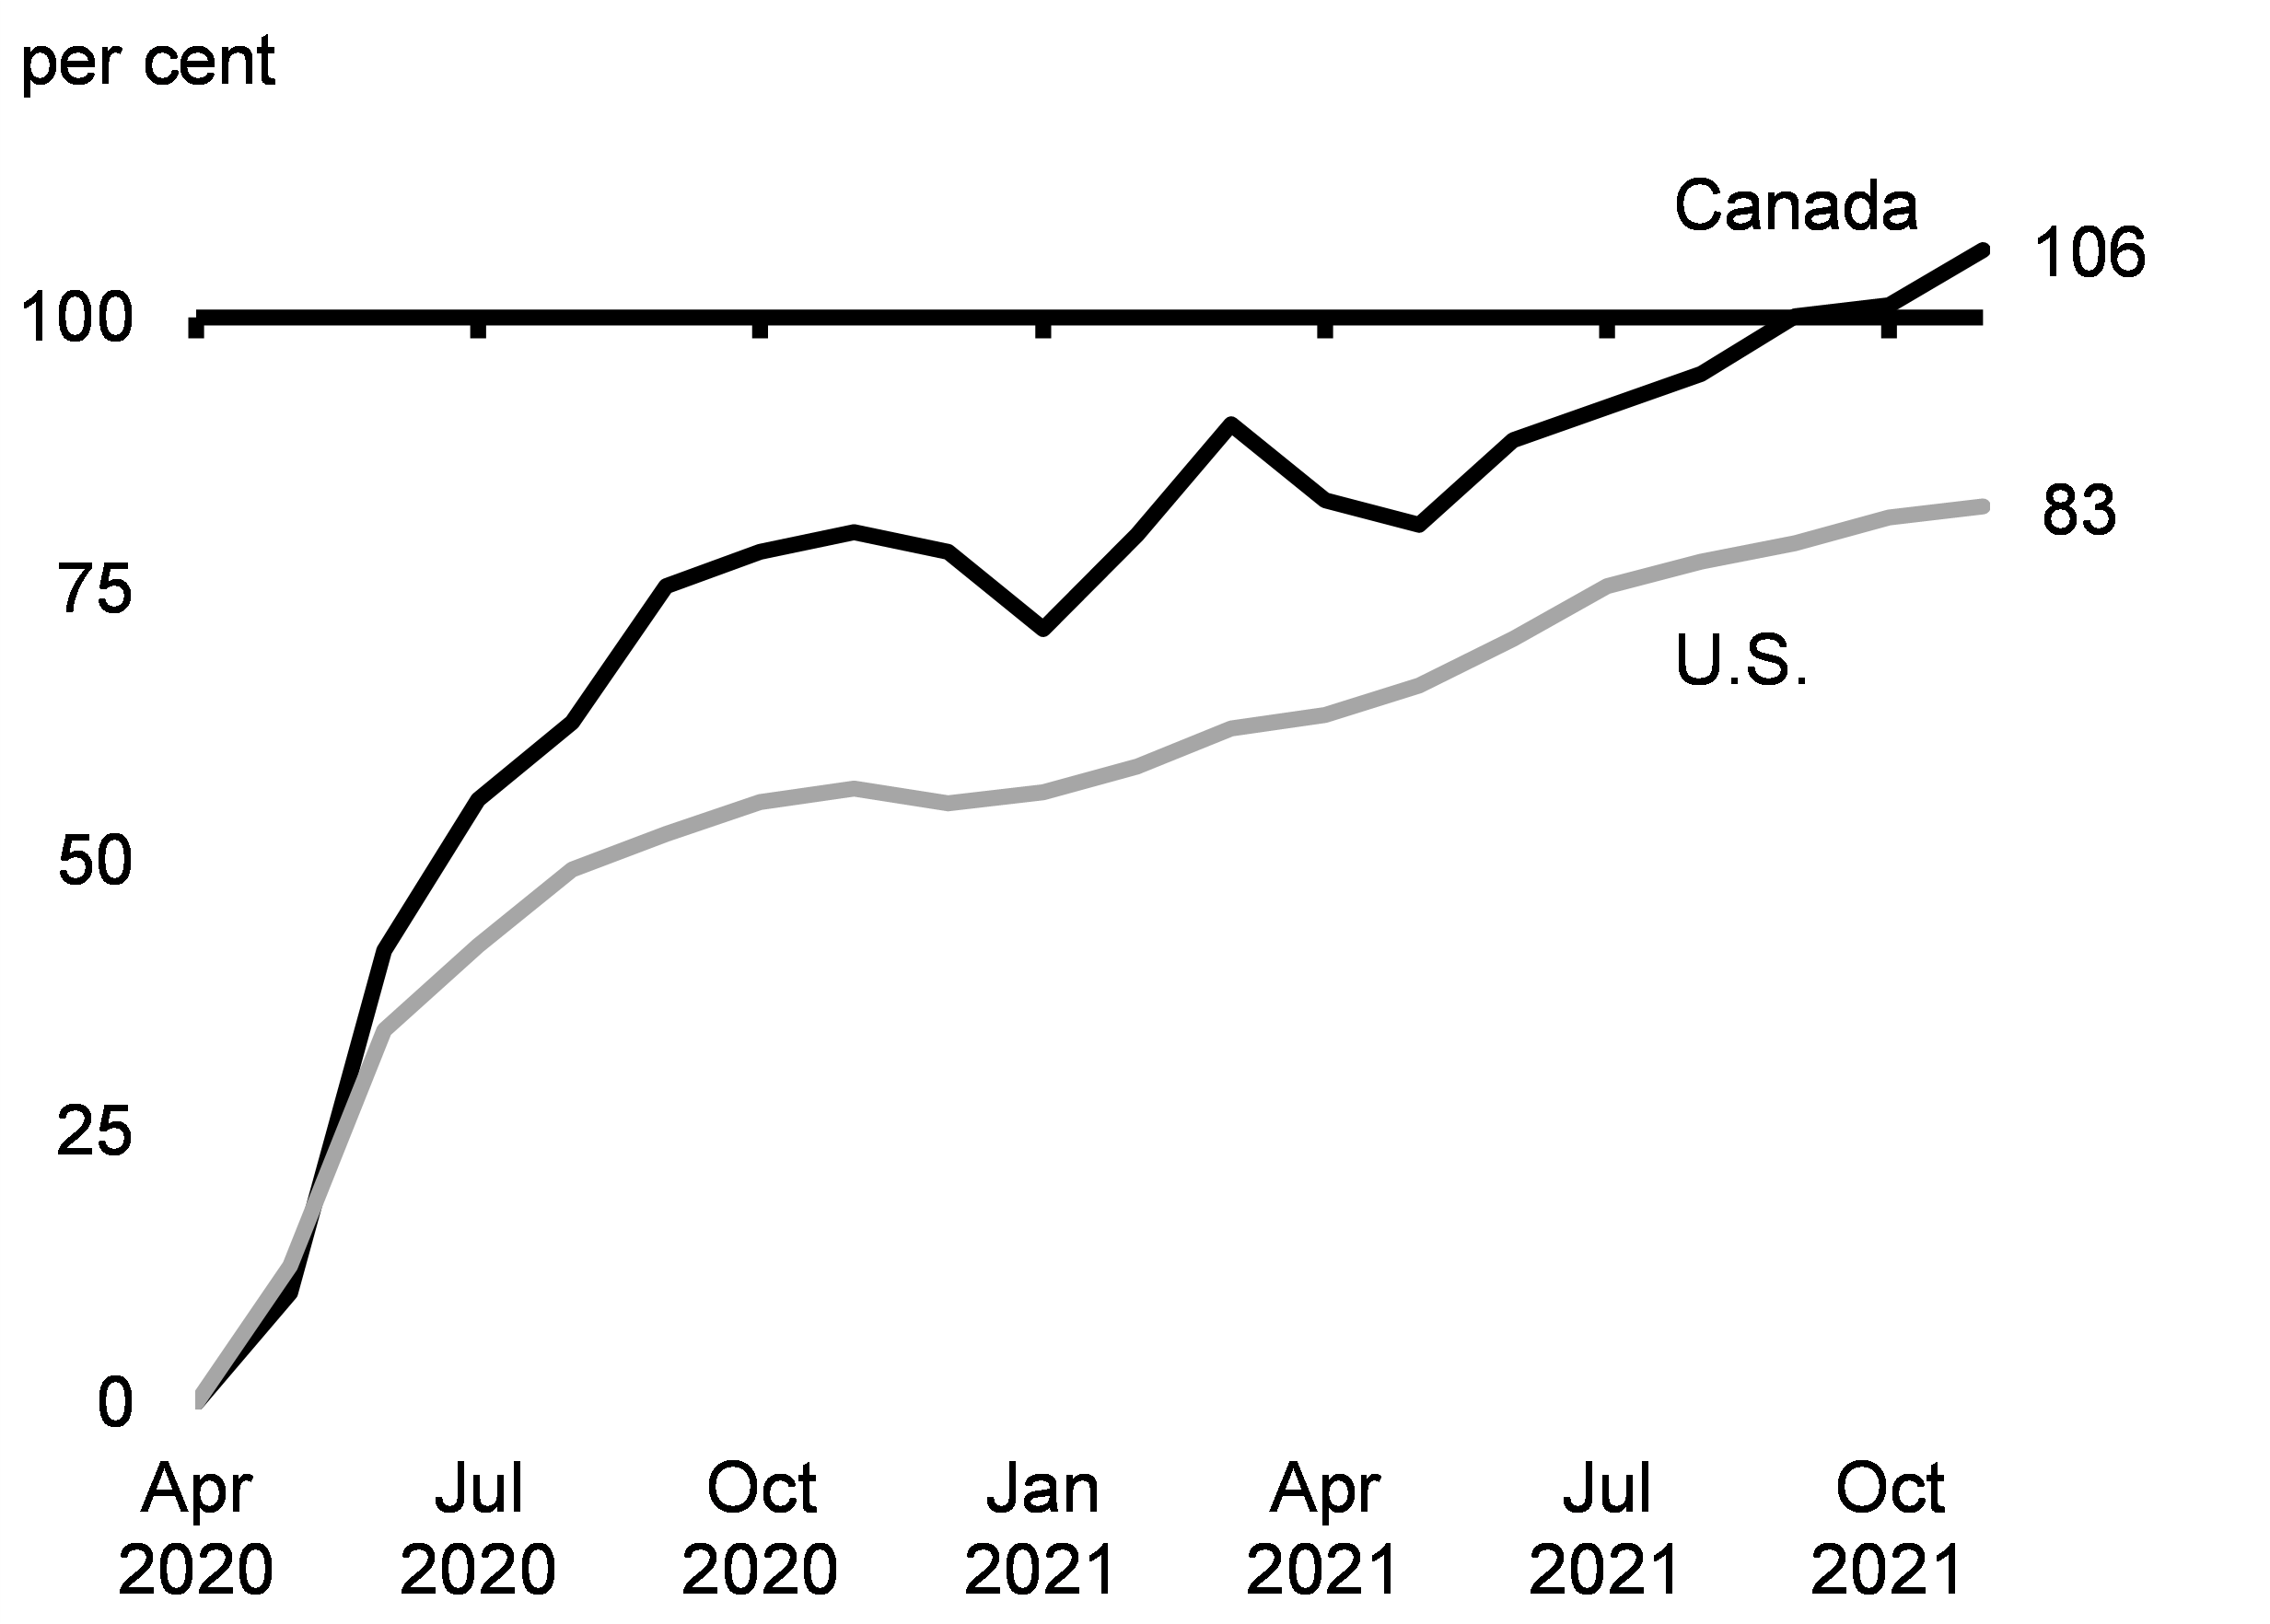
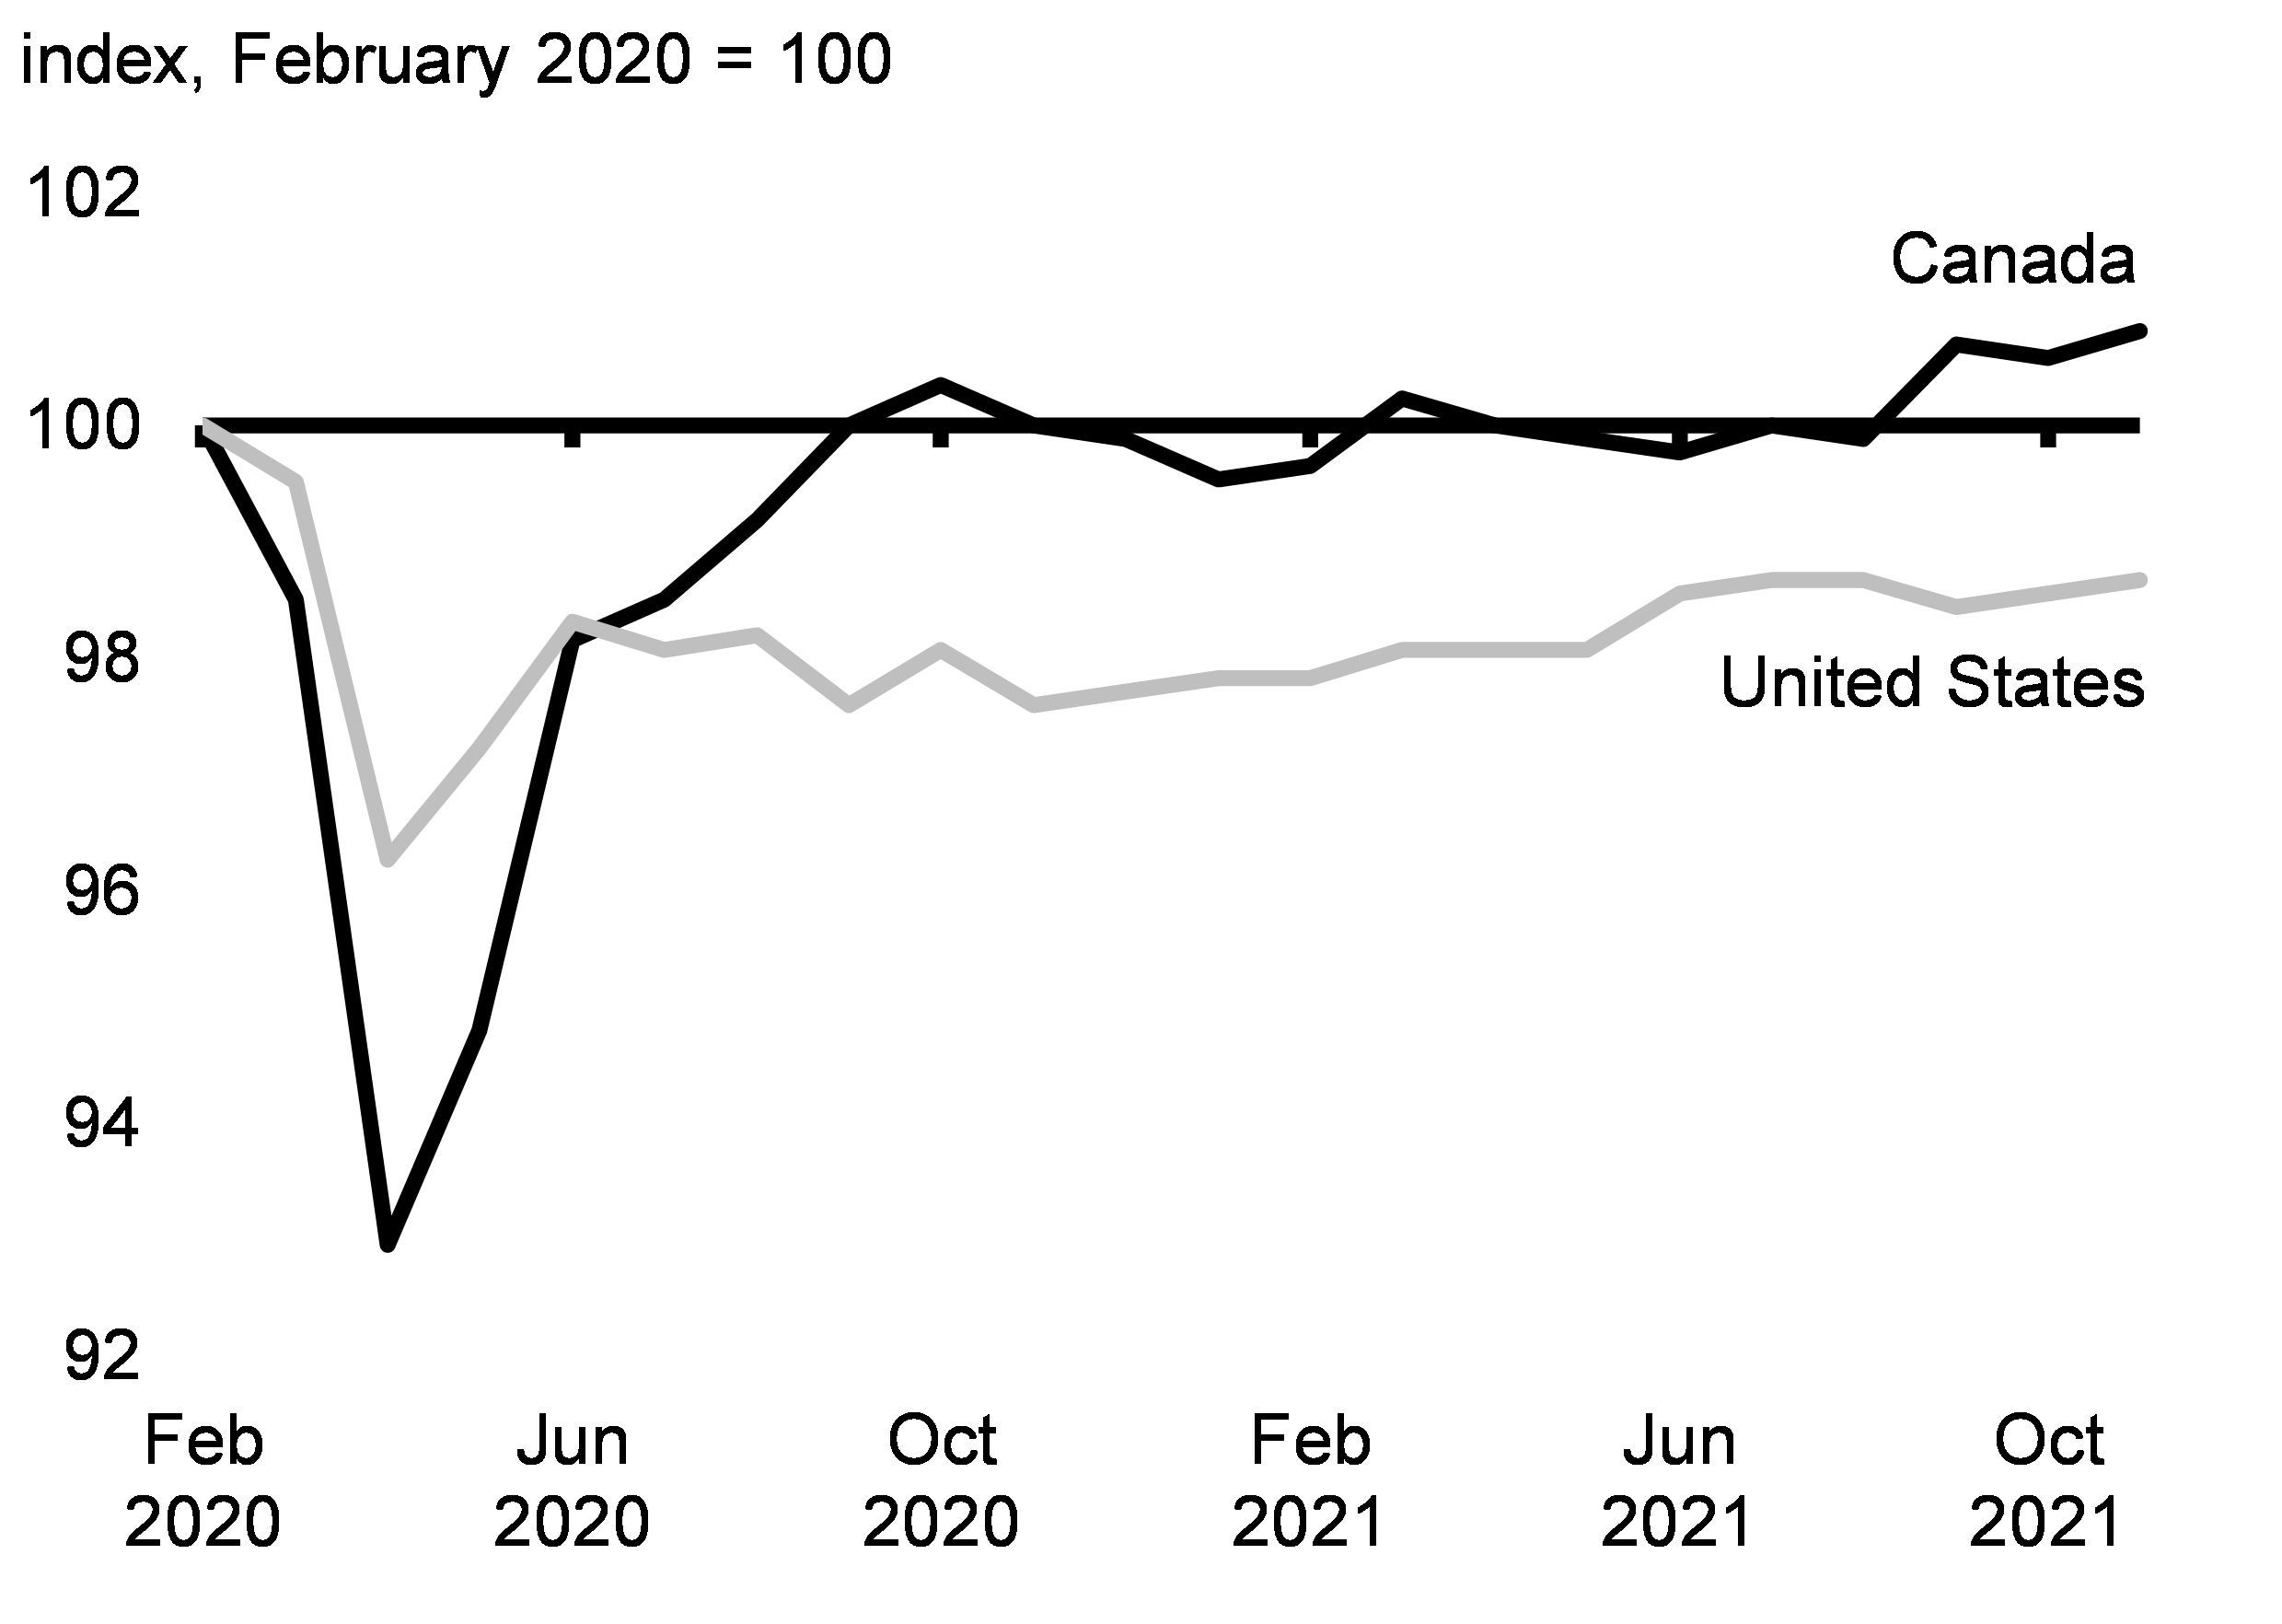
Compared to other G7 economies, Canada has seen the second fastest jobs recovery. In fact, many peer countries are still well below their pre-pandemic employment levels (Chart 2.5). Innovative Canadian pandemic policies like the Canada Emergency Wage Subsidy were able to preserve the connection between employees and employers, contributing to the strong jobs recovery. As of November, 106 per cent of the jobs lost at the peak of the pandemic have been recouped in Canada, which is well ahead of the U.S. where only 83 per cent of jobs have been recouped (Chart 2.6). The pace of job gains has also outpaced previous recessions, in particular the 2008-09 recession, where more modest government support and a quick return to austerity policies prolonged the economic downturn and led to economic scarring. It took nearly eight months longer for employment to recover from the 2008-09 recession, even though there were only about one-tenth as many job losses.
Change in Employment Across G7 Countries Relative to February 2020
Share of Employment Losses Recouped over the Pandemic
Conditions Are Improving for Vulnerable Workers
At the height of the pandemic, job losses were highest amongst those who, in many cases, could least afford it — low-income workers, racialized Canadians, new Canadians, and women. These vulnerable groups faced some of the steepest job losses, in large part due to their higher representation in hard-hit, close-contact sectors.
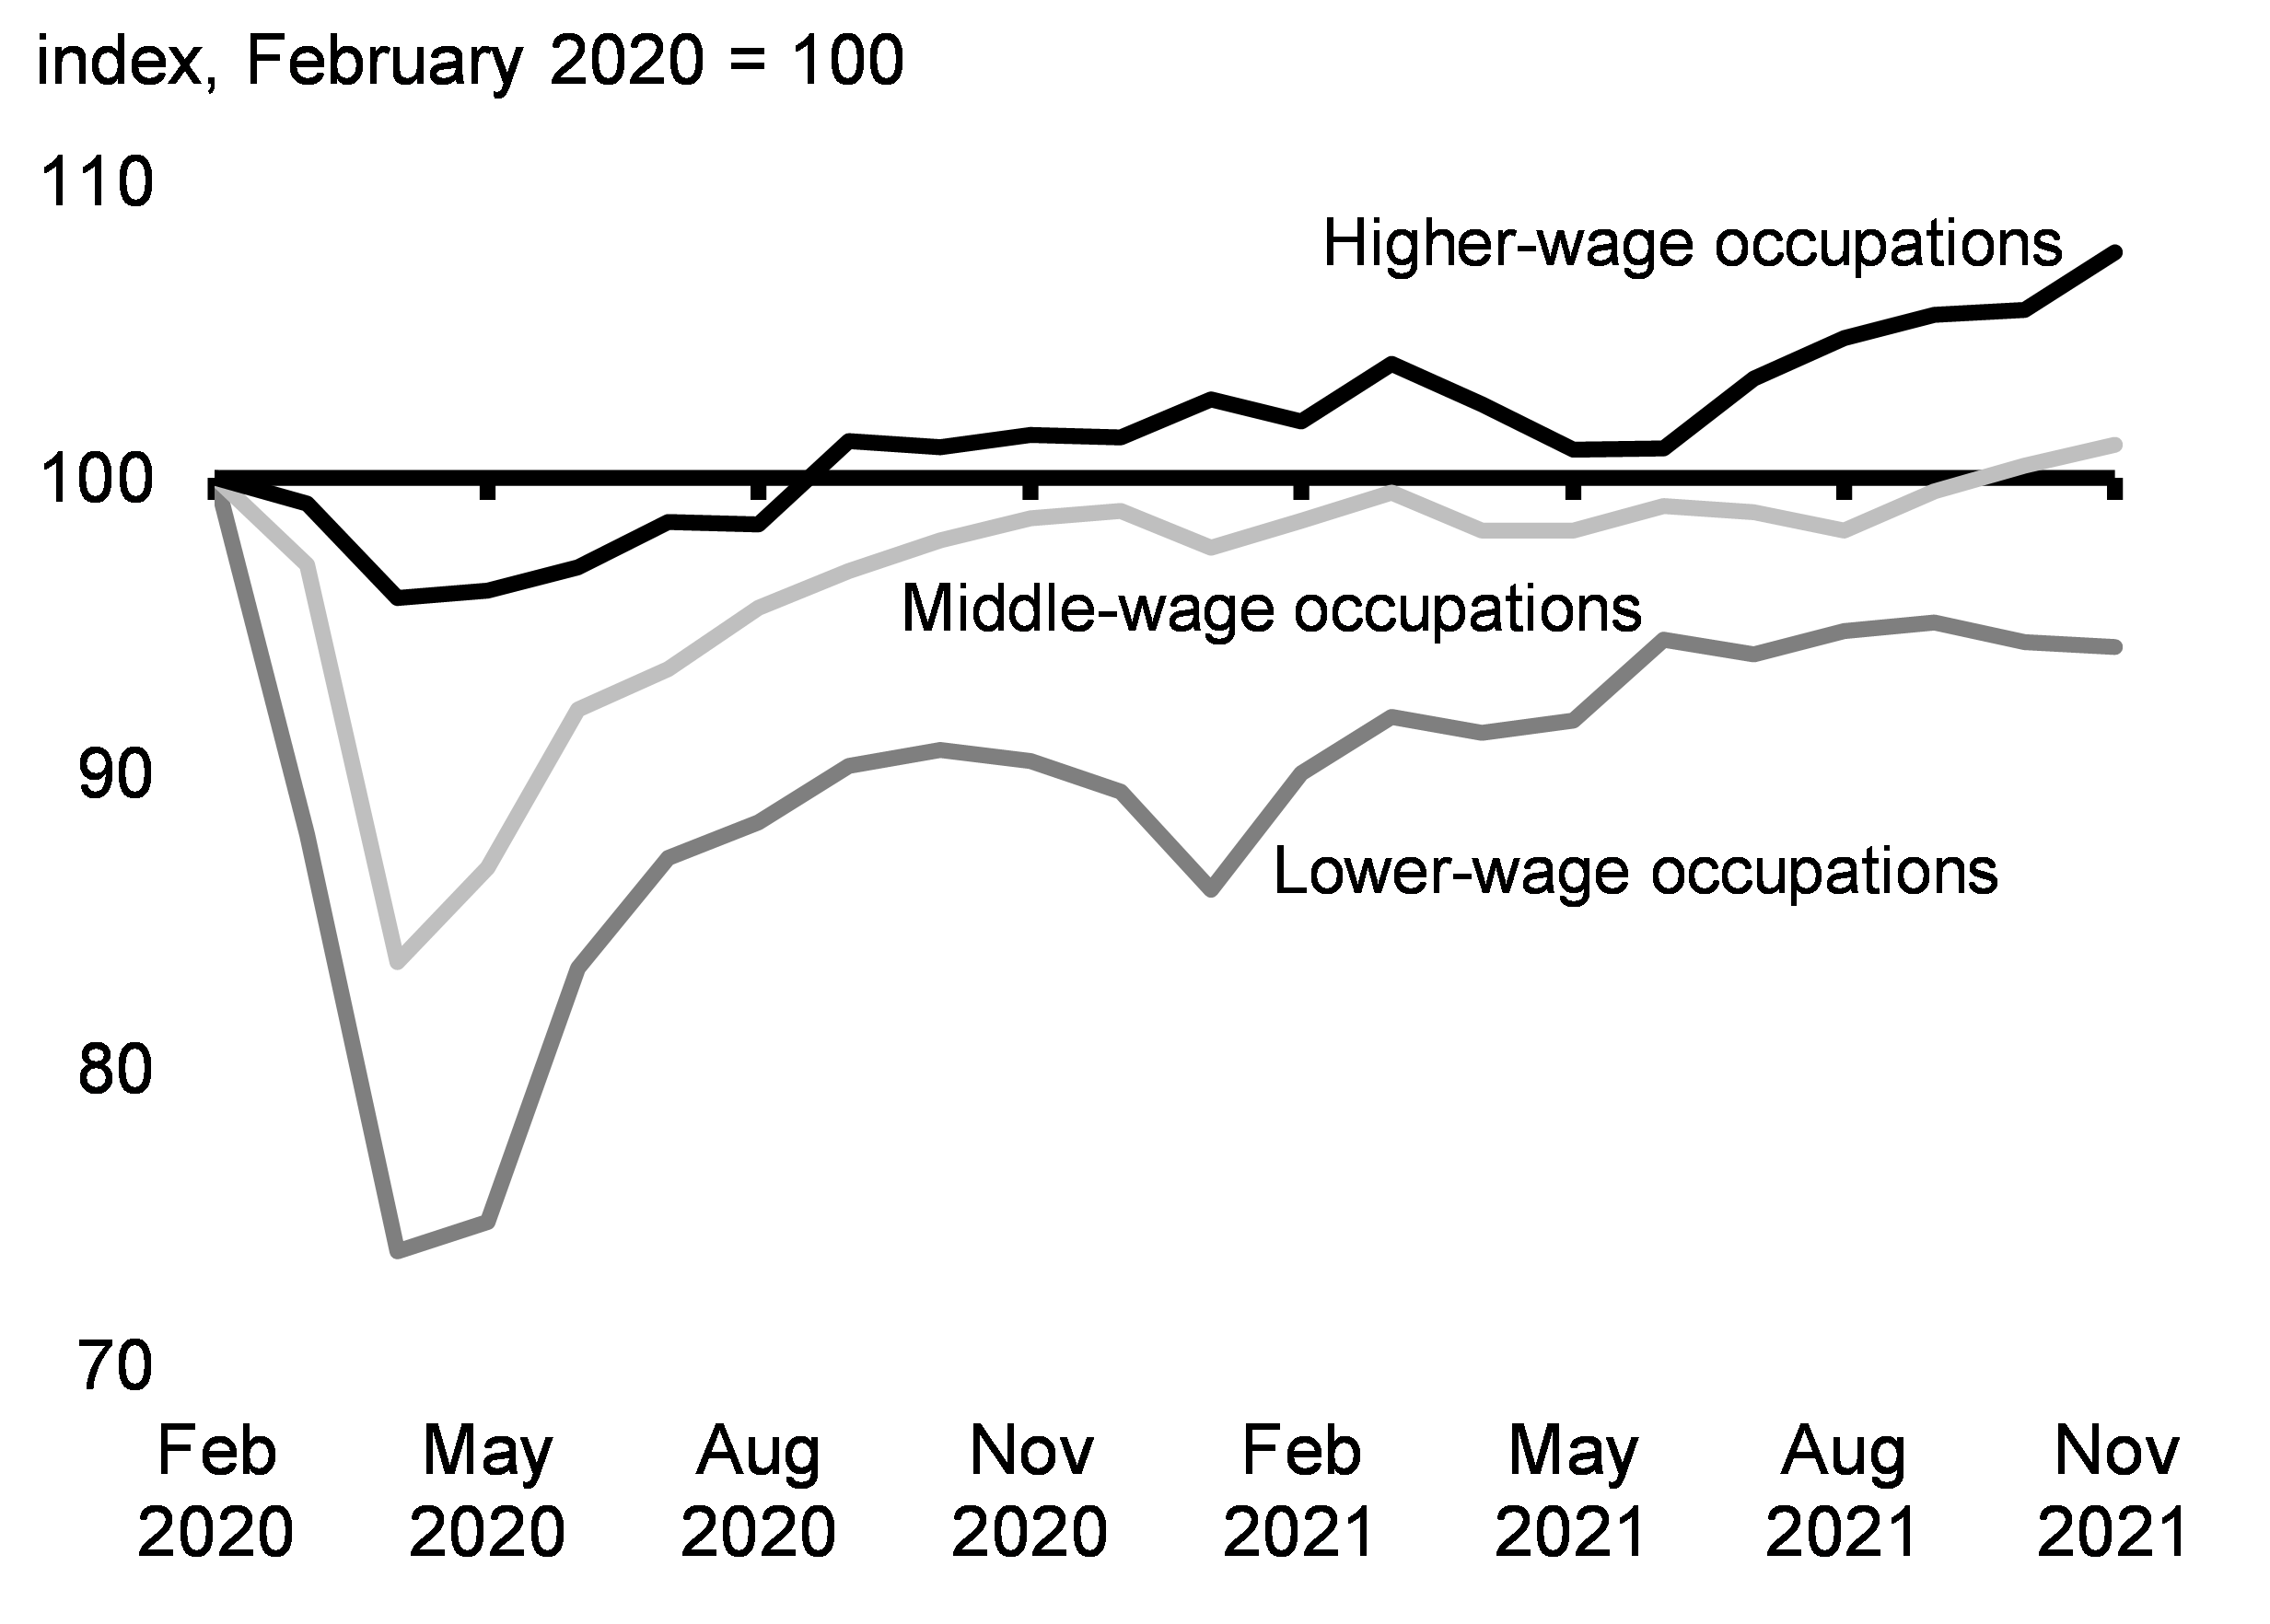
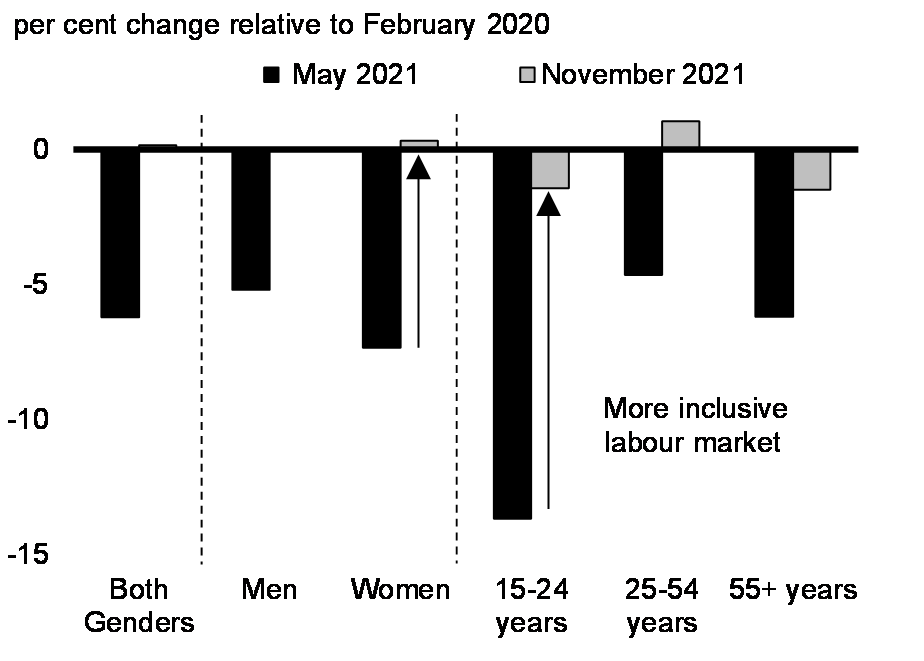
High vaccination rates have enabled the safe restart of close-contact businesses. This has led to sustained job creation and improved job prospects for Canada’s more vulnerable workers—particularly women, lower-wage workers, young people, and racialized workers (Charts 2.7 and 2.8). Furthermore, the reopening of schools and child care centres has helped parents, primarily mothers, return to the workforce more fully. These conditions have increased Canadians’ confidence in their labour market prospects. In fact, the share of Canadians aged 15 to 64 attached to the job market has reached a record high, including for women, in contrast with the U.S. where labour force participation for this group remains below its pre-pandemic level.
Employment Change by Wage Level Since February 2020
Workers Affected by COVID-19 by Age and Sex
Ongoing Labour Market Recovery
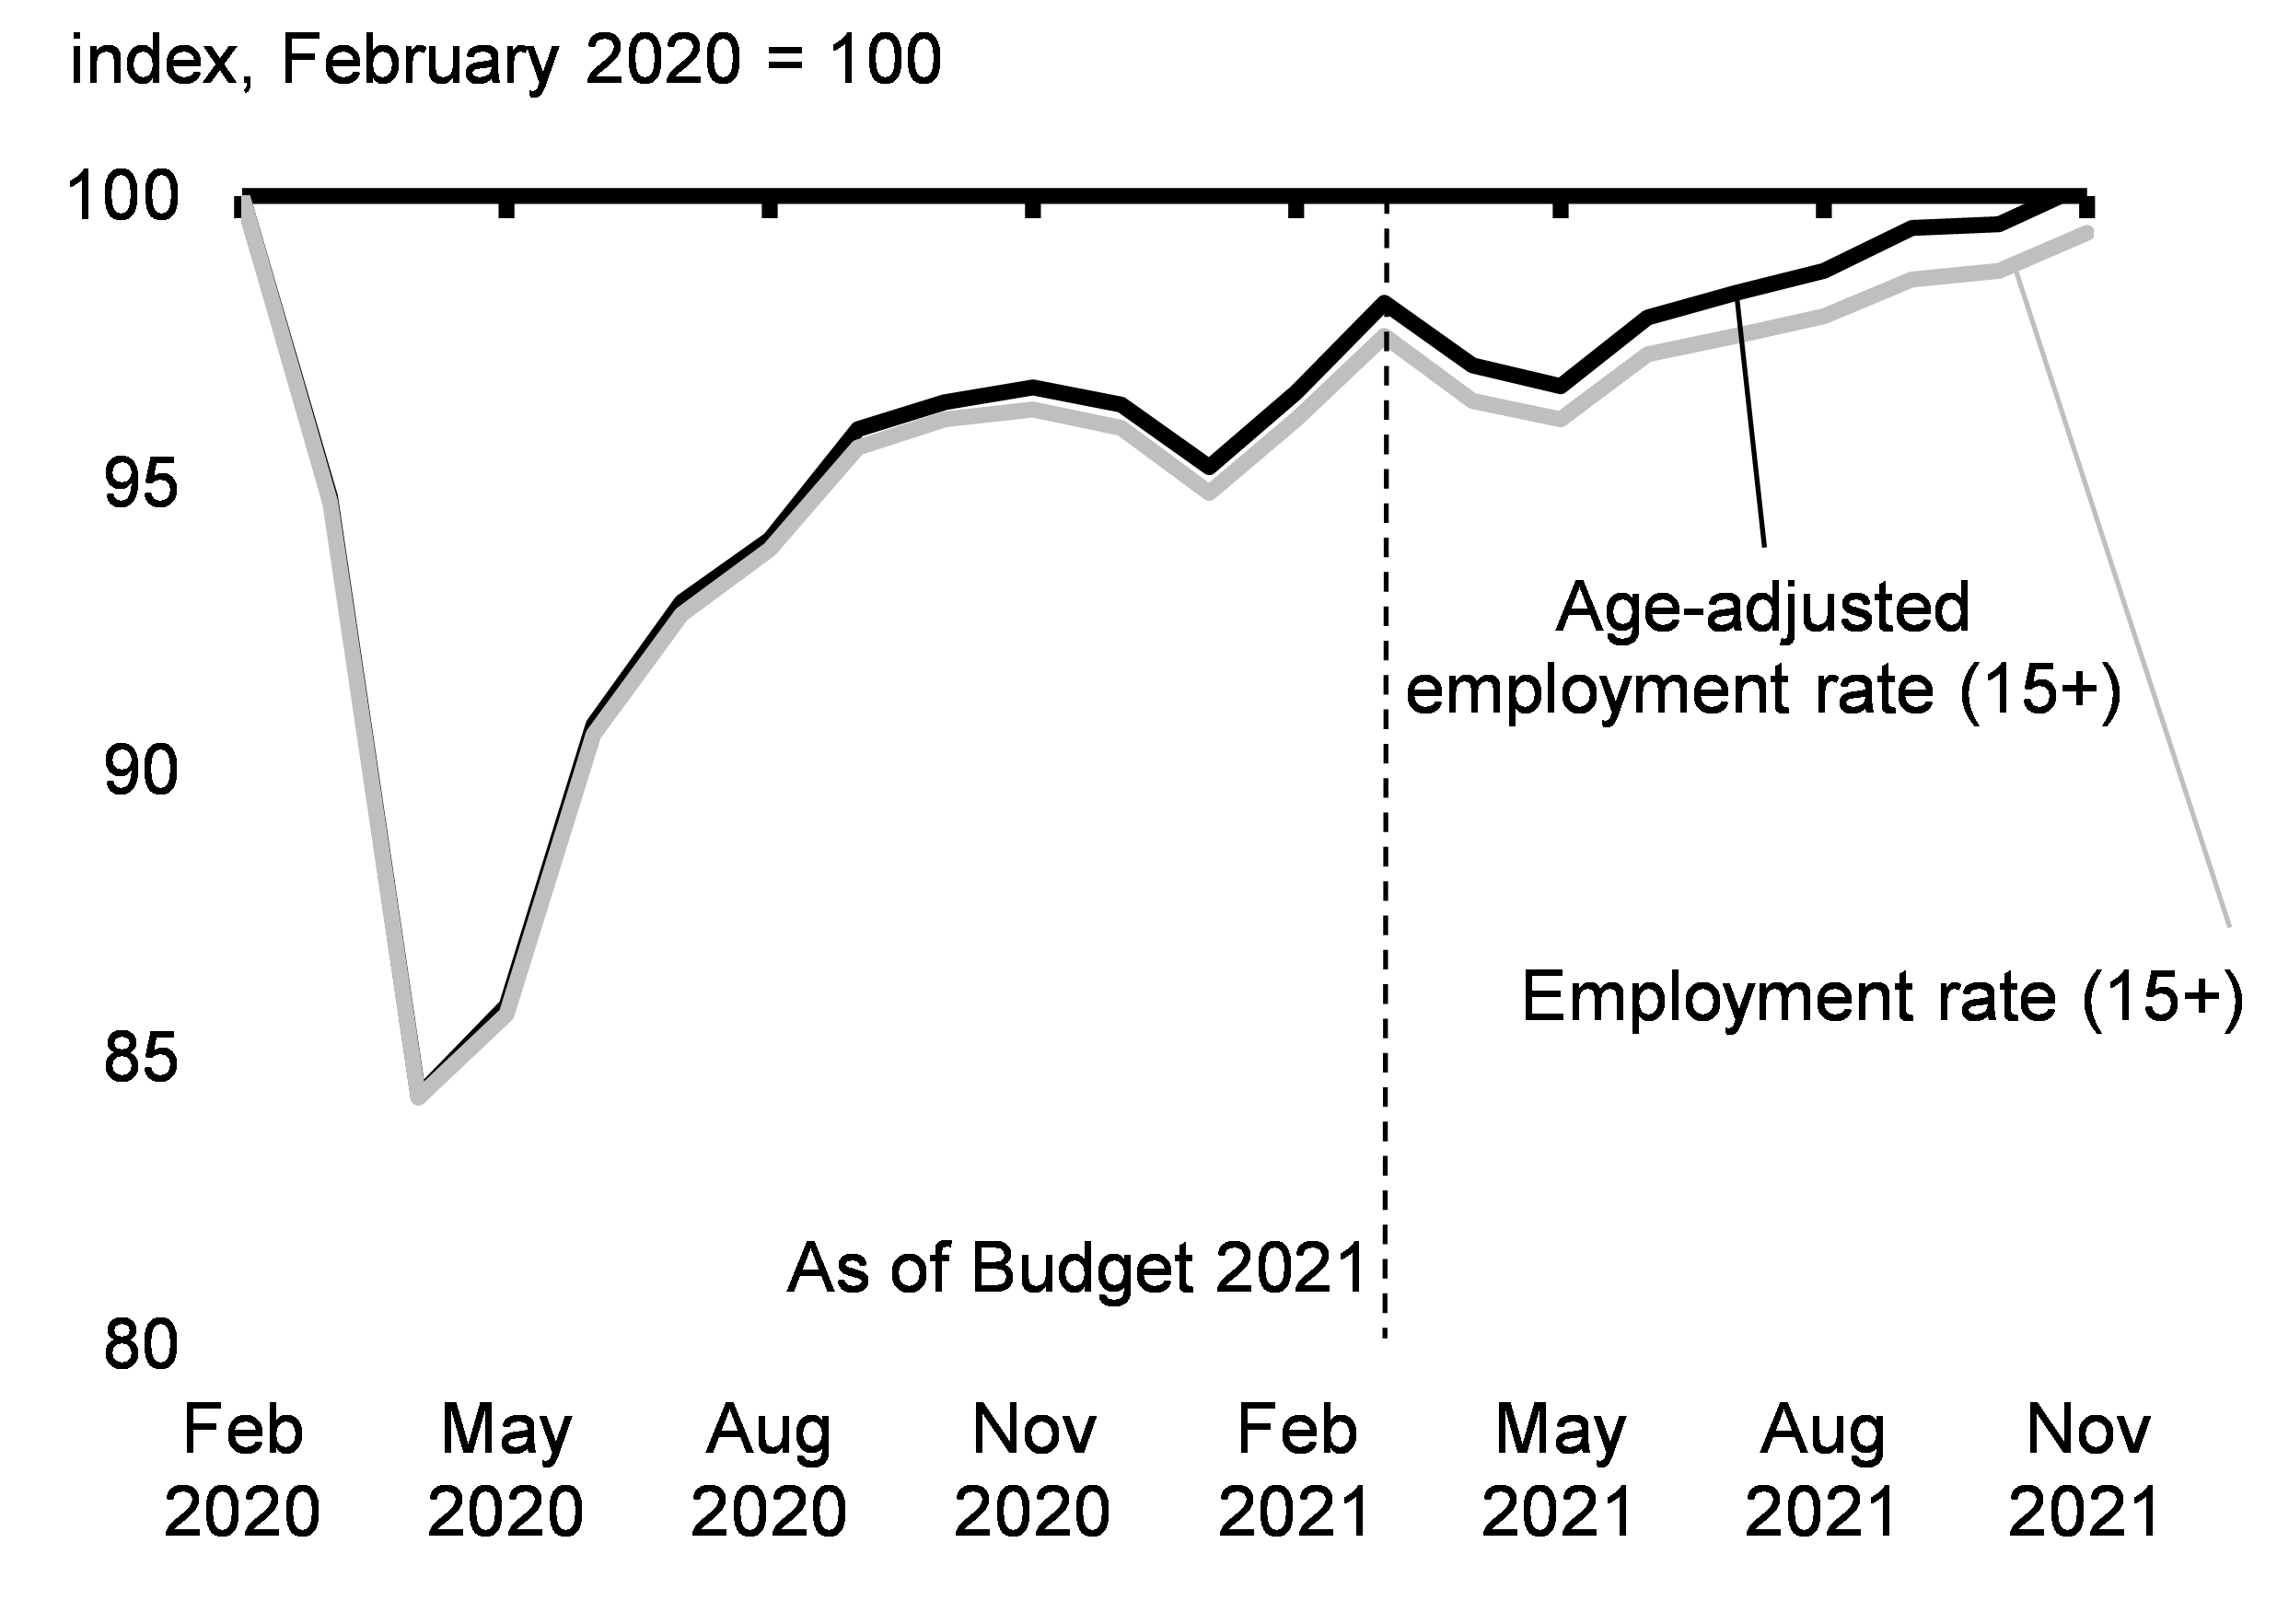
As announced in the Fall Economic Statement 2020 and reaffirmed in Budget 2021, the government tracks a range of economic indicators to assess the strength of the recovery and the impact of fiscal policy support. These indicators include key measures of labour market conditions like the employment rate, total hours worked, and the unemployment rate. Progress is tracked at both the headline level and through a disaggregated view of how diverse groups of Canadians are faring in the labour market.
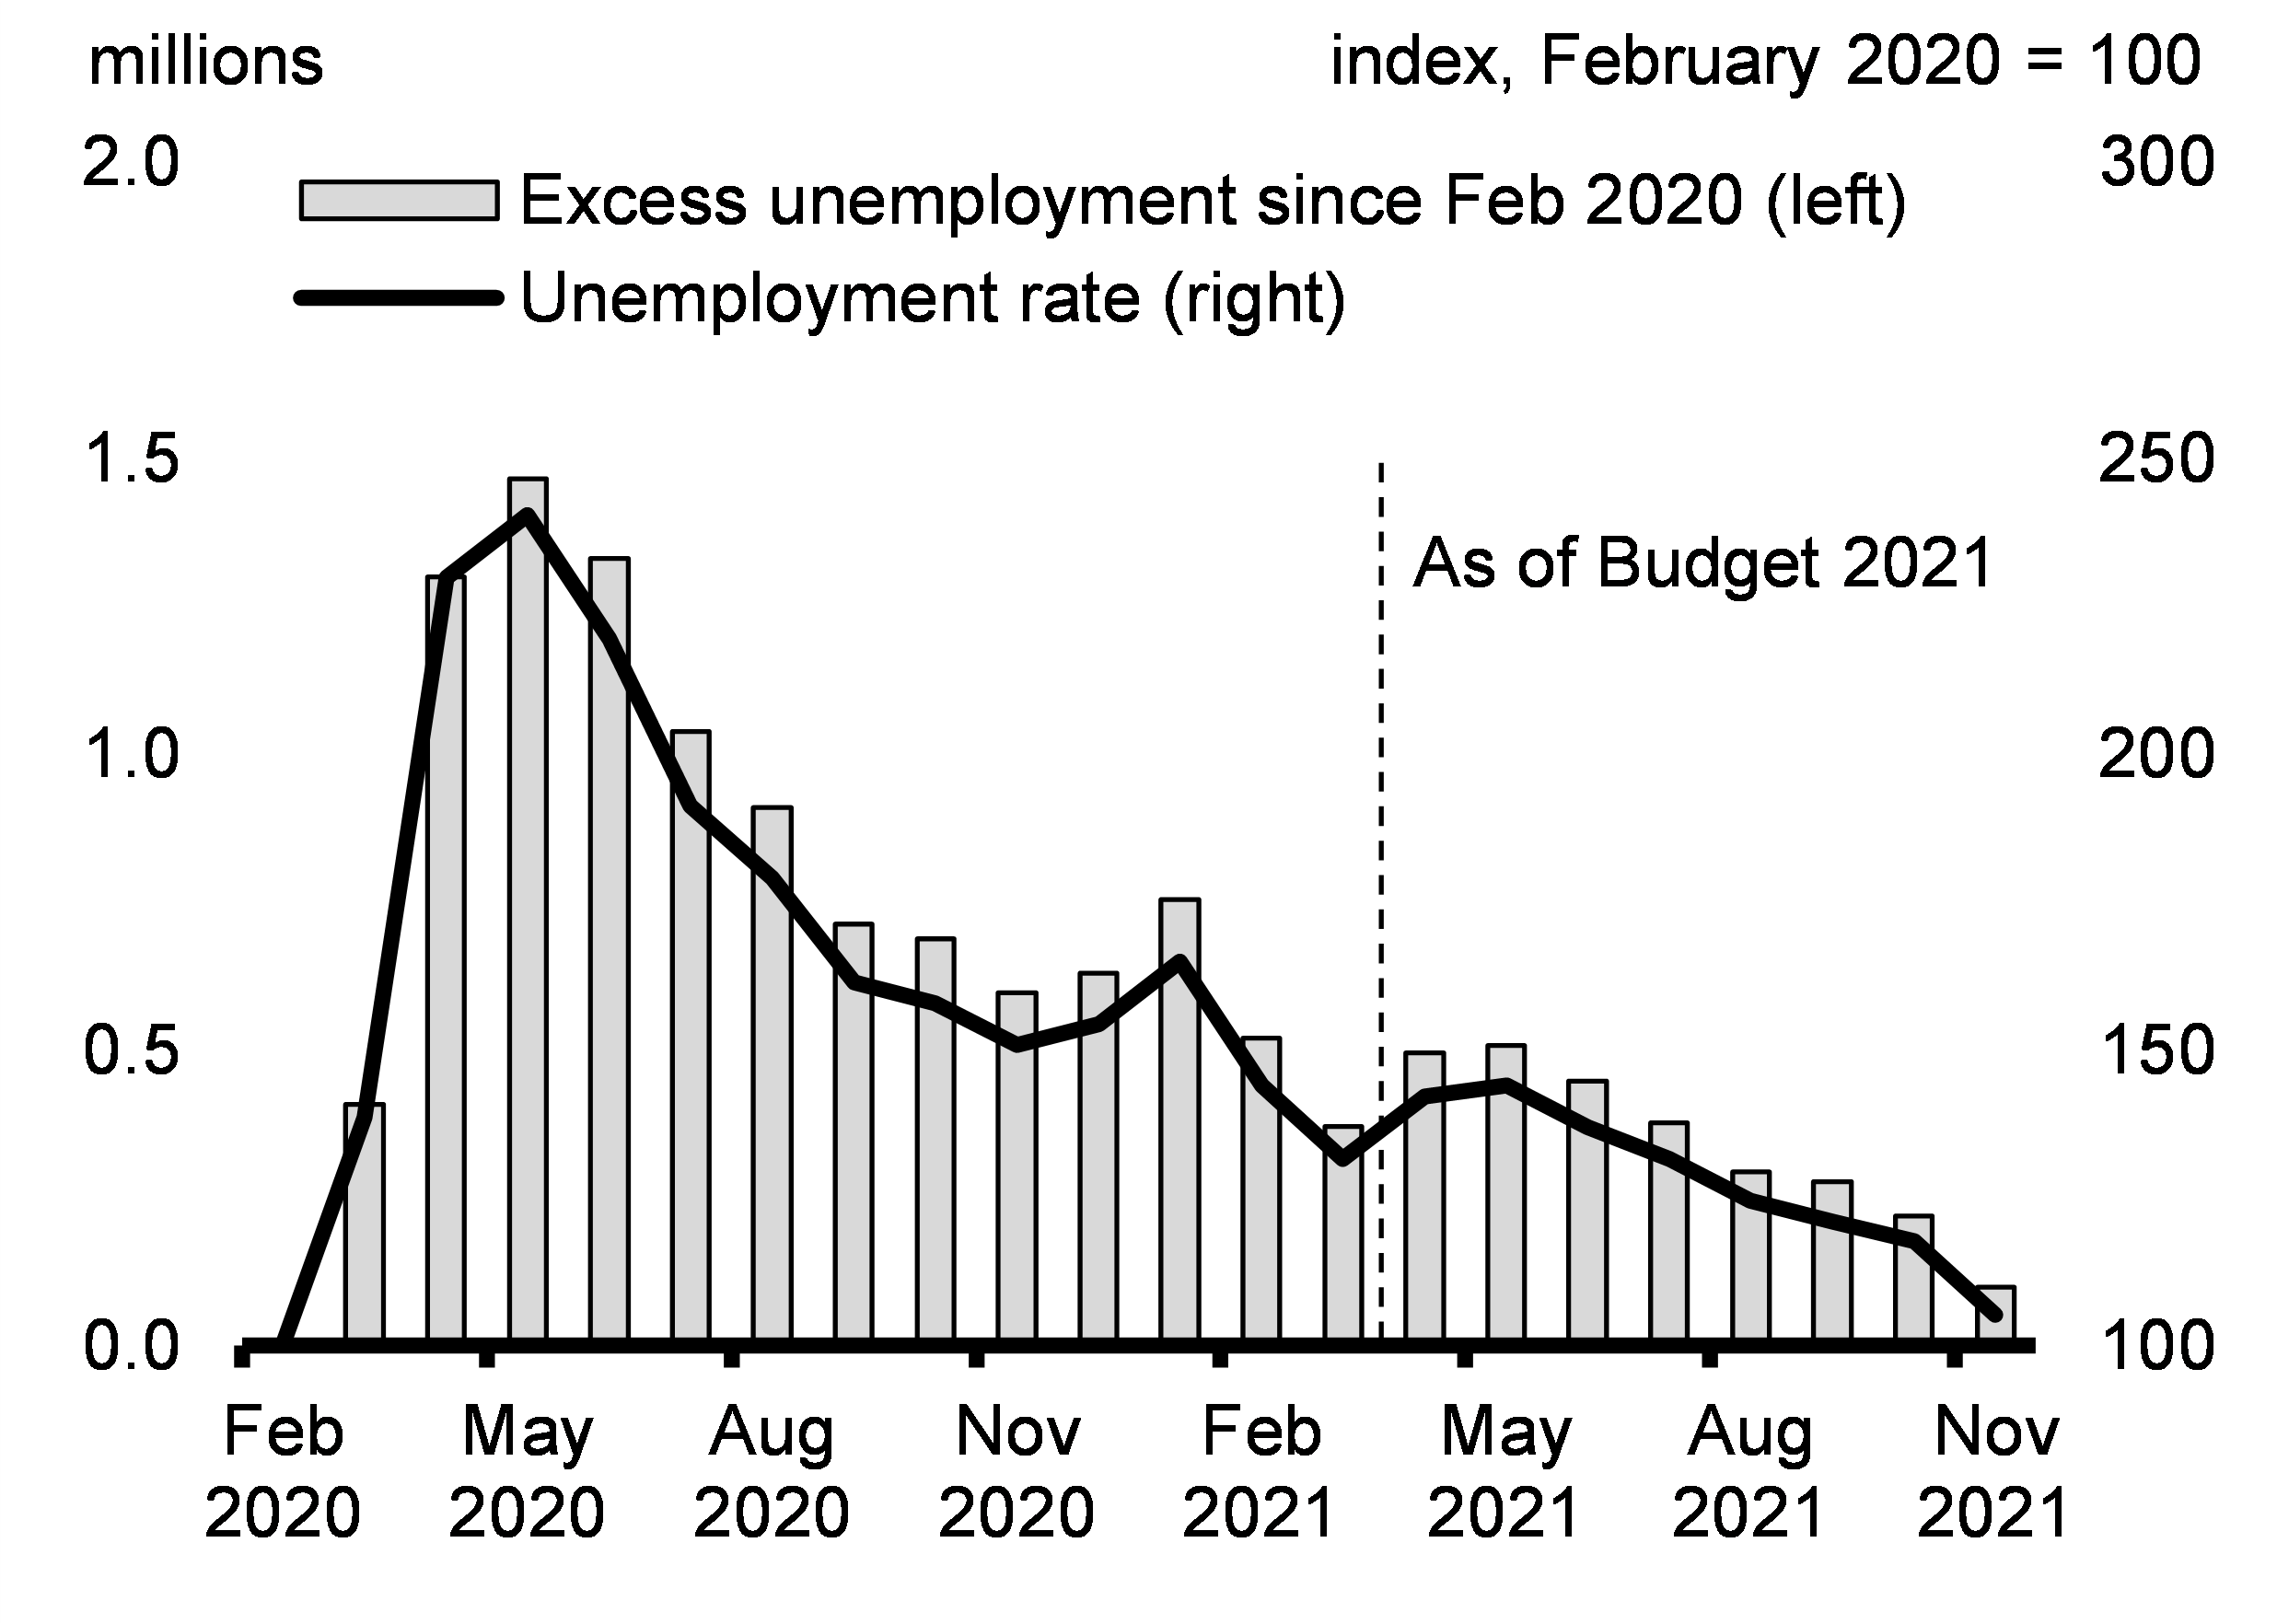
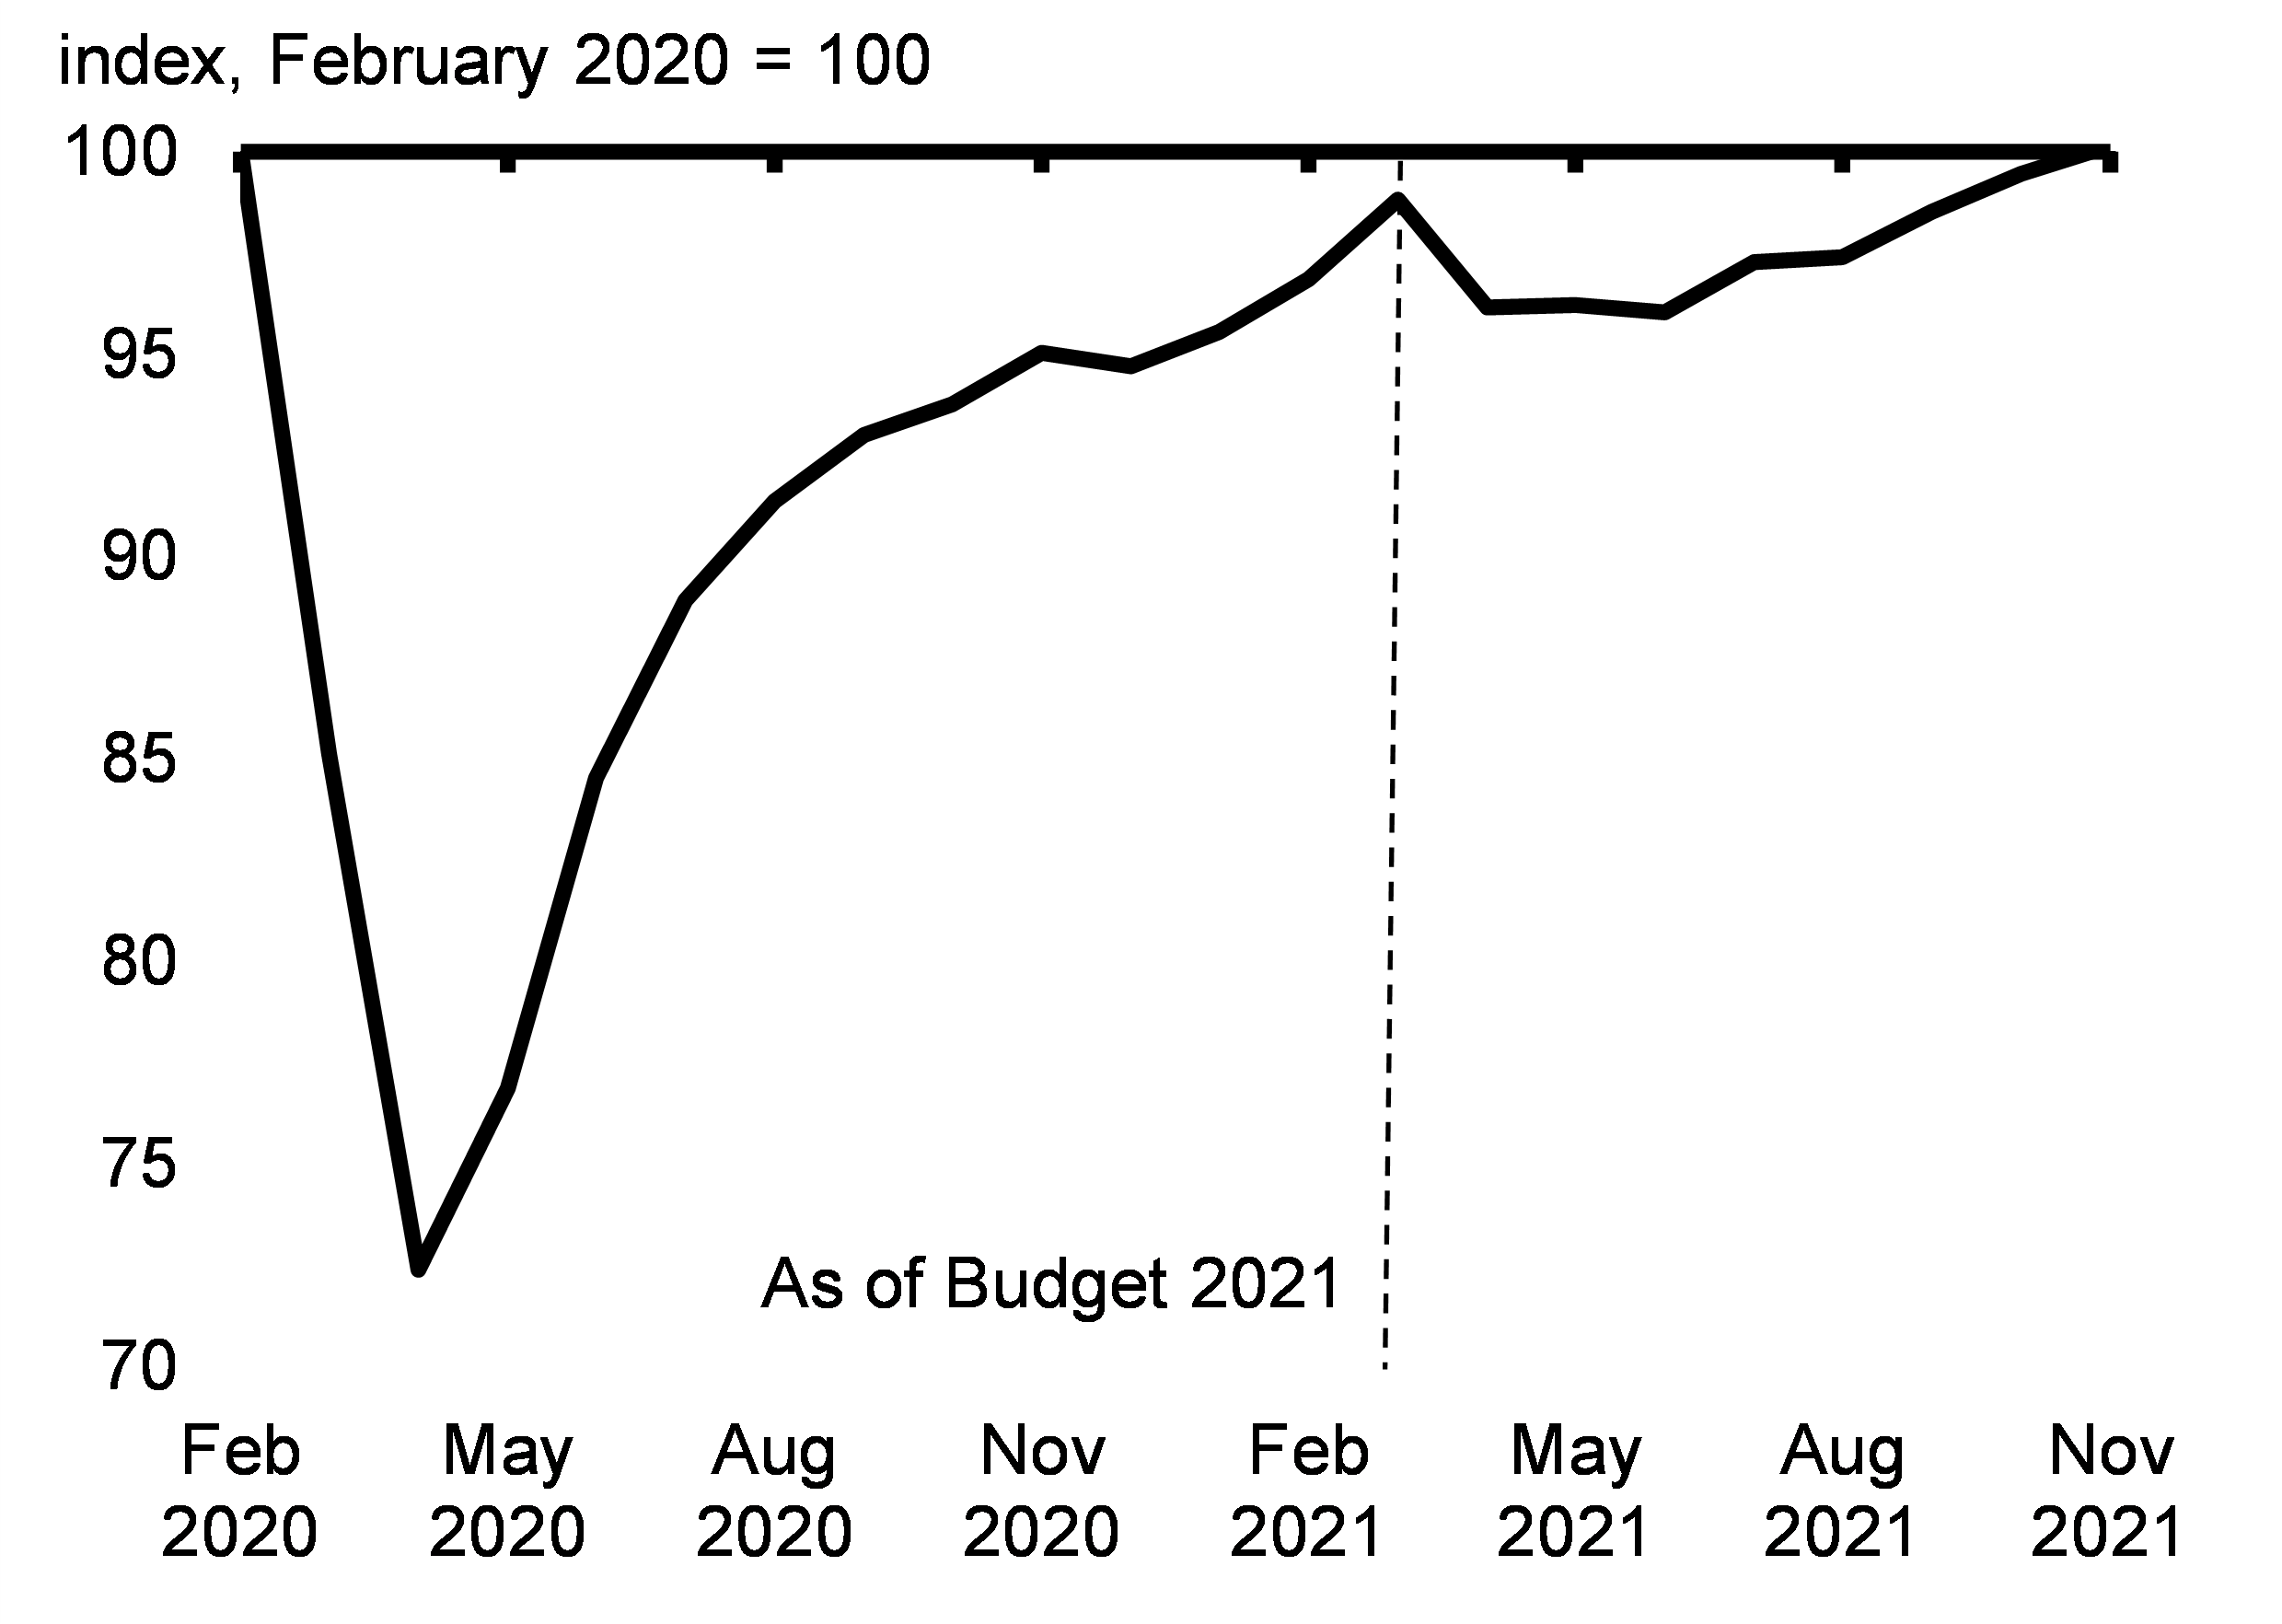
Canada’s economy has made significant progress since Budget 2021. However, Canada still has ground to make up to reach the strong and inclusive conditions seen before the pandemic (Charts 2.9 to 2.12). The number of Canadians who have been unemployed for more than six months remains elevated. Prolonged spells of unemployment can lead to individuals withdrawing from the workforce entirely as their skills erode, which can have lasting impacts on earnings potential.
Employment Rate
Unemployment
Total Hours Worked
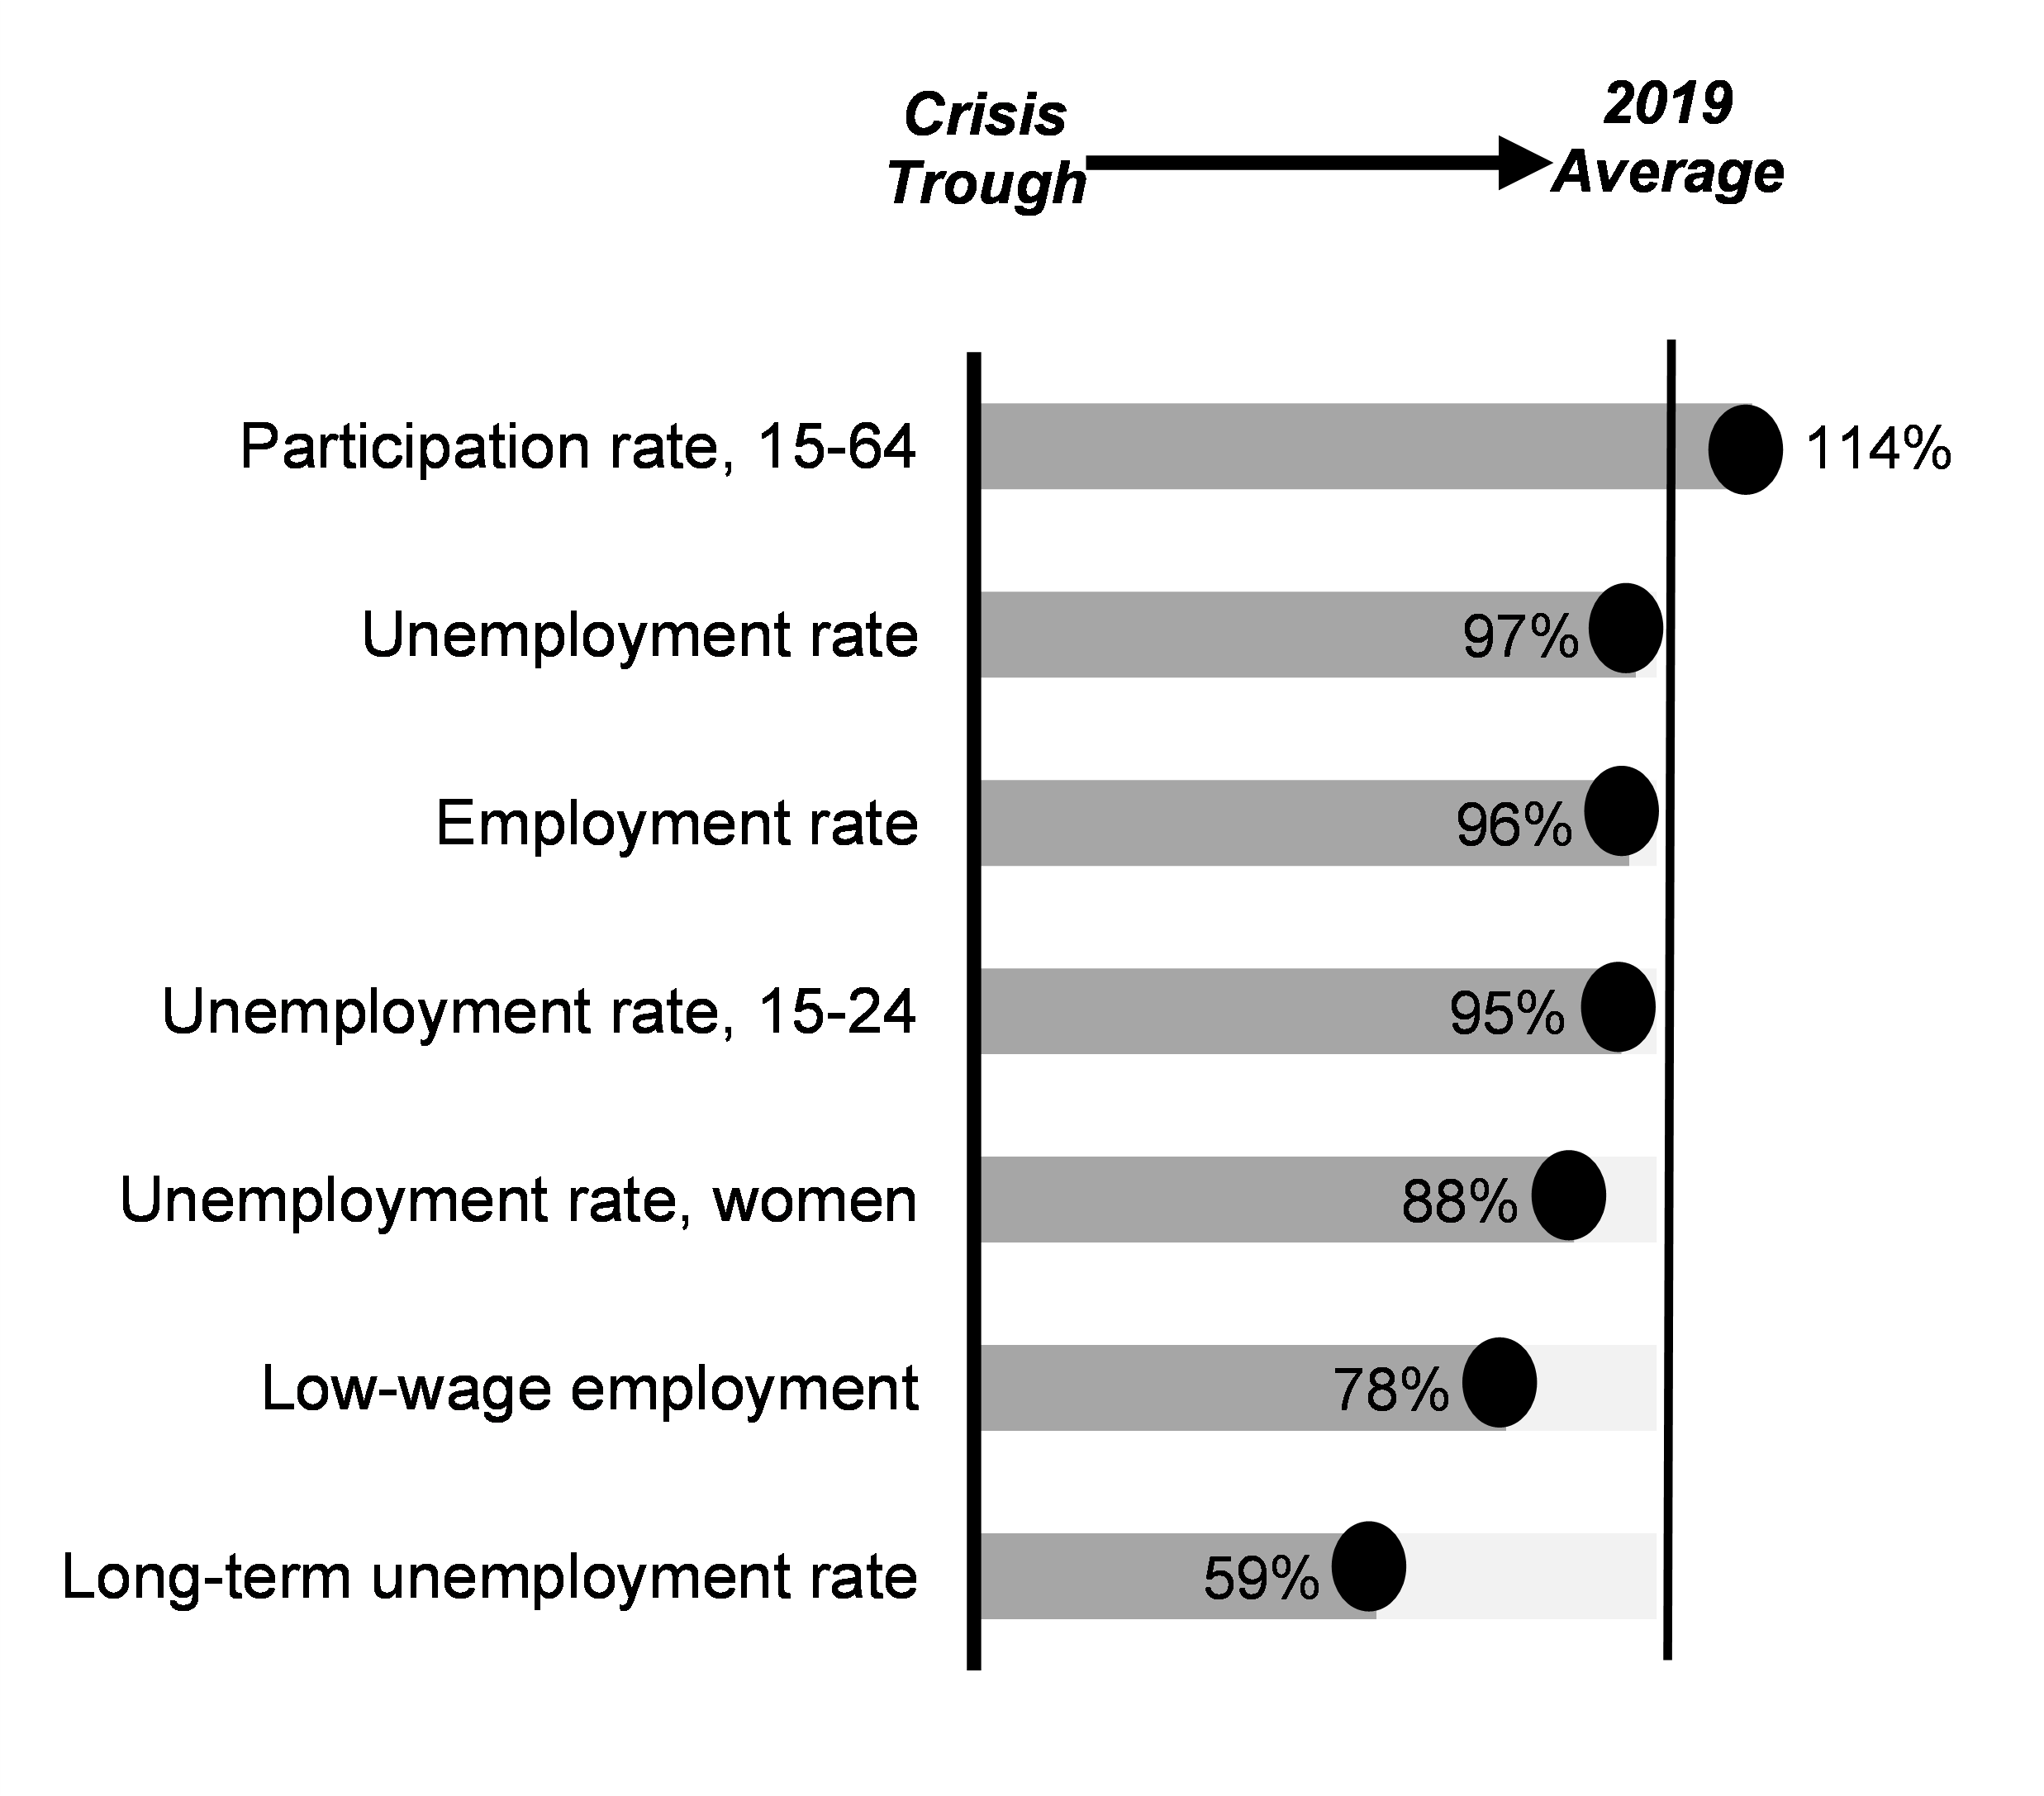
Progress on Key Labour Market Metrics
Labour Market Recovery is Progressing
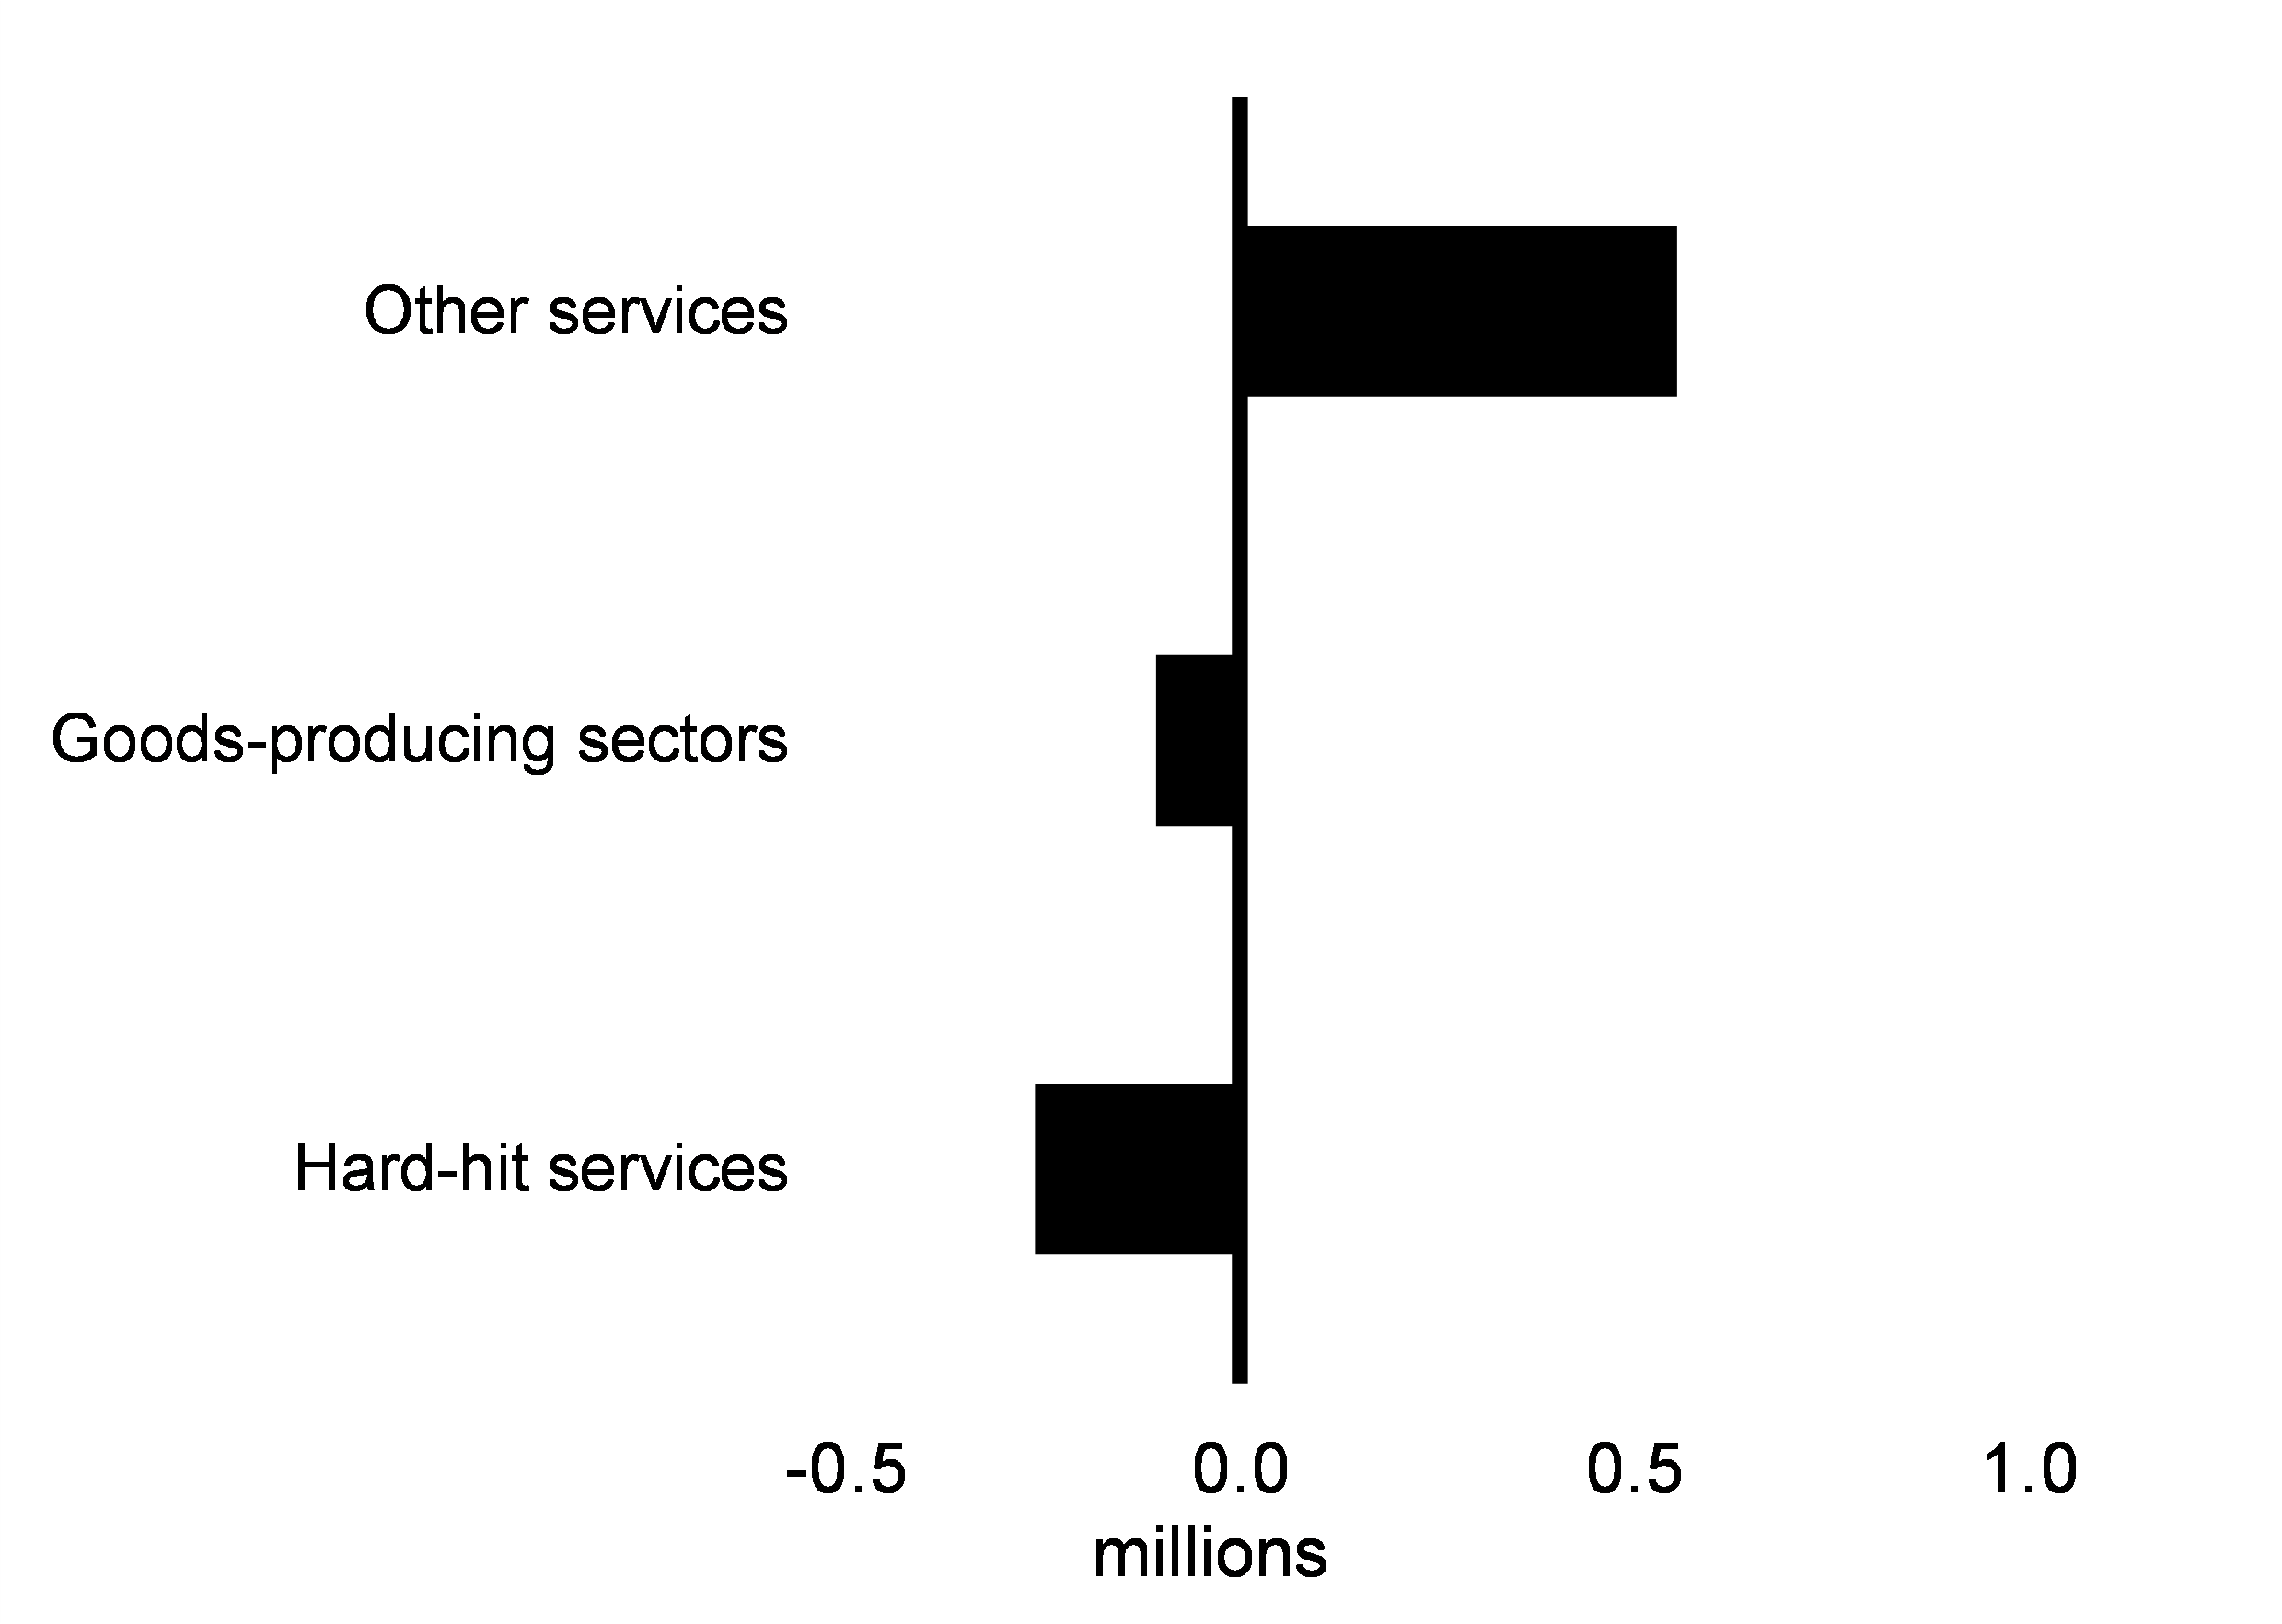
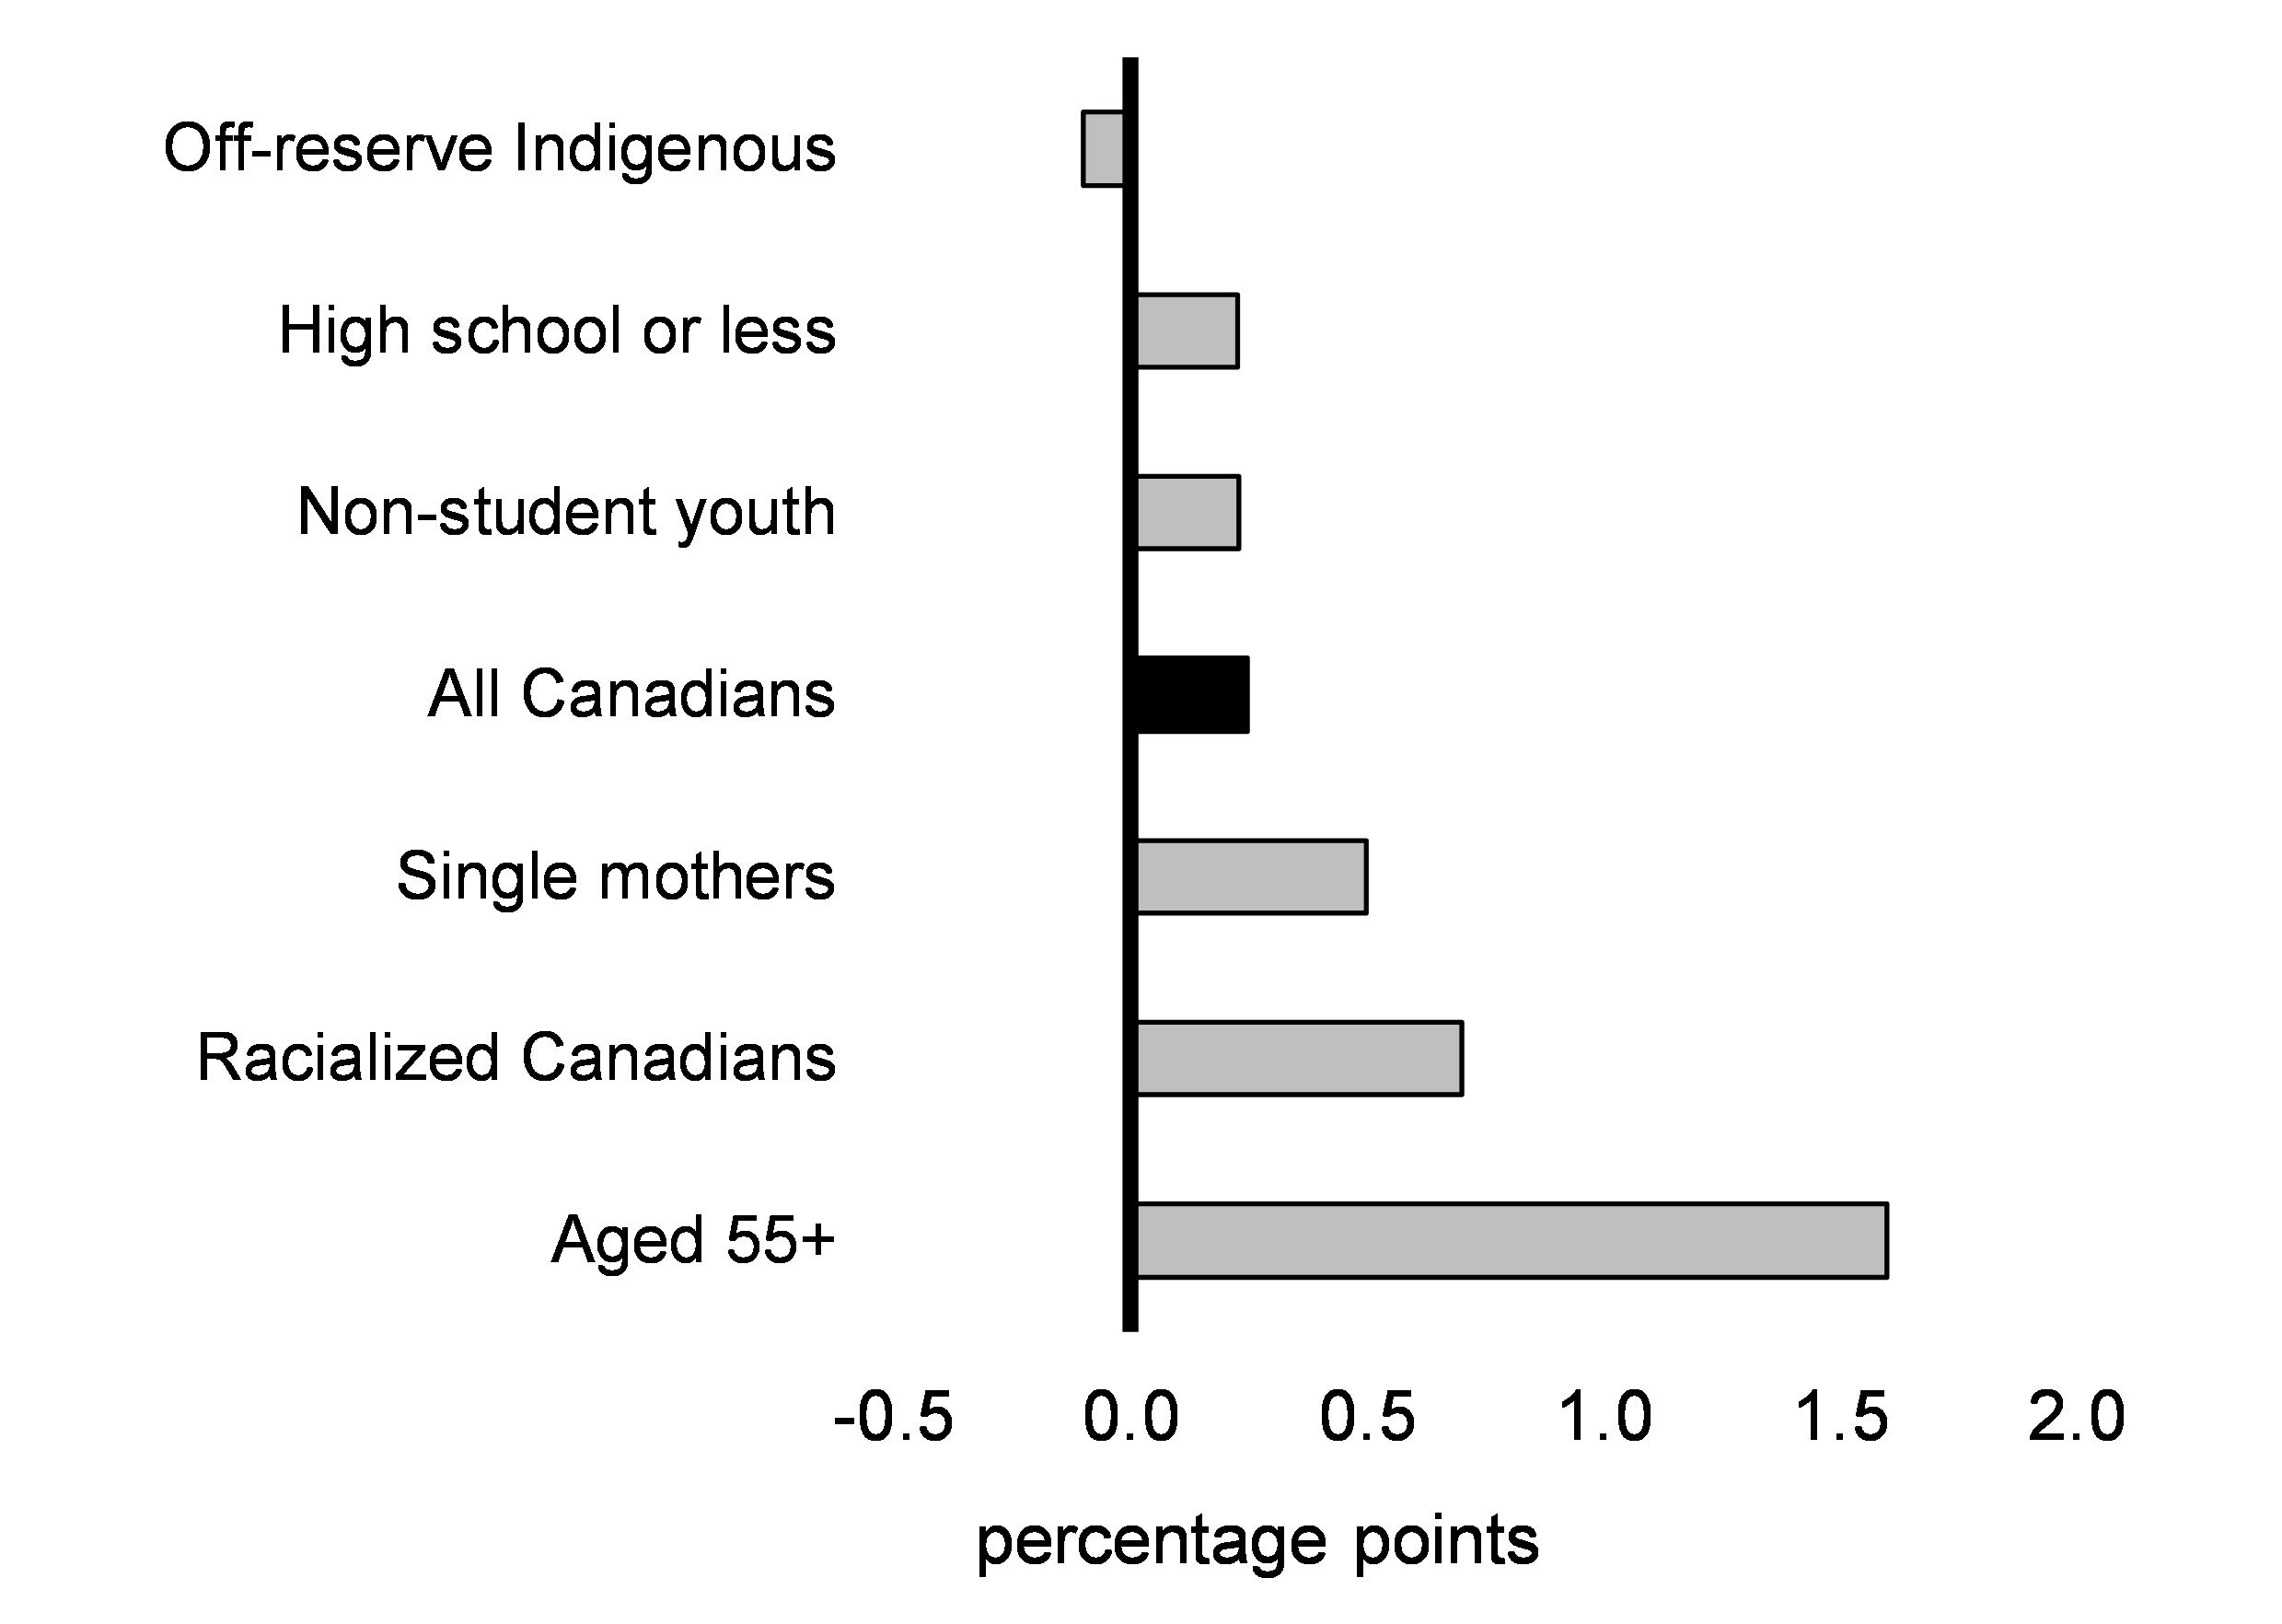
Despite encouraging improvements, conditions have not yet returned to normal. Economic activity and employment remain below pre-pandemic levels in many close-contact and tourism-dependent sectors, necessitating ongoing support (Chart 2.13). Achieving a full recovery will take some time. About 155,000 Canadians are still working sharply reduced hours as a result of the pandemic and long-term unemployment remains elevated. And while vulnerable groups who suffered the largest job losses have mostly recovered from the crisis, unemployment rates for some groups remain elevated (Chart 2.14).
Change in Employment by Key Sector Since February 2020
Change in Unemployment Rate Since November 2019, by Selected Groups
Ongoing Recovery Accompanied by Strong Demand for Workers
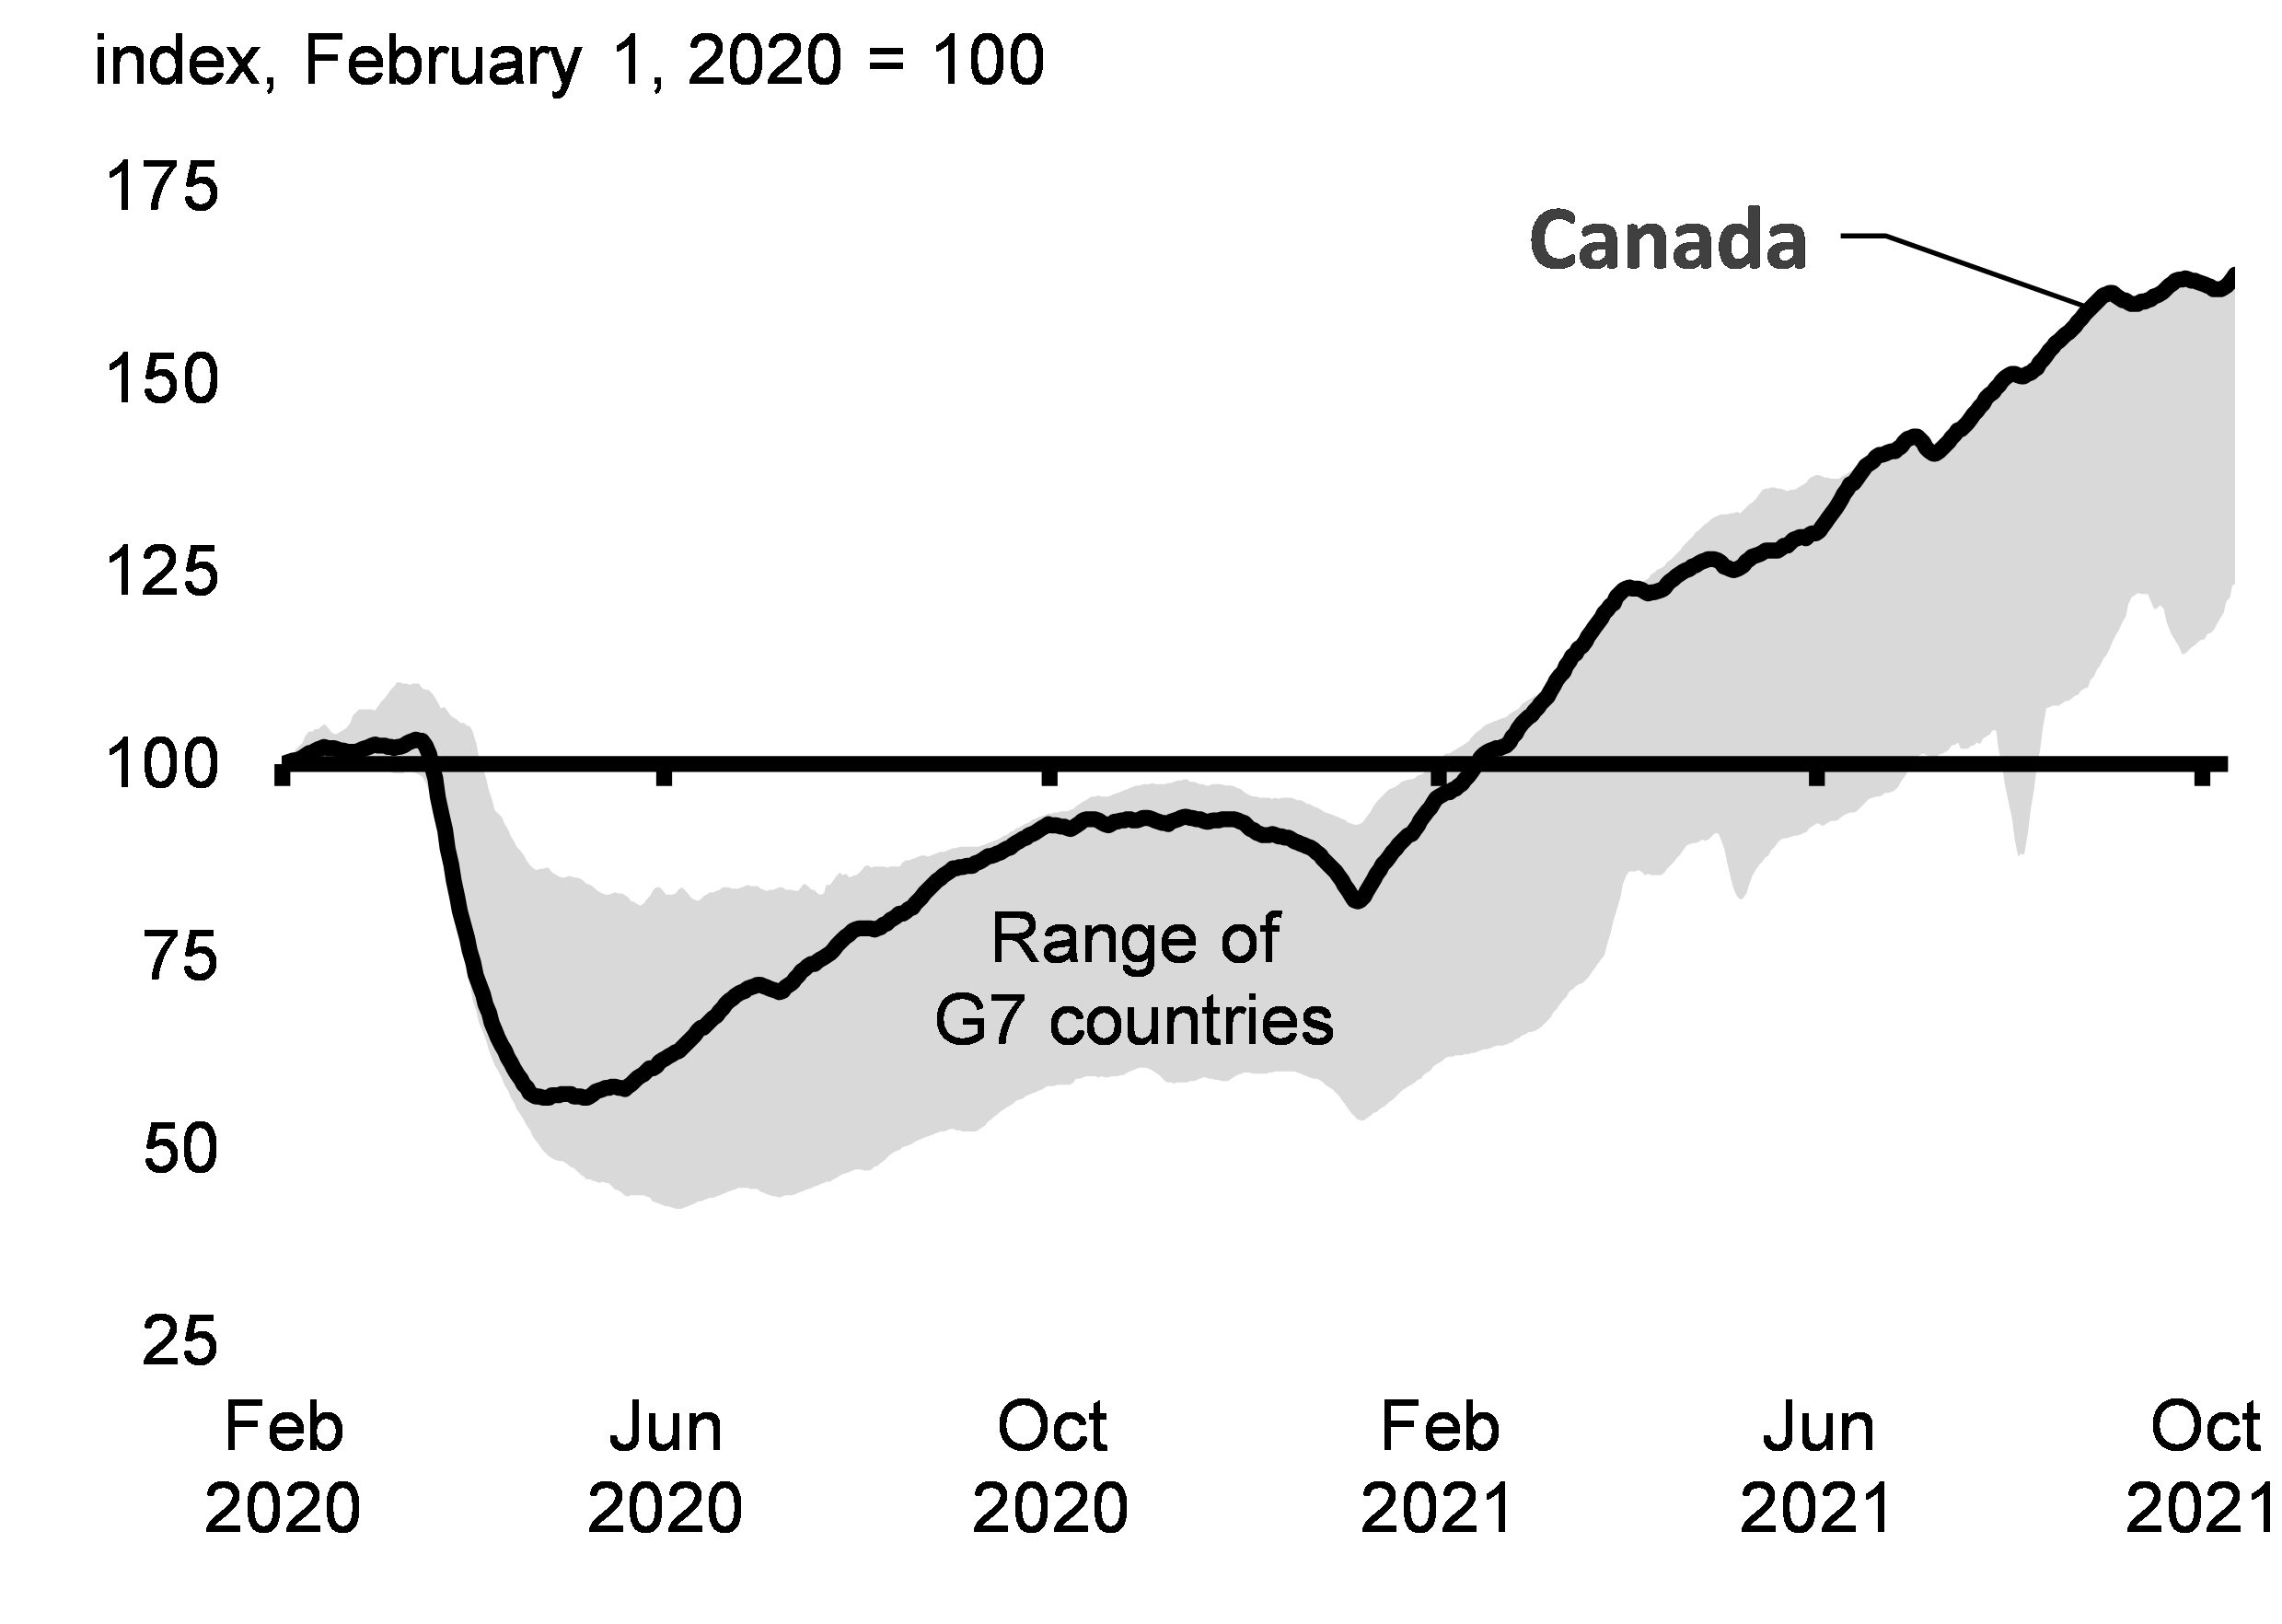
The resurgence in economic activity is also creating challenges for Canadian businesses in certain parts of the country that need to hire more workers to meet increasing demand. Employers were actively recruiting for more than one million job vacancies at the start of September and demand for labour has remained strong through November (Chart 2.15), with online job postings in Canada at least 50 per cent above the level in February 2020.
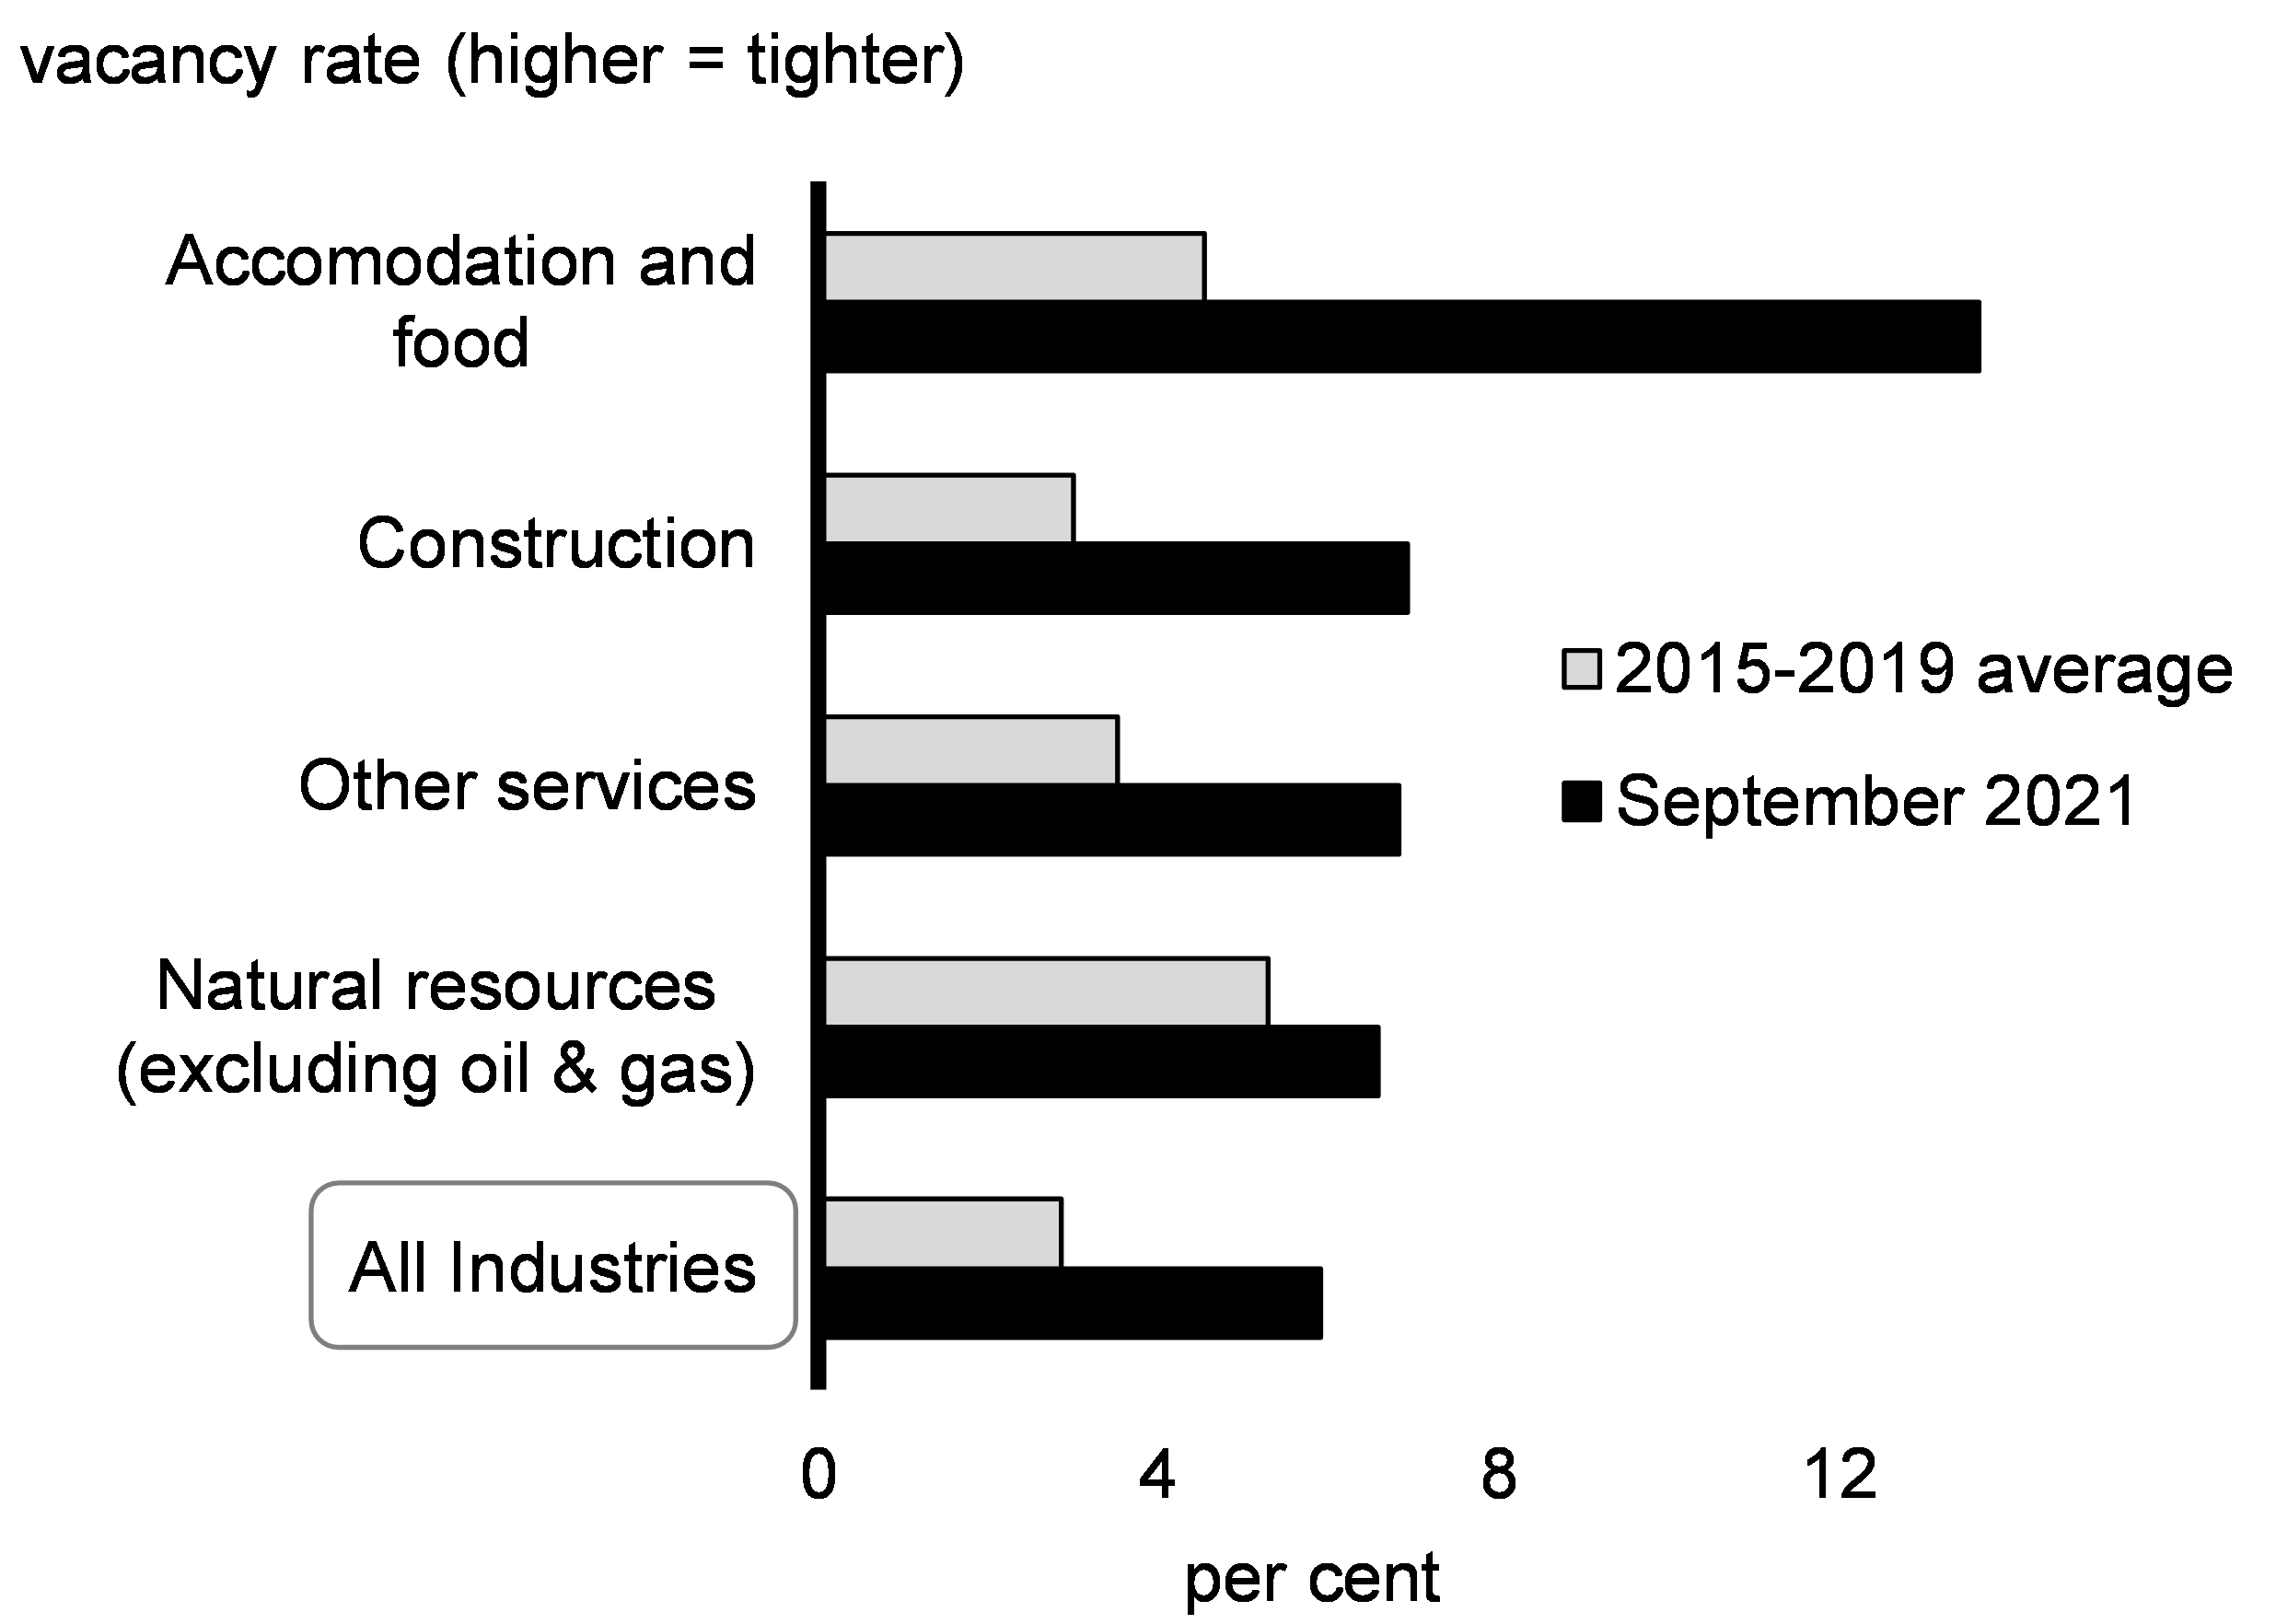
To some extent, this challenge reflects the difficulty in matching a large number of available workers to a large number of job openings all at once as some sectors, like accommodation and food, reopened very rapidly (Chart 2.16). These pressures are expected to be temporary as some labour market frictions—such as the time it takes for businesses to staff up to regular levels—gradually subside. But some shortages may be more persistent as a proportion of workers have switched occupations. As well, some sectors were experiencing shortages prior to the pandemic that may take longer to resolve as businesses struggle to find enough workers with the required set of skills. Canada’s commitment to increase immigration levels and reduce backlogs should help alleviate pressure. The government has also committed to come forward with a further strategy to address labour shortages and will do so next year.
Online Job Postings in G7 Economies
Job Vacancy Rates by Industry
Canada is Managing Labour Market Demands Better Than Most
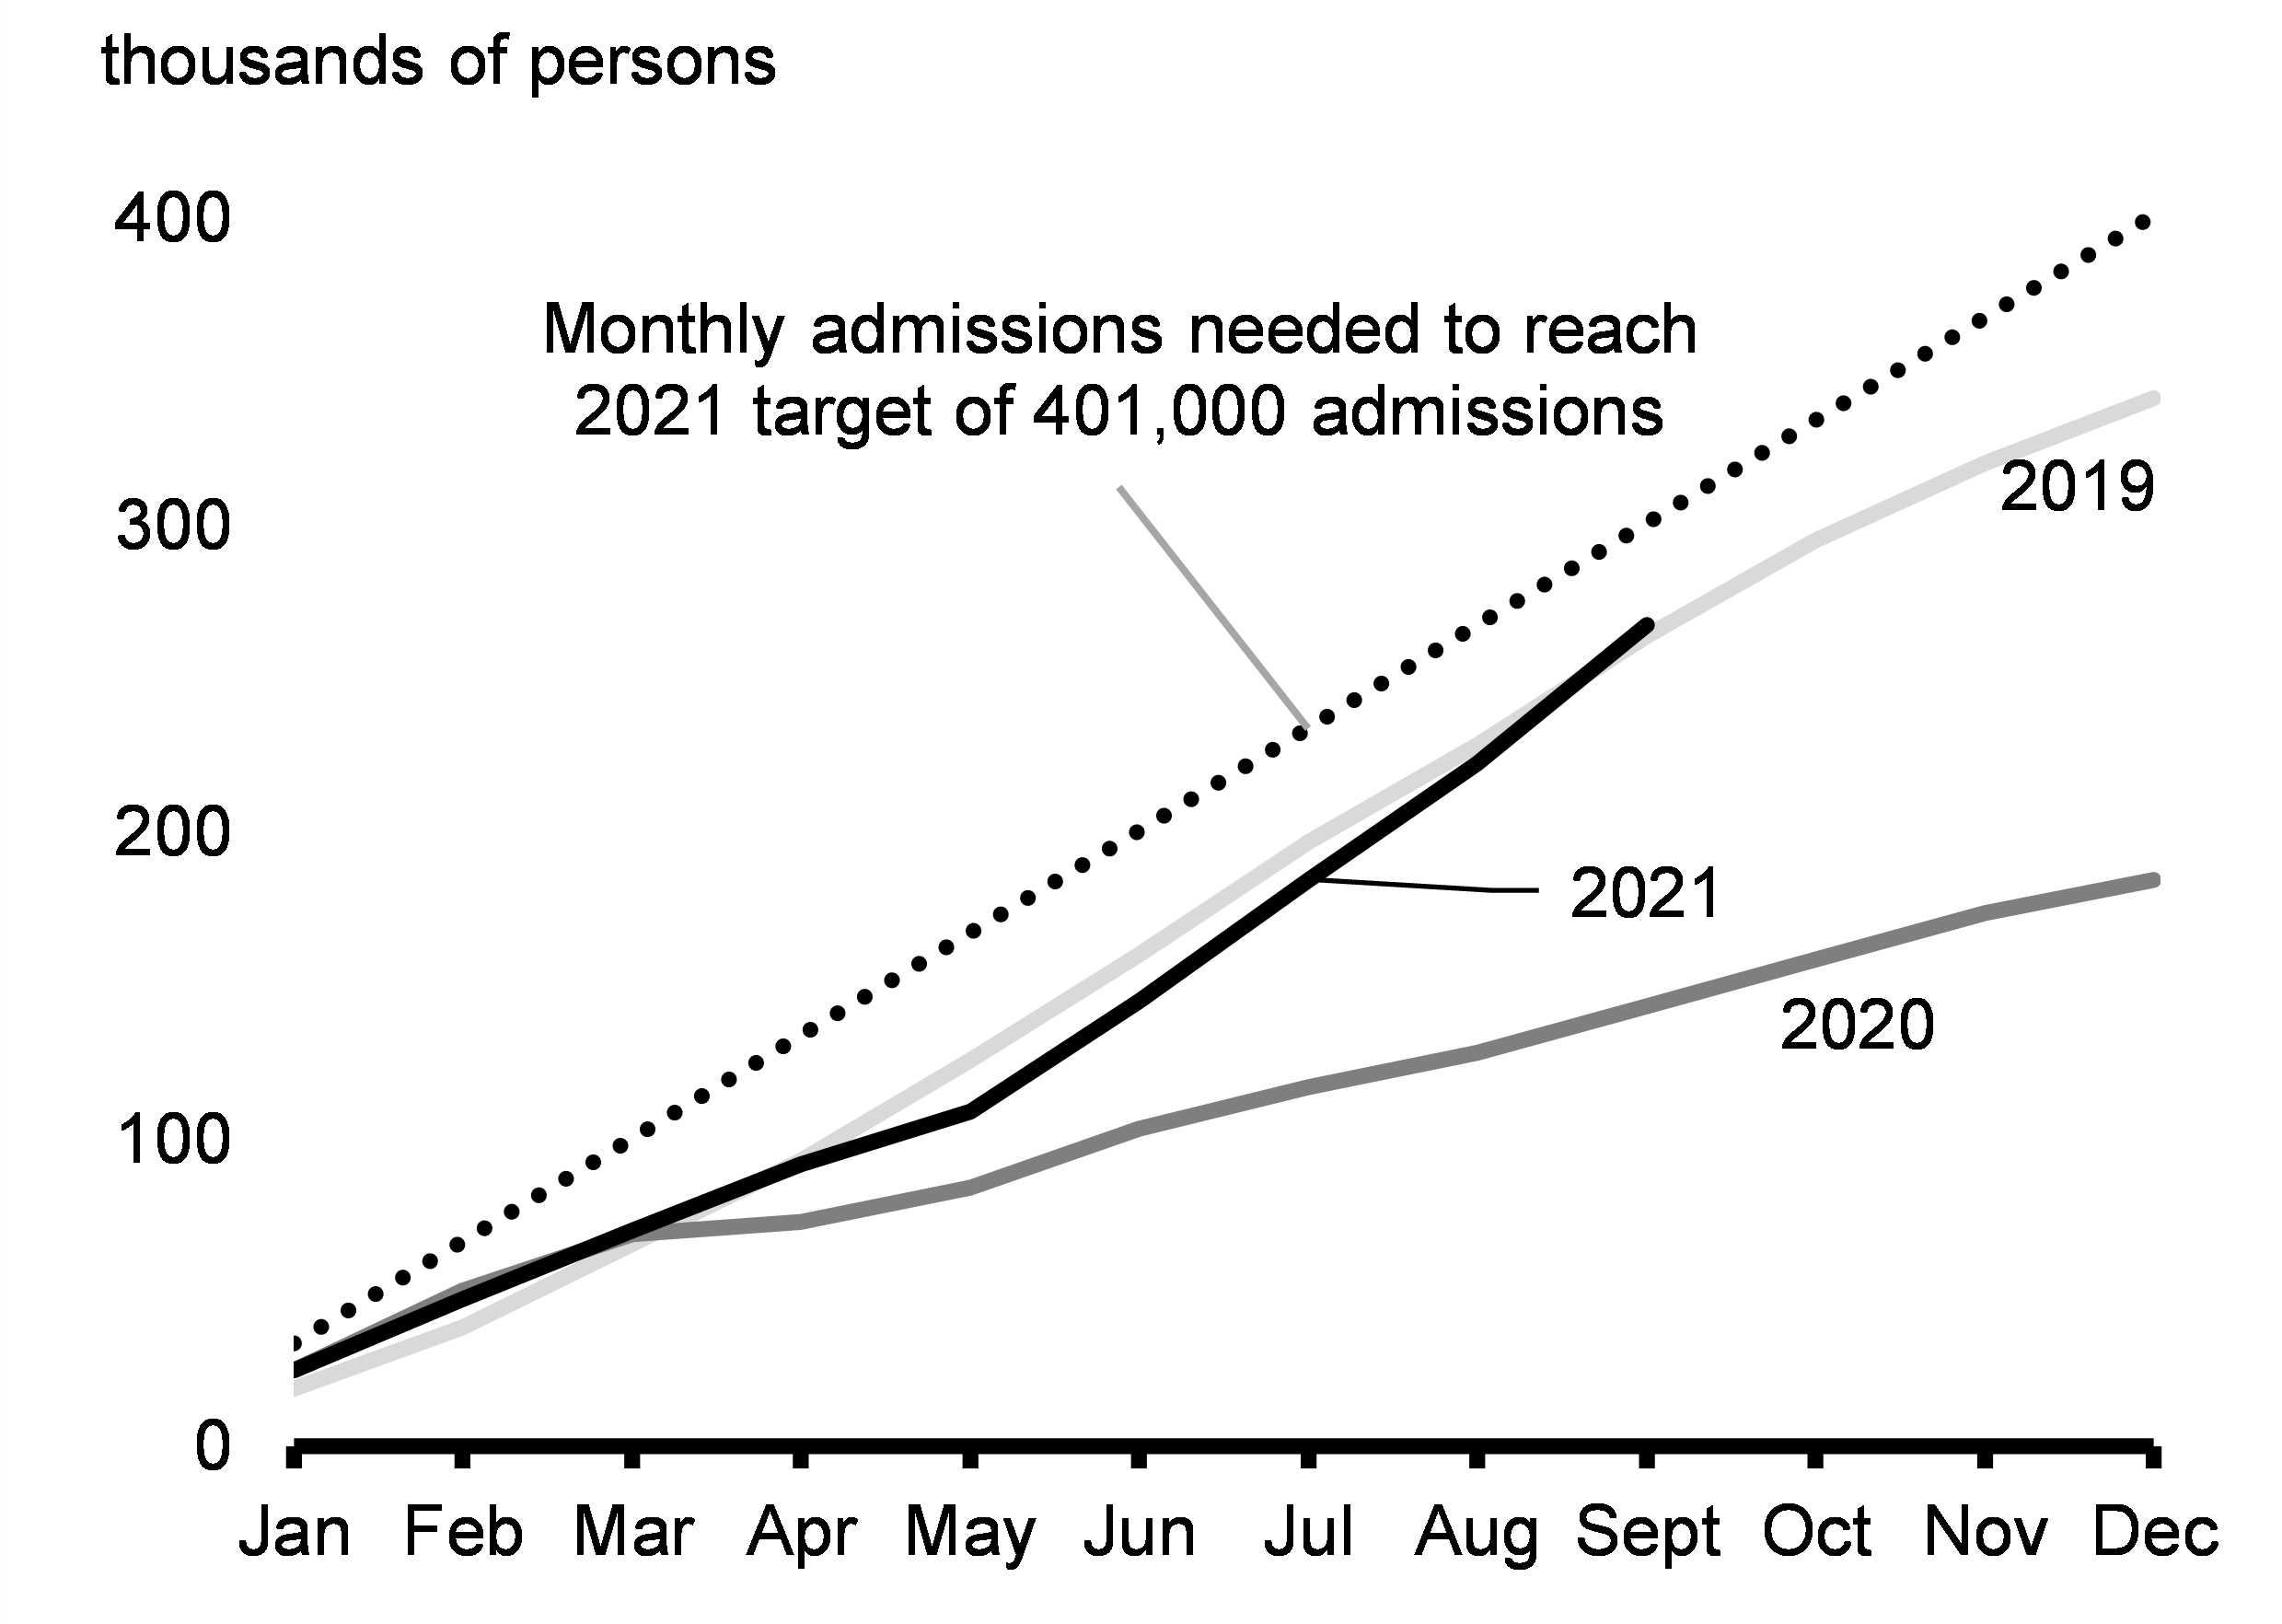
Peer countries are experiencing similar labour supply pressures, especially the United States where the pressure is more acute. Canada’s labour shortage is less severe due, in part, to our stronger rebound in labour force participation (Chart 2.17), and programs like the Canada Emergency Wage Subsidy which preserved the connection between employers and employees. Further, immigration is picking up with average monthly flows in 2021 quickly catching up to pre-pandemic levels, which is expected to help to ease labour shortages (Chart 2.18). Canada was one of the few advanced economies to increase immigration targets early in the pandemic to make up for the 2020 shortfall, recognizing early that immigration has an important role to play in building a strong labour force and supporting economic growth. During the pandemic, the government made historic investments to establish a Canada-wide early learning and child care system that will help ease labour market pressures as affordable child care will support parents, especially mothers, to fully participate in the labour force.
Labour Force Participation Rate, Canada and the United States
Cumulative Permanent Residents Admissions, Canada
2.2 Challenges Ahead: Global Inflation, Supply Chain Disruptions, COVID-19 Variants, and Other Uncertainties
From the outset of the COVID-19 recession, economists have predicted that even a strong recovery would encounter challenges along the way. This is true in Canada, and around the world, as variants of concern require renewed public health cautions and as economies tackle the intricacies of safely reopening. The unprecedented shutdown and restart of the global economic engine has brought with it several challenges including surges in demand for goods rather than services, supply chain challenges, and higher global inflation—which Canadians are feeling here at home. Fighting to end the pandemic continues to be the best economic policy for achieving a strong and stable recovery.
Elevated Inflation is a Global Phenomenon
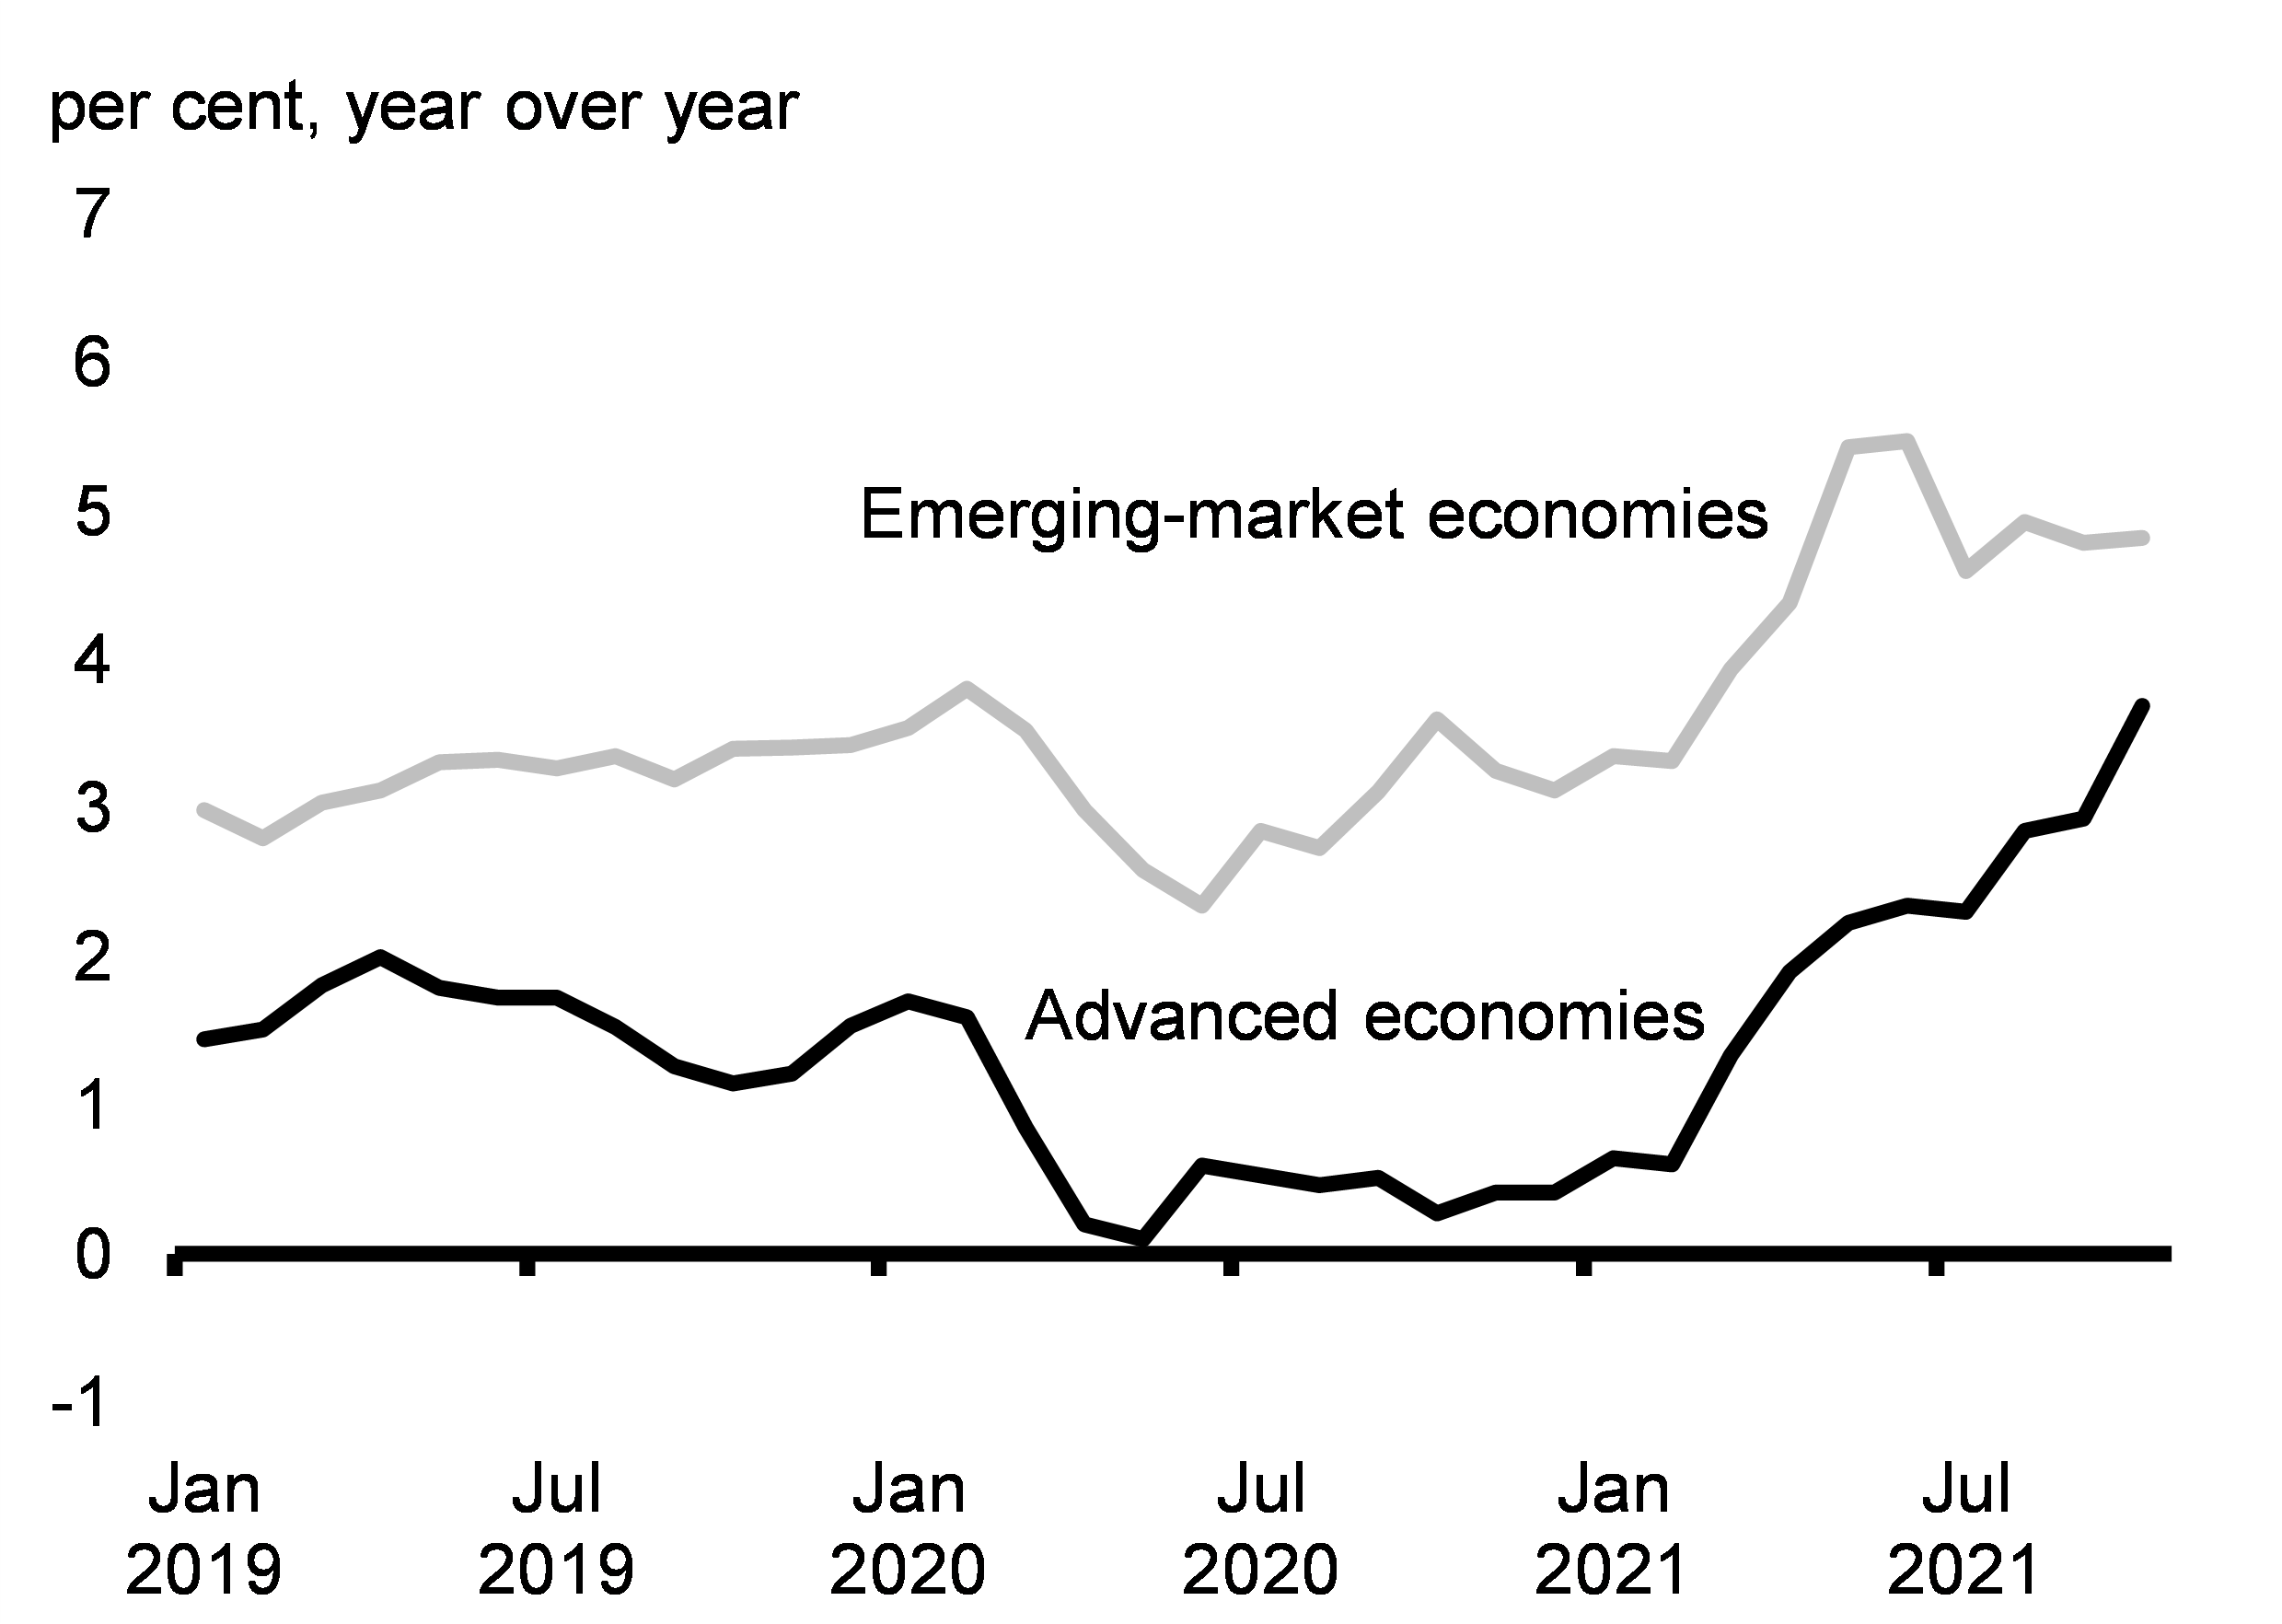
The pandemic and related global inflation is having a tangible impact on Canadians’ cost of living as the price of goods has gone up. As global economies have unwound COVID-19-related restrictions and recovery has begun, the price of goods has gone up in economies around the world (Charts 2.19 and 2.20). During the pandemic, people redirected the money they usually spent on in-person services towards physical goods. This sudden and strong shift in demand has put an extraordinary strain on global supply chains, leading to shortages and bottlenecks. This disruption has been a significant driver of rising inflation, in particular for goods, around the globe.
Consumer Price Inflation in Advanced and Emerging Economies
Intergenerational Impacts – Value of Direct Measures of the COVID-19 Economic Response Plan by Age Group of Recipients
The widespread reopening of economies has also seen the normalization of prices, or “reflation,” for services that had deflated prices during the height of the pandemic, such as air transportation, personal care, and restaurant food, pushing their prices up from 2020 lows. Price pressures have also developed due to a number of special factors influencing supplies of some goods, such as cuts to production early in the pandemic, and shipping bottlenecks. Meanwhile, climate change impacts such as widespread droughts have hurt some crops, pushing food prices higher. These factors have combined to cause the cost of living to rise in Canada and abroad in recent months.
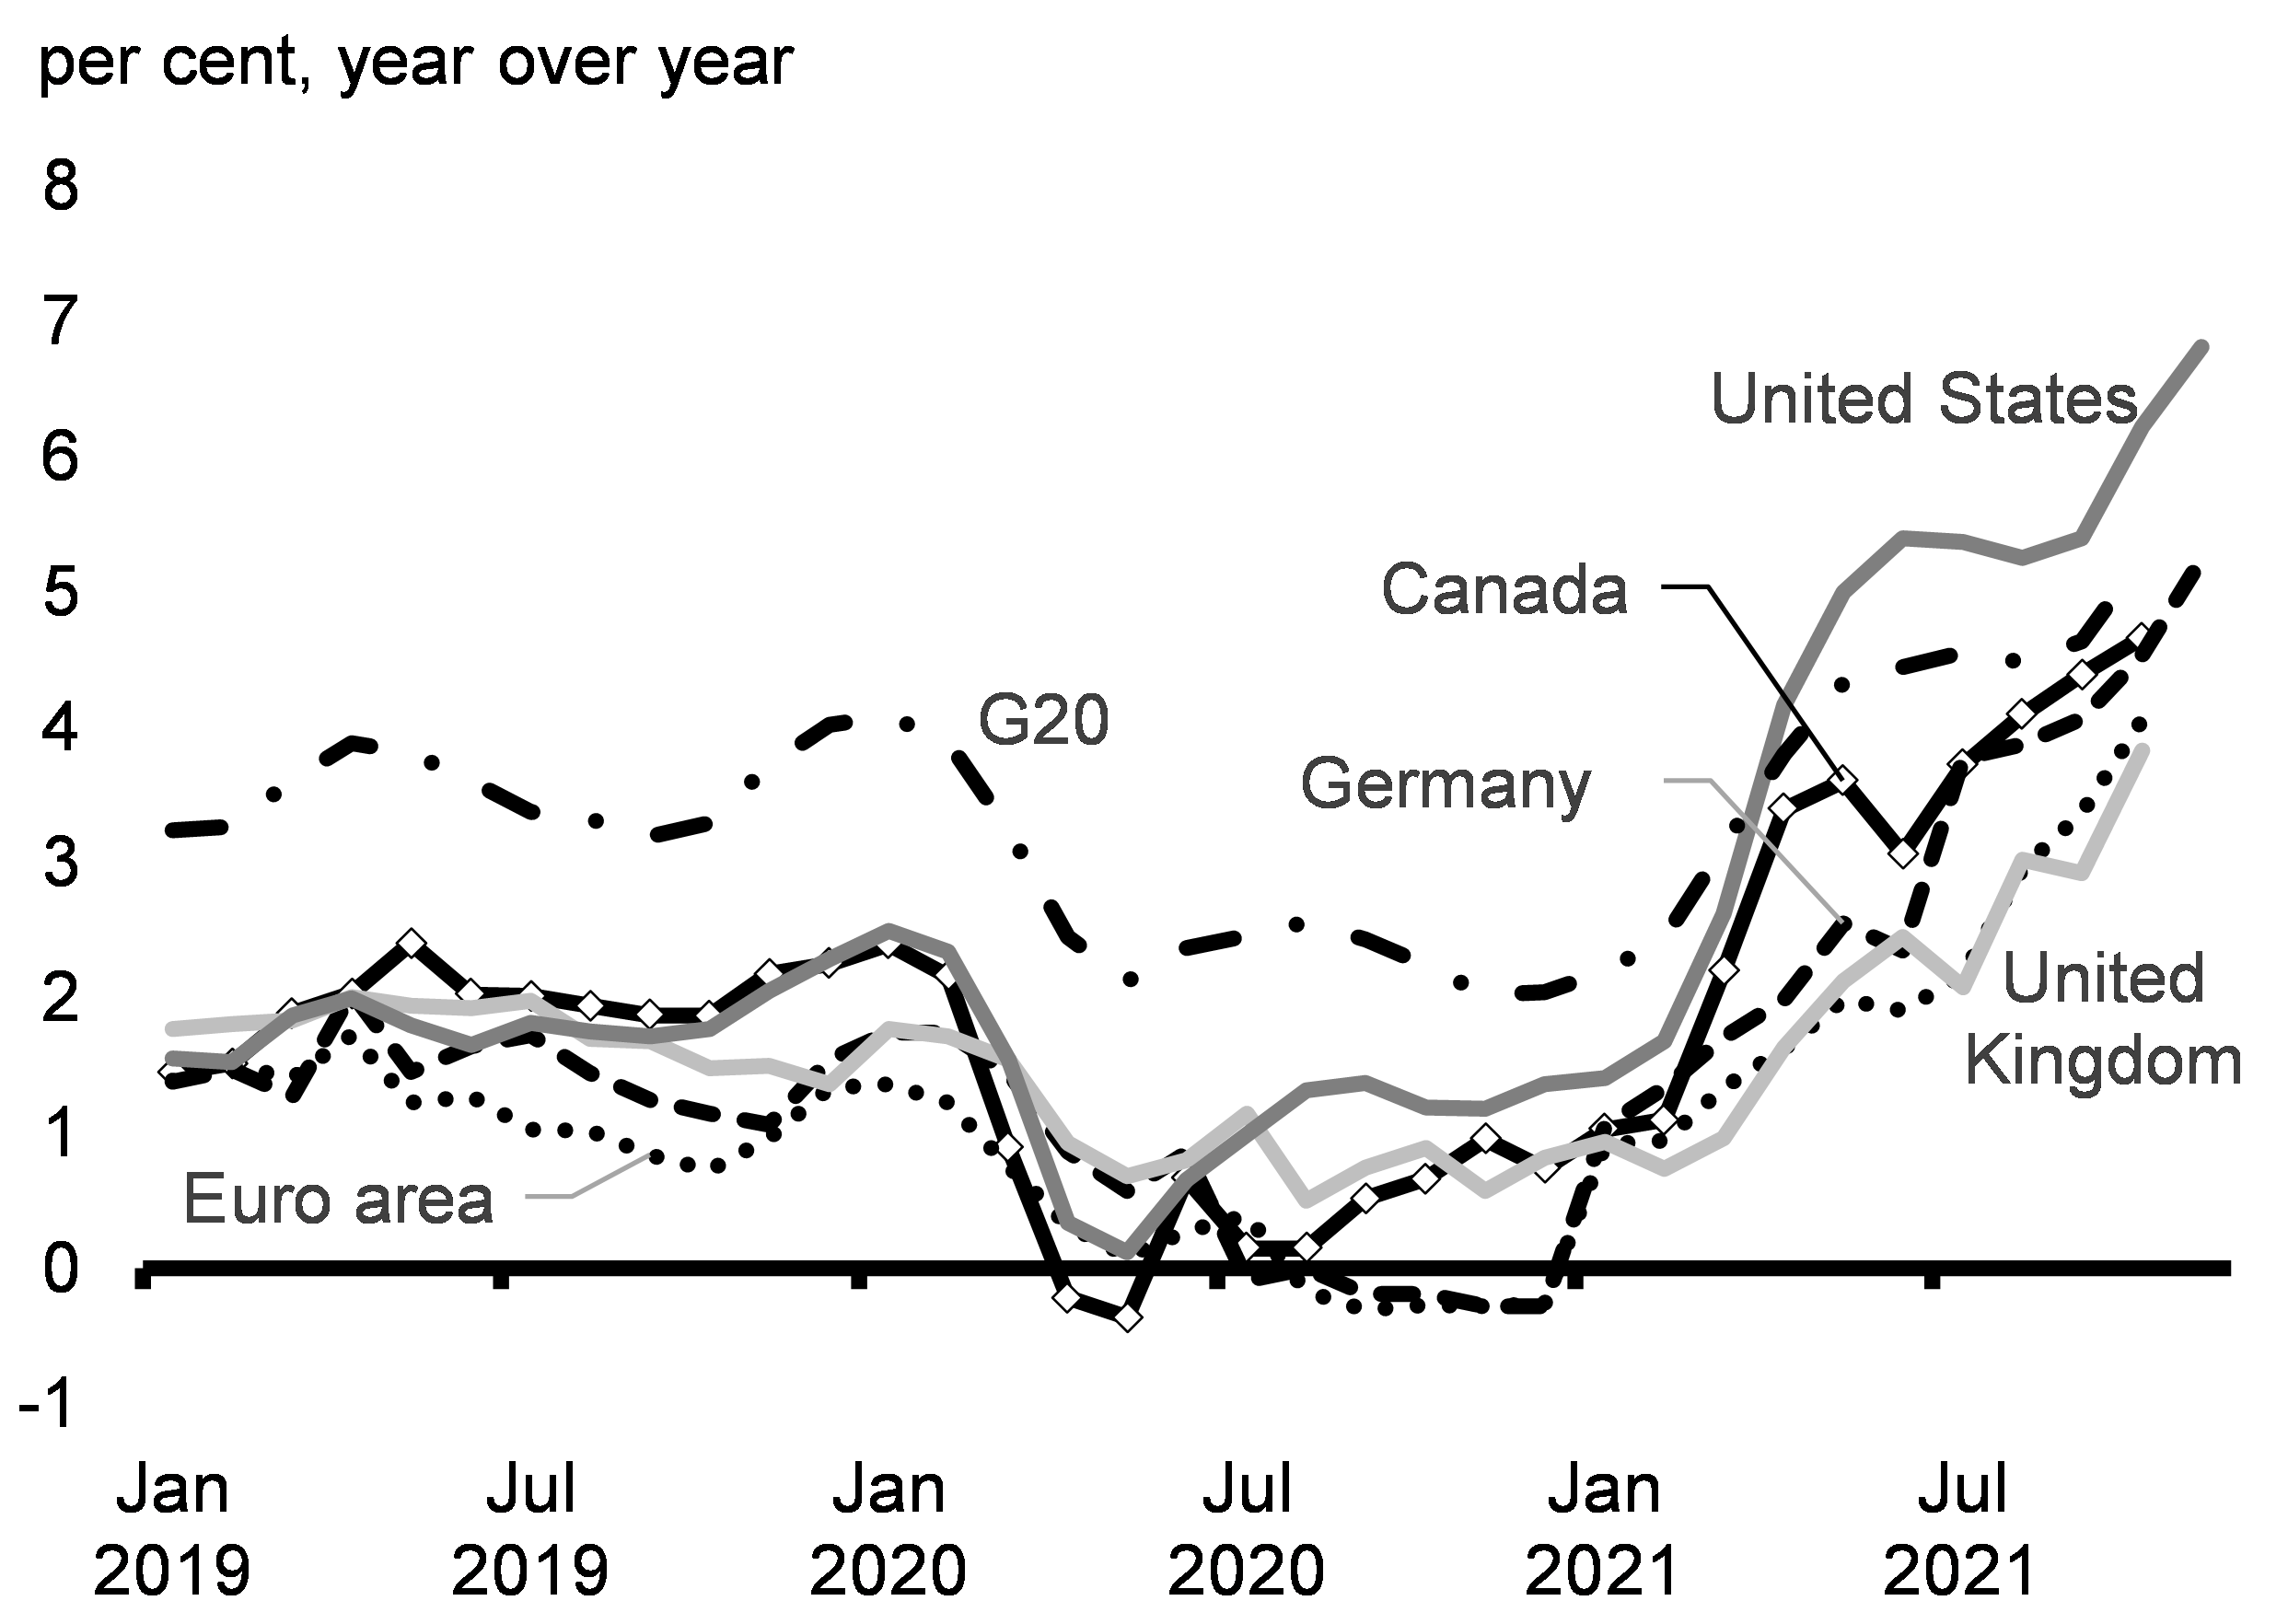
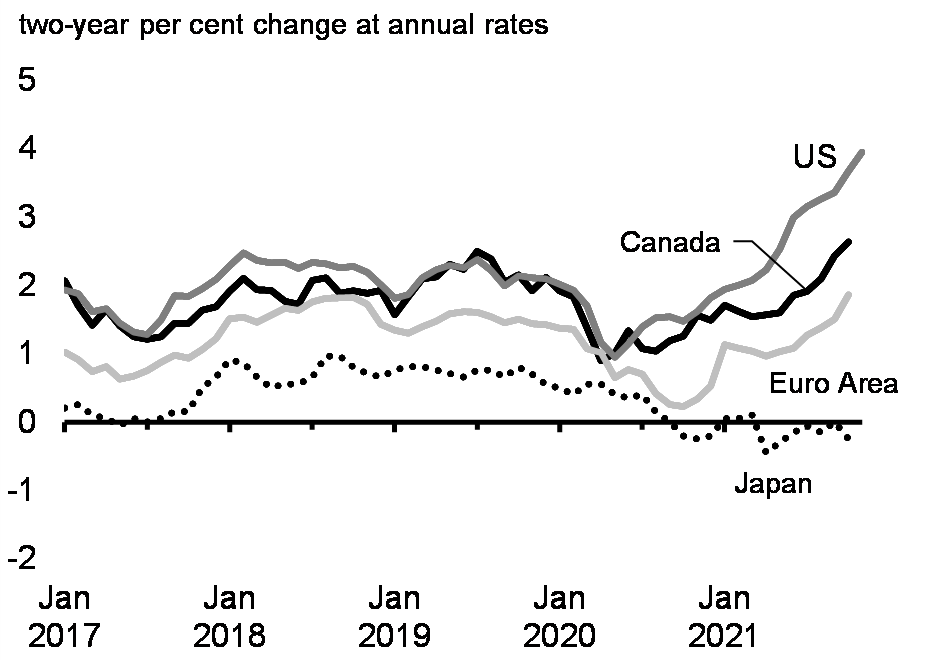
Through to early this fall, these pressures largely offset the decline in prices that occurred earlier in the pandemic. The combined effect is inflation that is modestly above the 2 per cent target when averaged over the last two years (Chart 2.21). Going forward it is likely that price pressures will exceed this threshold for a period of time in most advanced economies, including Canada, before returning to more normal levels.
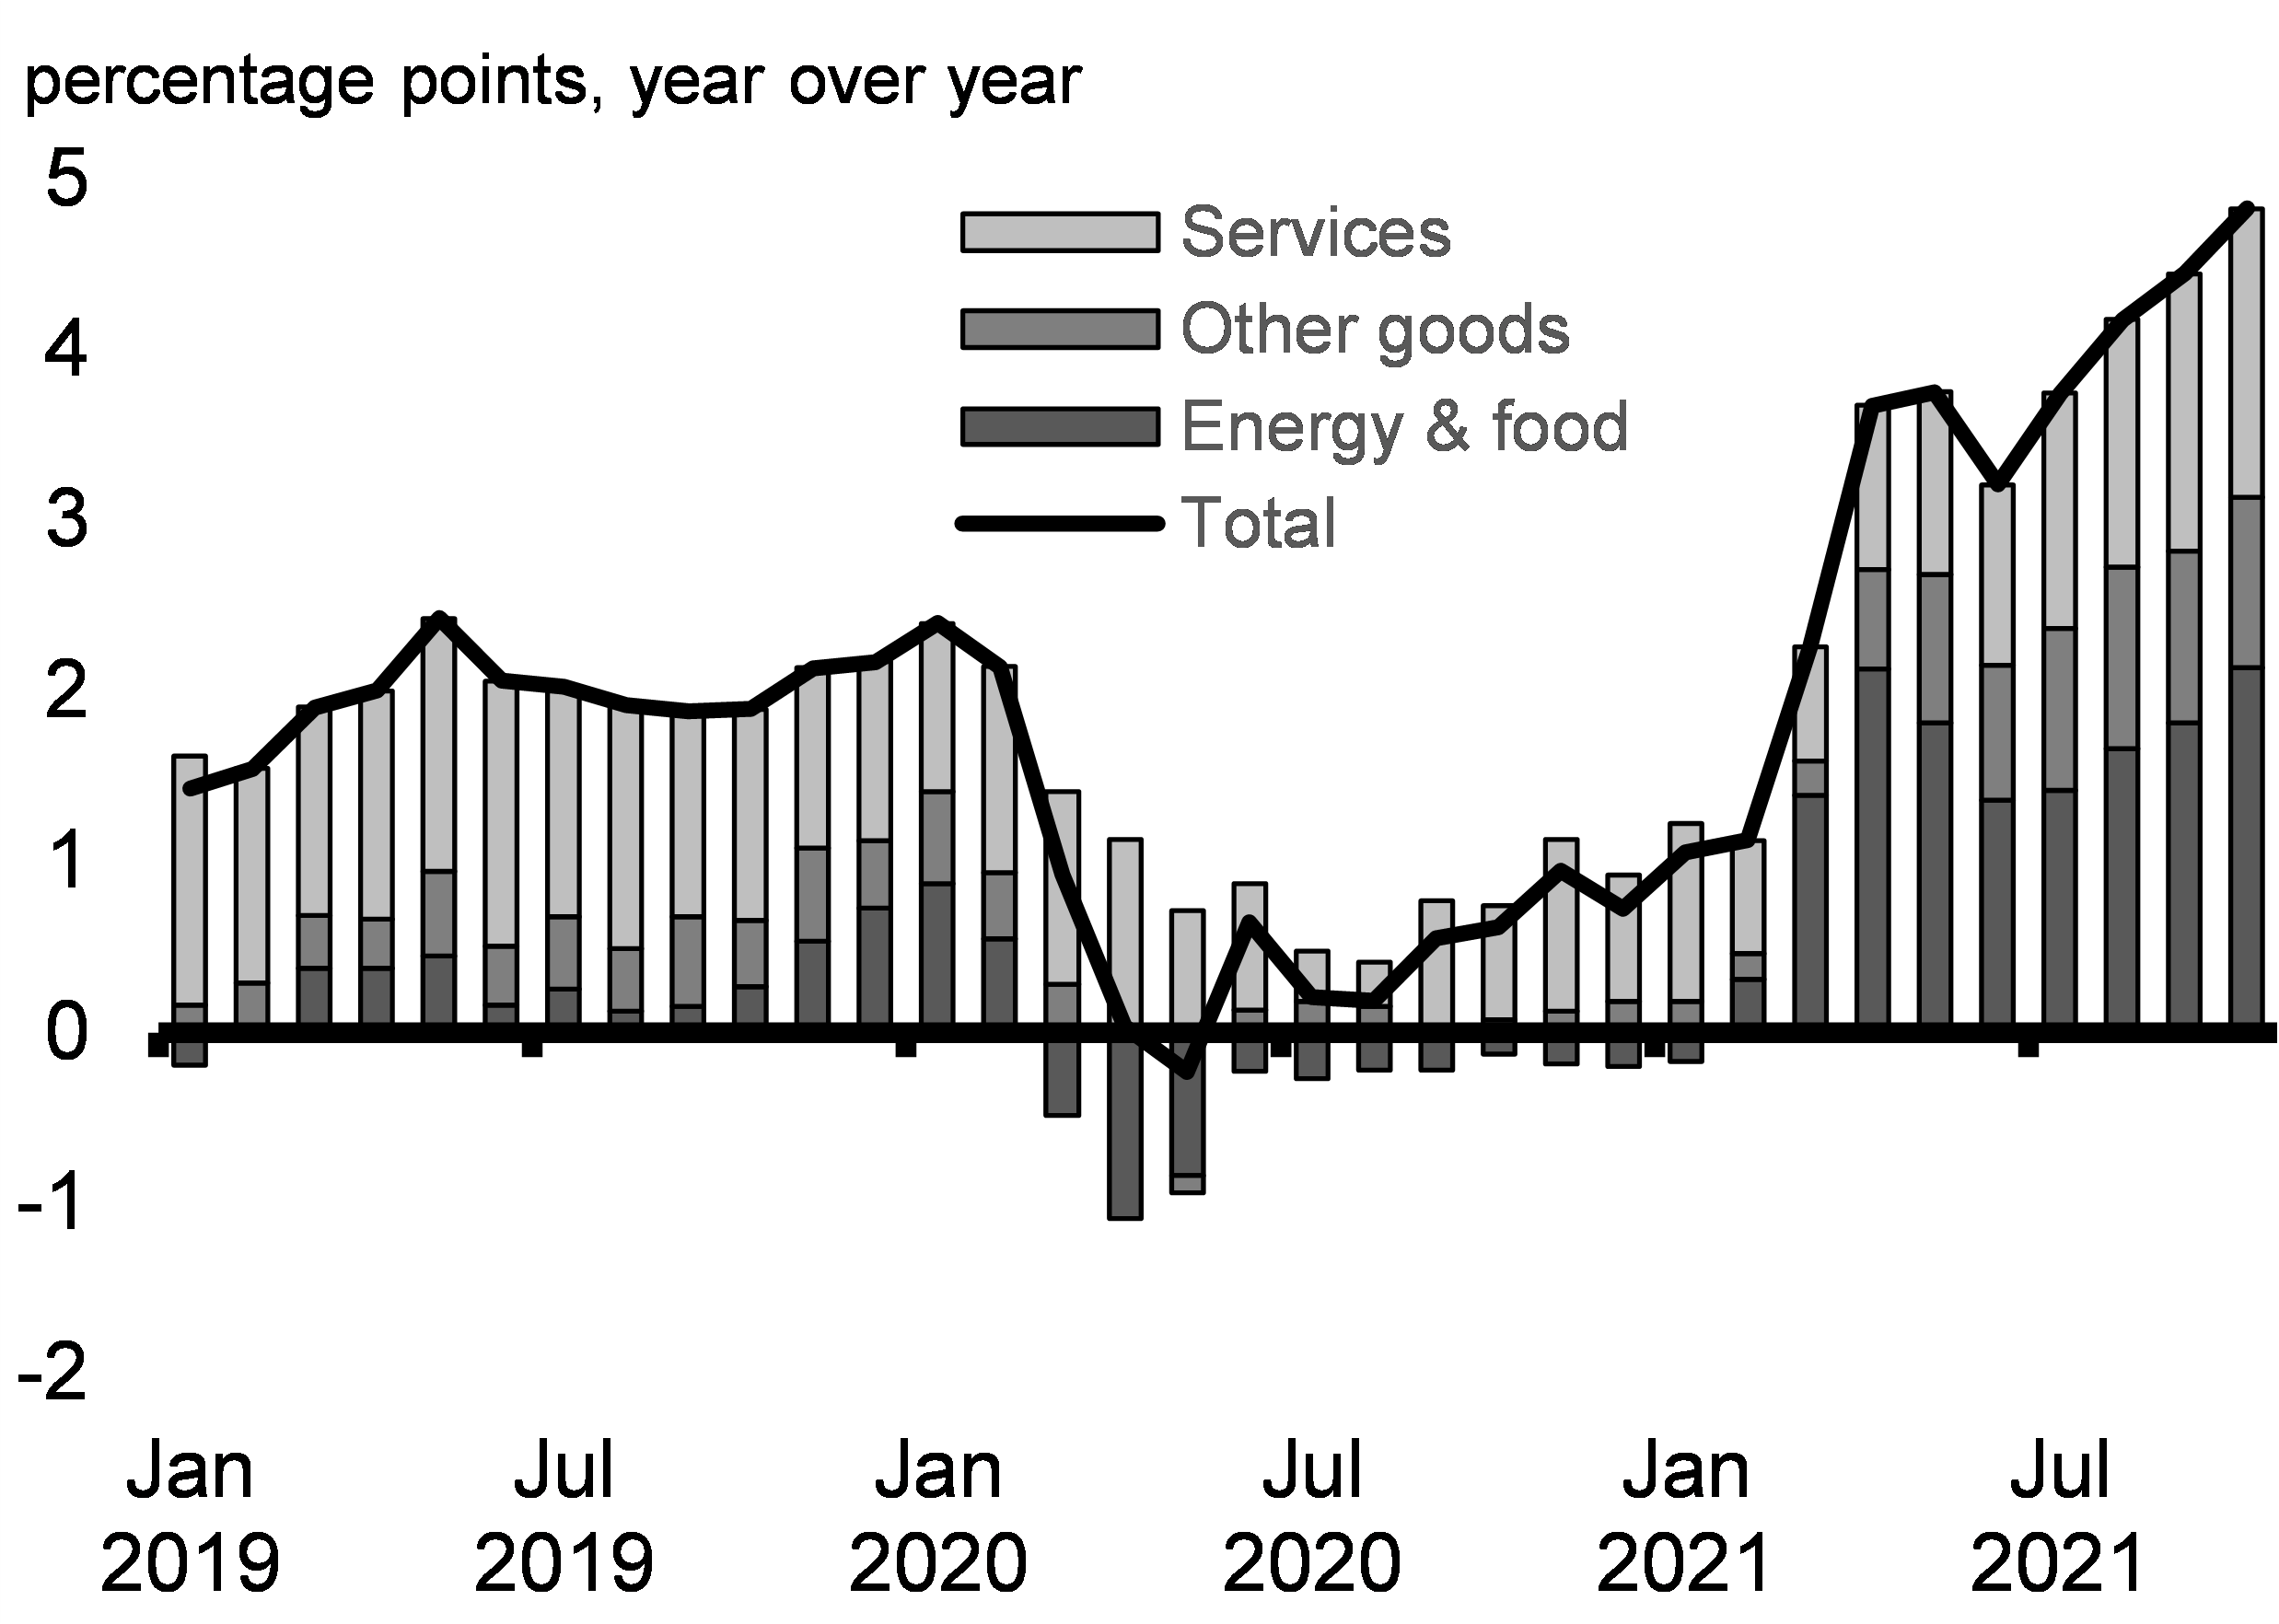
In October, inflation in Canada increased to 4.7 per cent year over year (Chart 2.22). The elevated level of inflation primarily reflects pressures on prices of goods owing much to strong demand combined with supply shortages, with prices for services playing a much smaller role. Private sector forecasters expect inflation to moderate to a level around the Bank of Canada’s 2 per cent inflation target by the end of 2022. There is, however, a considerable amount of uncertainty over the timing of when shipping bottlenecks and various shortages will dissipate and the economic consequences of variants like Omicron.
Consumer Price Inflation in Selected Advanced Economies over a Two-Year Period
Contributions to Consumer Price Inflation in Canada
In addition to rising inflationary pressures, strong housing demand throughout the pandemic combined with limited supply has led to significantly higher house prices across the country. Some normalization of housing activity is expected as the pandemic subsides. This, in combination with increases in new housing supply, will help to slow house price growth in much of the country. However, it will take years of strong supply growth to address the acute affordability challenges Canadians are facing in some regions of the country. The federal government is working with all orders of government to unlock and create more supply. The government has invested over $70 billion through the National Housing Strategy that will support the construction of up to 125,000 affordable homes and increase Canada’s housing supply. Addressing the issues of housing affordability is a priority for the government.
Global inflation has put a strain on the middle class and those working hard to join it. The government is committed to helping Canadians with the cost of living. Structural investments in early learning and child care will deliver significant savings to Canadian families starting next month. Investments through the National Housing Strategy are helping increase housing supply and help vulnerable Canadians find a place to call home, though more action is necessary to address affordability challenges. Furthermore, indexation of key income supports to inflation also ensures seniors, families with children, and low-income Canadians can afford the cost of living. The government has also delivered a number of one-time income supports to vulnerable Canadians during the pandemic.
The government and the Bank of Canada recently announced the central bank’s mandate for the next five-years, including renewing the 2 per cent inflation target. This will ensure that the Bank of Canada remains vigilant against the risk that current inflationary pressures become entrenched. Since the Bank of Canada adopted the inflation-targeting framework 30 years ago, inflation has averaged close to 2 per cent, despite periods of both upward and downward pressures on inflation. The renewed commitment to the inflation target will help ensure that prices normalize over the medium term and that life remains affordable for the middle class and those working hard to join it.
Global Supply Chain Issues Contributing to Price Increases
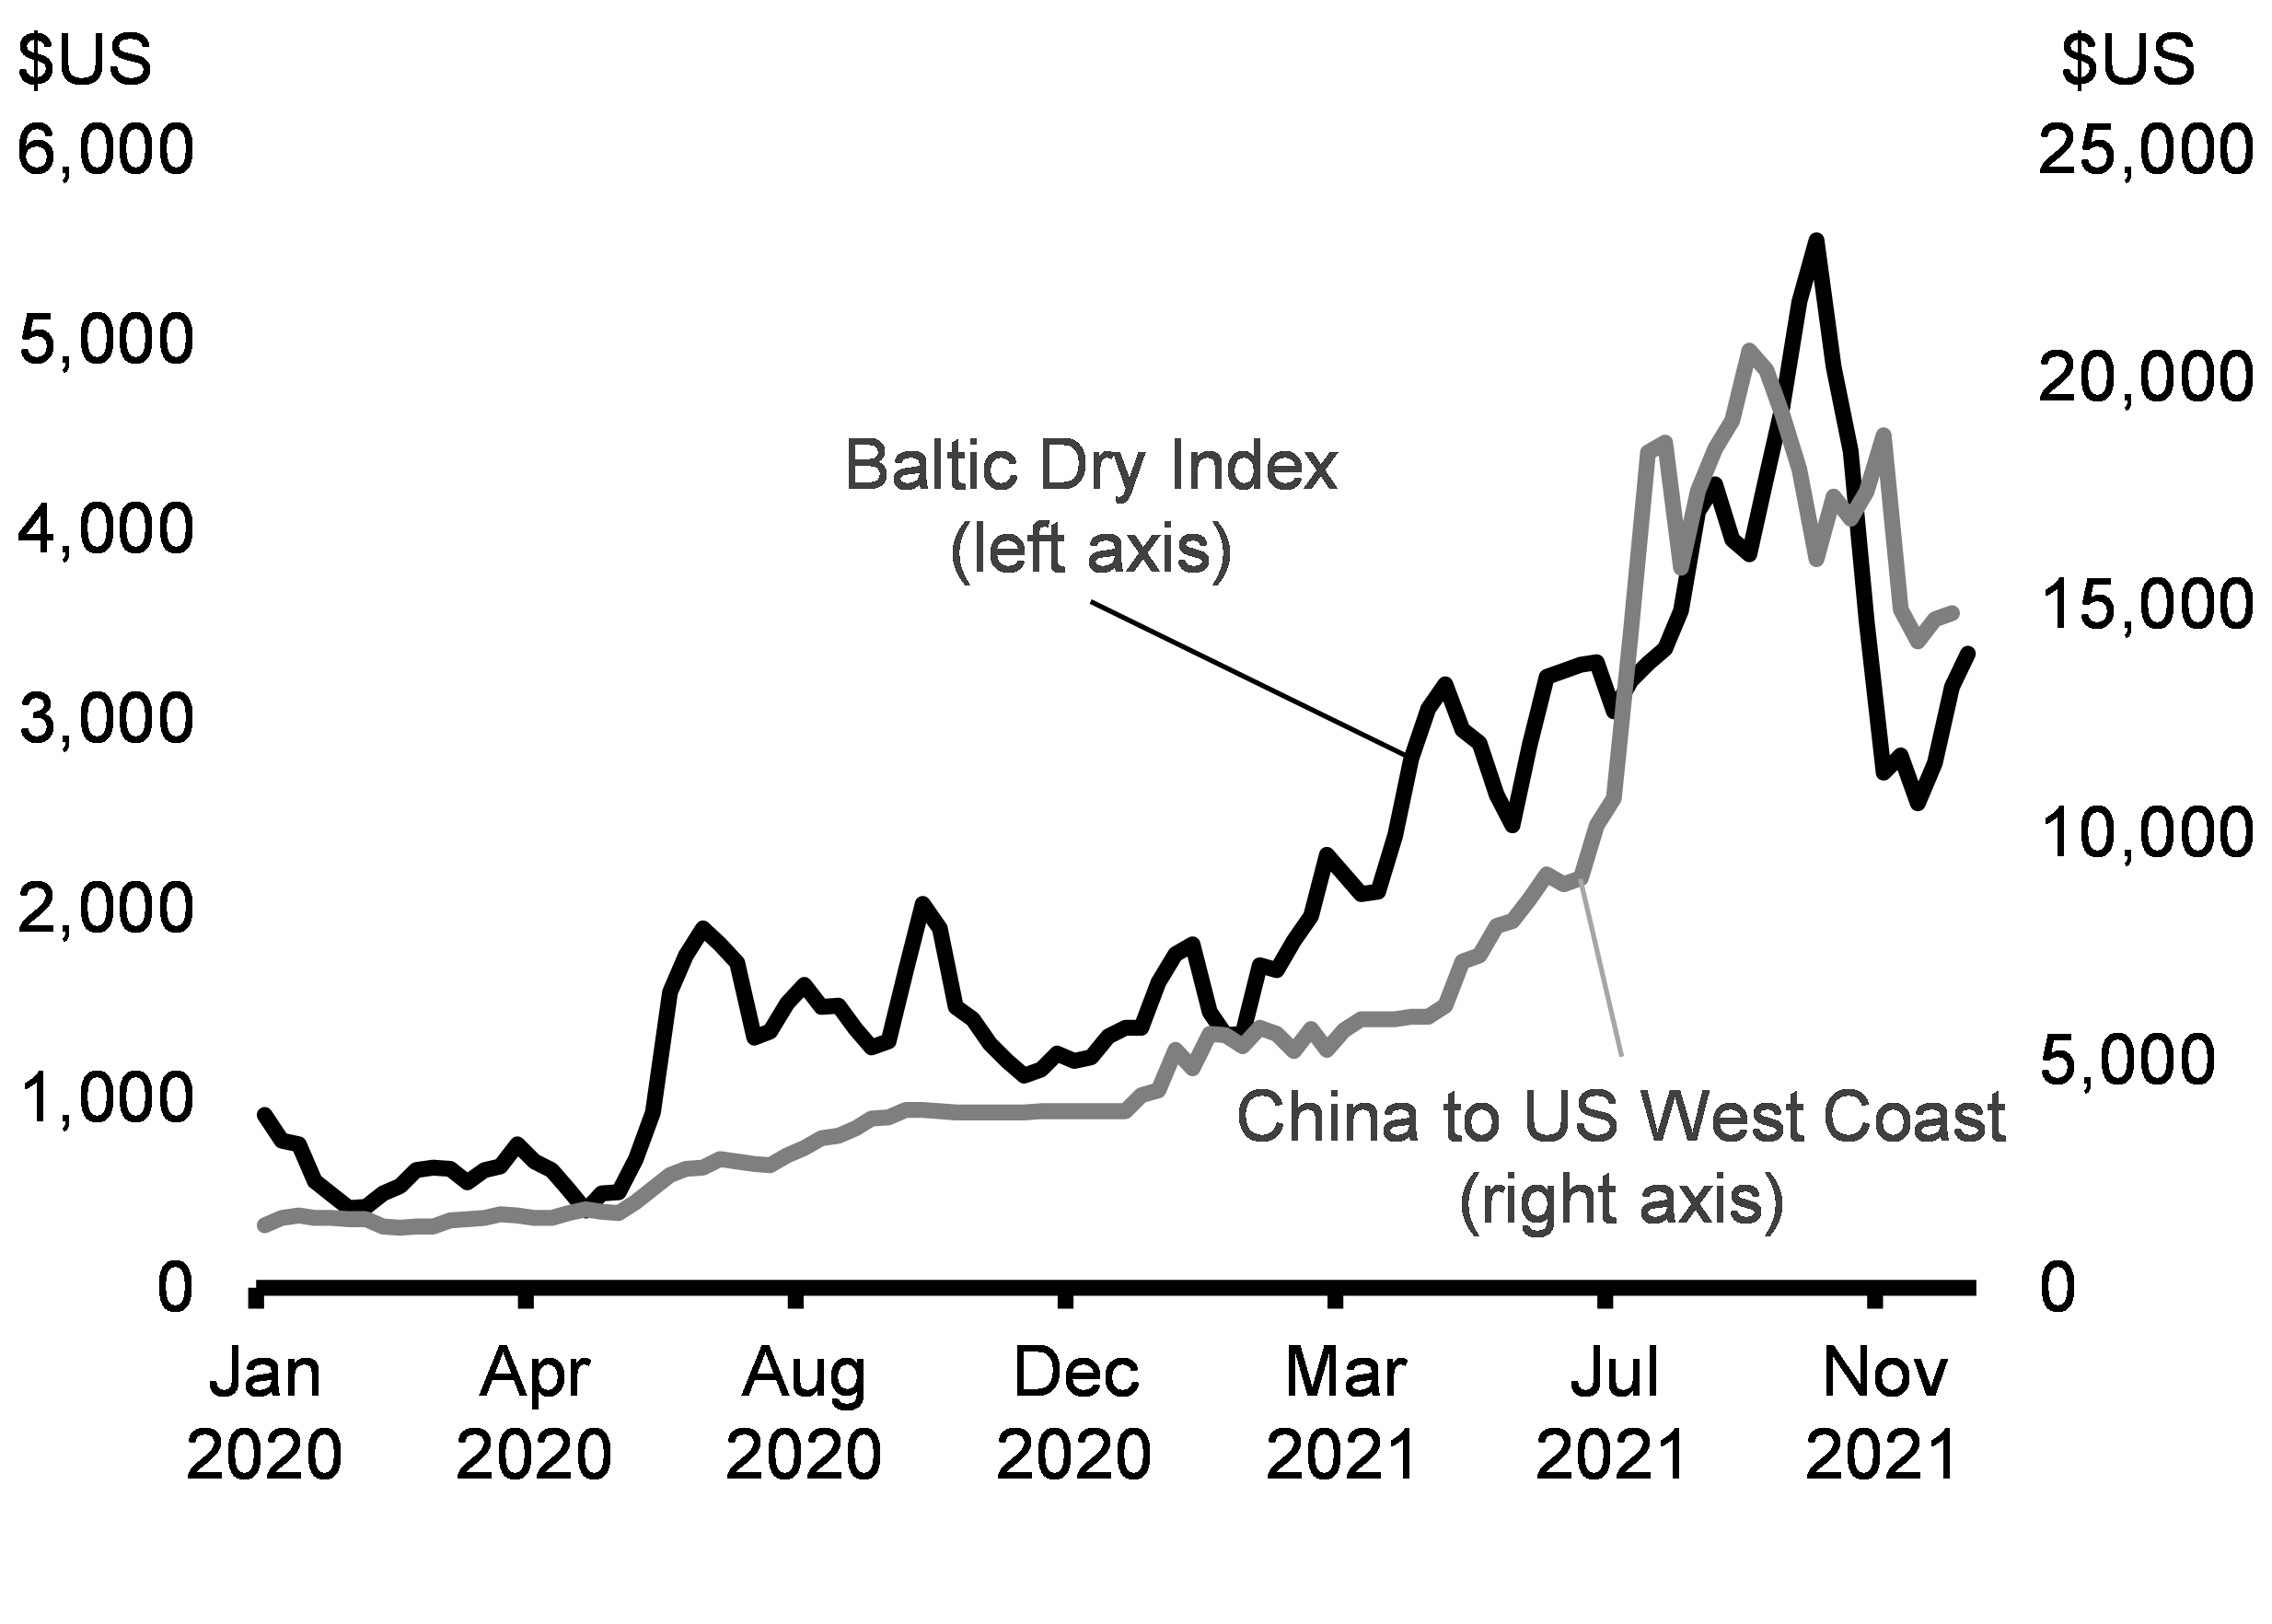
Getting products to markets, especially from Asia, has become more difficult given the larger volumes and disruptions to supply chain infrastructure, such as port closures and COVID-19 related production shutdowns. Containers have piled up at ports, notably on the U.S. West Coast, as significantly higher maritime cargo volumes have met onshore transport bottlenecks and labour shortages. These supply and demand imbalances have translated into surging costs for shipping, notably out of China (Chart 2.23), which, in turn, increase prices.
To help address these issues, in 2021-22, the government will launch a new, targeted call for proposals under the National Trade Corridors Fund to relieve supply chain congestion including help for Canadian ports to increase cargo storage capacity.
In addition to shipping bottlenecks, there are ongoing shortages of many products, particularly semiconductors, which are key in the production of a wide range of goods that were in stronger demand during the pandemic. While countries and factories have ramped up production to deal with order backlogs, supply is lacking, causing disruptions for many industries, particularly automakers. This has caused rapid increases in car prices in many countries. Encouragingly, after rising since the beginning of the pandemic, transportation costs have declined from their peak, which suggests supply bottlenecks might have peaked.
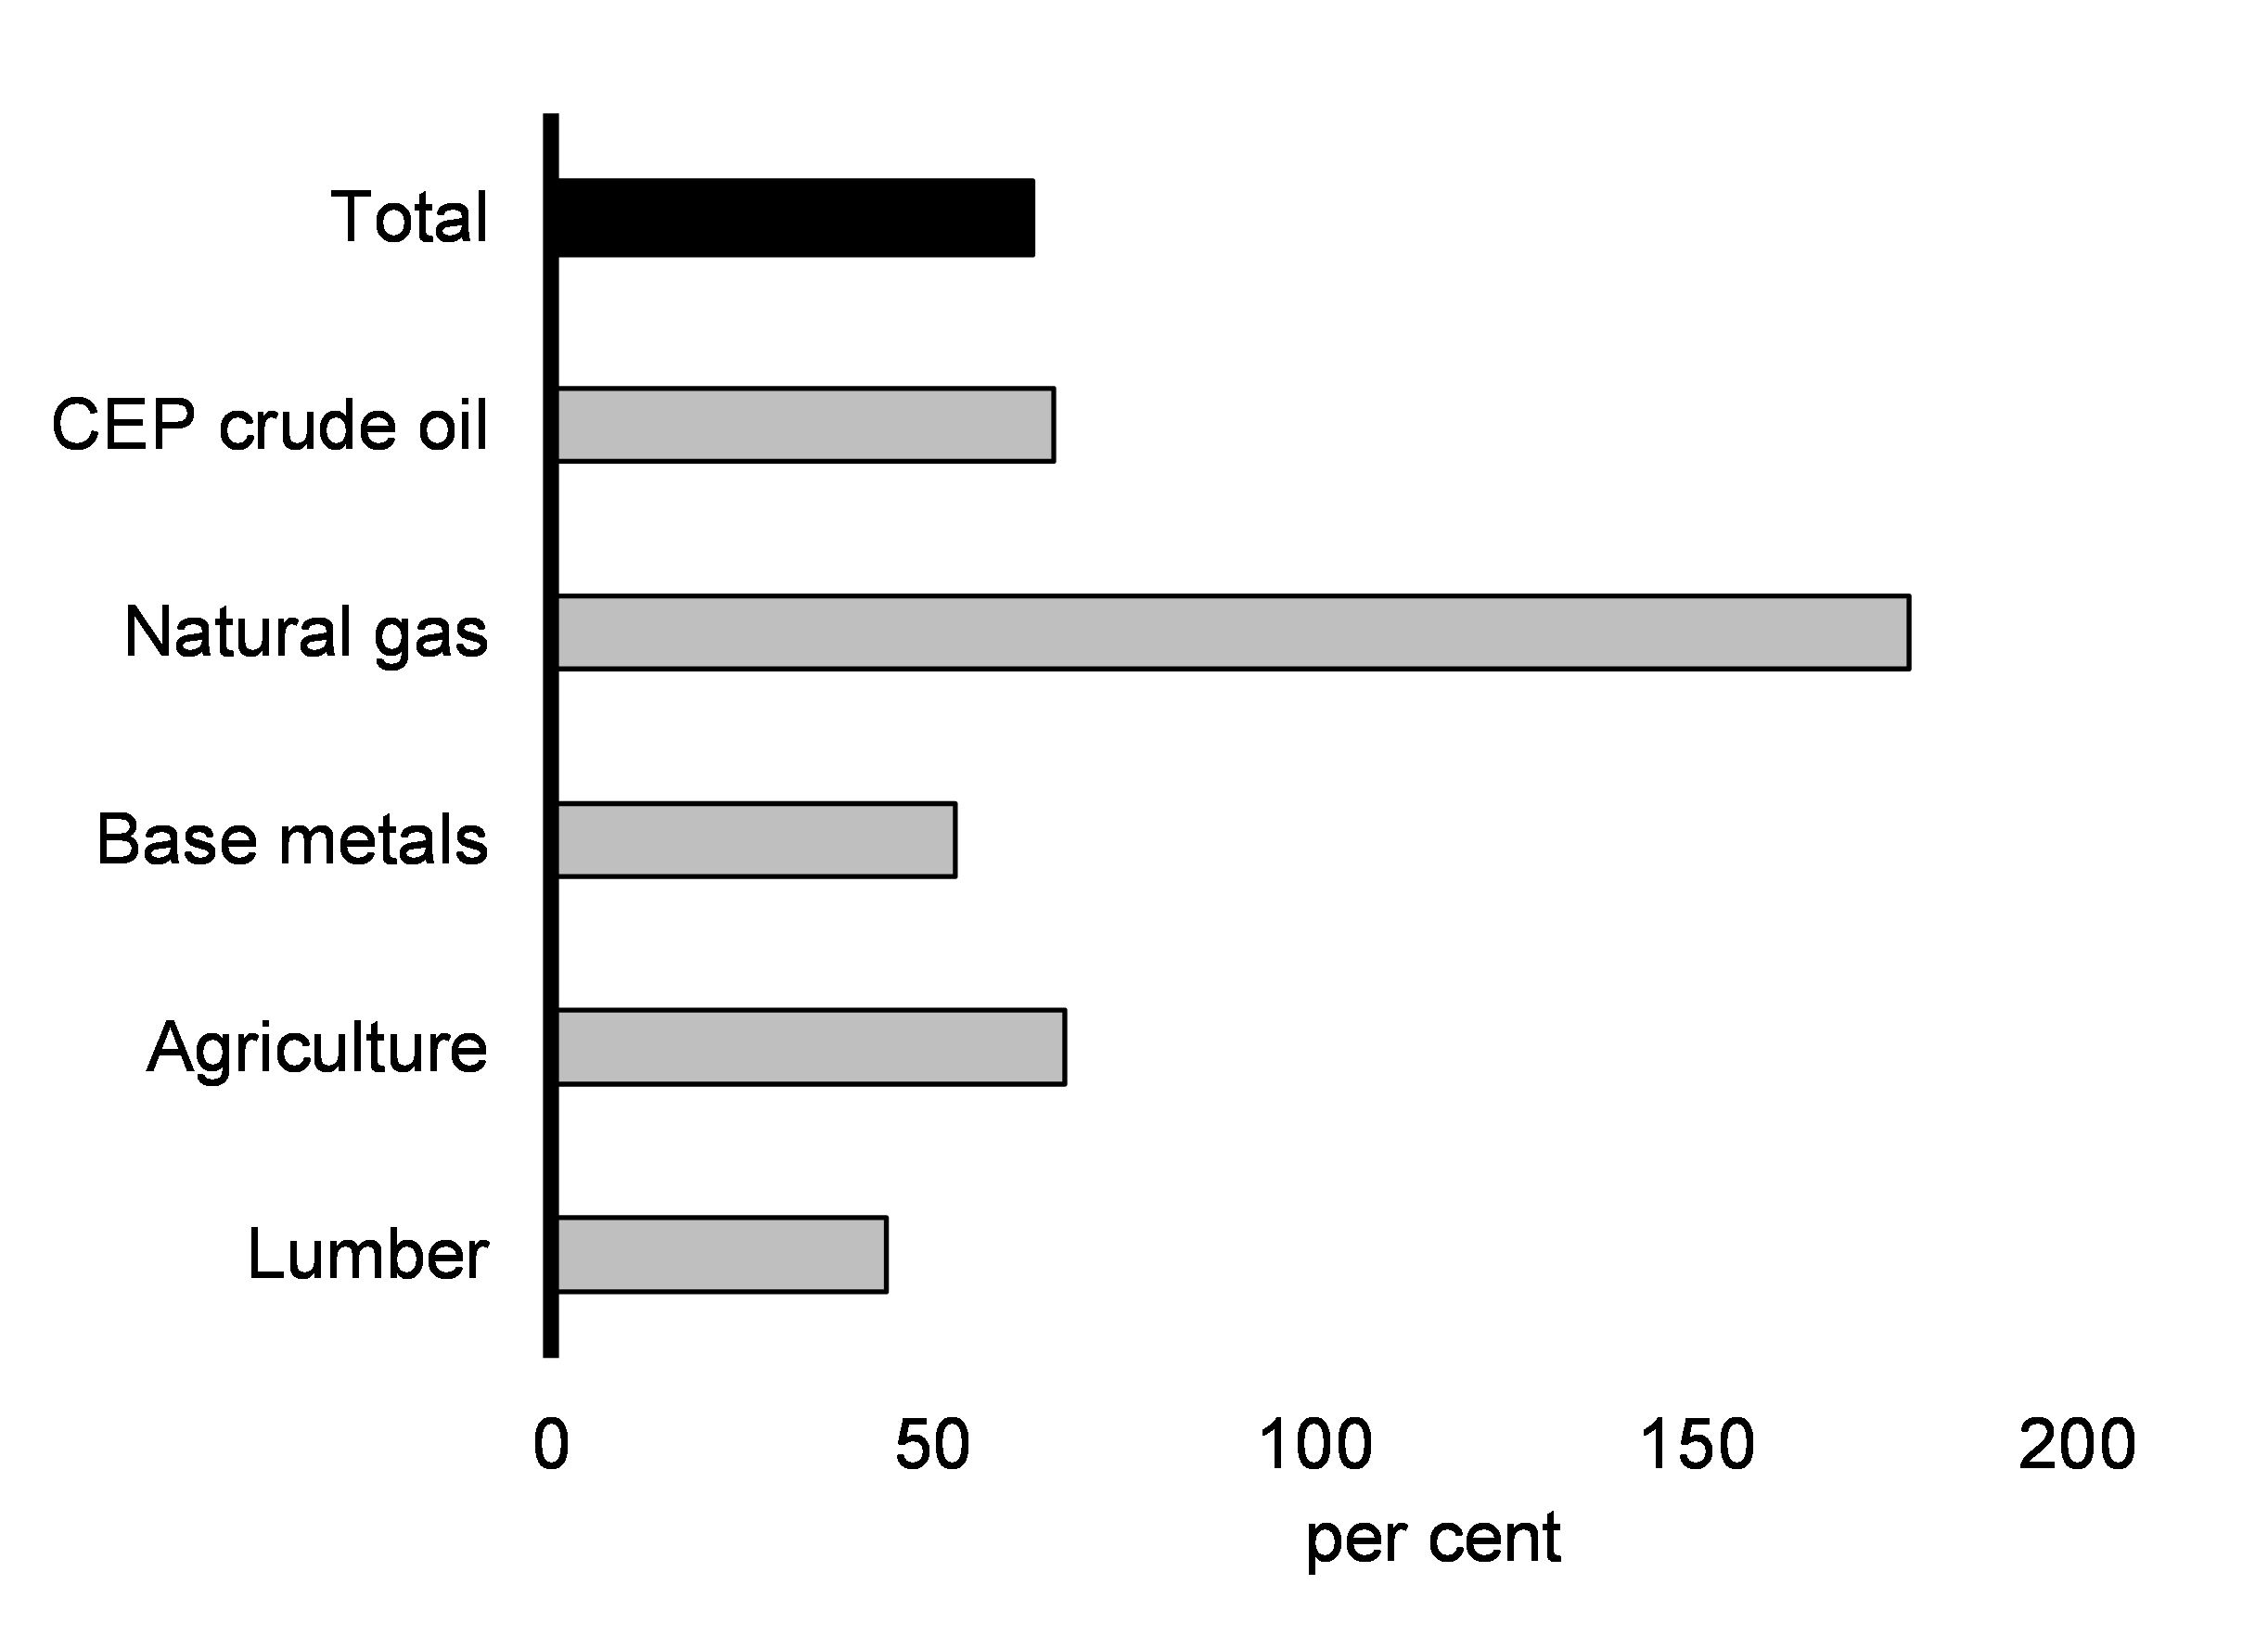
There has been a corresponding surge in commodity prices (Chart 2.24). Crude oil benchmarks have more than doubled since the beginning of summer 2020. Similarly, natural gas and coal prices have surged ahead of winter in the northern hemisphere, reflecting depleted inventories in Europe and parts of Asia. This has translated into higher electricity prices in some areas of the world. Prices of certain base metals have also risen strongly.
Climate change is also having an impact on price increases. Some food prices are rising in part because of severe droughts in key regions of the global food supply chain, including in Alberta, Manitoba, and Saskatchewan. The catastrophic floods in British Columbia have also exacerbated supply chain issues and congestion at the Port of Vancouver.
Freightos Baltic Index: Global Shipping Costs
Change in Key Commodity Prices since February 2020
Extreme Weather in British Columbia
Recent floods in British Columbia have demonstrated the serious risk climate change poses to Canadians’ lives and livelihoods. Flooding, mudslides, landslides, and rockslides have taken the lives of Canadians and forced the closure of major highways, railways, and pipelines. This disruption to critical transportation links severed the flow of people and goods, putting additional pressure on supply chains in the province and nationwide.
Significant disruptions to trade flows—most notably through the Port of Vancouver—are expected to have a significant economic impact. Locally, they have resulted in shortages and higher prices for certain goods such as gas. Nationally, they have exacerbated supply chain issues across the country. The floods have also severely damaged, and even destroyed, farms, agricultural lands, agricultural products, and livestock in the region.
The impacts of this extreme weather are expected to weigh on Canada’s recovery in the fourth quarter of 2021 and could lead to a further increase in prices, particularly in British Columbia. While some trade links have fully reopened, others remain closed or at partial capacity, and permanent repairs could take several months in some cases. Some delays and detours are likely to persist well into 2022. The total economic cost of the floods will depend on how quickly trade links reopen, which supply chains can adapt, and whether the flow of goods can be rerouted.
The Government of Canada and the Province of British Columbia, along with Indigenous partners, will continue to work together to support British Columbians through this crisis and as they rebuild. As noted in Chapter 3, the government has provisioned for $5 billion in 2021-22 for its share of recovery costs under the Disaster Financial Assistance Arrangements as well as other costs related to the recent natural disasters in British Columbia.
Many expect global supply disruptions to largely be resolved later in 2022. However, a considerable degree of uncertainty surrounds this outlook, especially with the emergence of the Omicron variant, which could lead to further supply challenges and bottlenecks. As well, other supply shocks, such as those related to widespread and severe droughts in several key regions of the global food supply chain, are expected to further increase food prices. In Canada alone, adverse weather conditions in the Prairie provinces are expected to lead to a sharp decline in total grain and pulse production in 2021.
Federal Investments to Help Canadians Afford the Cost of Living
The government is focused on supporting families, growing the middle class, and improving Canadians’ standard of living, and making significant investments to help Canadians afford the cost of living. This includes sizeable structural investments in early learning and child care and housing.
Early Learning and Child Care Investments to Make Life More Affordable
In Budget 2021, the government laid out a plan to provide Canadian parents with, on average, $10-a-day regulated child care spaces for children under six years old. This plan to build a Canada-wide, community-based early learning and child care system will make life more affordable for families, create new jobs, get parents—especially women—back into the workforce, grow the middle class, and give every child an equal start in life. It will also drive economic growth in Canada and is estimated to raise real GDP by as much as 1.2 per cent over the next two decades.
Province/Territory and Date Agreement Announced |
Amount of Federal Investment (5 Year Allocation, $ millions)1 |
Estimated Average Savings per Child with 50% Average Fee Reduction (gross, annual)2 |
Estimated Average Savings per Child at $10/day (gross, annual)2 |
Child Care Spaces to be Created |
Estimated Early Childhood Educator Jobs to be Created3 | ||||
|---|---|---|---|---|---|---|---|---|---|
| BC July 8, 2021 |
$3,212 | $6,000 (by end of 2022) |
$9,390 (by end of FY 2025-26) |
40,0004 | 8,000 to 10,000 | ||||
| NS July 13, 2021 |
$605 | $4,690 (by end of 2022) |
$6,780 (by end of FY 2025-26) |
9,500 | 1,900 to 2,375 | ||||
| YK July 23, 2021 |
$42 | Yukon committed to a $10/day average fee prior to Budget 2021 |
$7,300 (achieved) |
110 | 22 to 28 | ||||
| PEI July 27, 2021 |
$118 | $3,390 (by end of 2022) |
$4,170 (by end of 2024) |
452 | 90 to 113 | ||||
| NL July 28, 2021 |
$306 | $5,090 (by end of 2022) |
$7,560 (as early as January 2023) |
5,895 | 1,179 to 1,474 | ||||
| QC5 August 5, 2021 |
$5,964 | Not applicable | Not applicable | 37,000 | 7,400 to 9,250 | ||||
| MB August 9, 2021 |
$1,201 | $2,610 (by end of 2022) |
$2,610 (by end of FY 2022-23) |
23,000 | 4,600 to 5,750 | ||||
| SK August 13, 2021 |
$1,099 | $3,910 (retroactive to July 2021) |
$5,220 (by end of FY 2025-26) |
28,000 | 5,600 to 7,000 | ||||
| AB November 15, 2021 |
$3,797 | $5,610 (January 2022) |
$8,610 (by end of FY 2025-26) |
42,500 | 8,500 to 10,625 | ||||
| Outstanding Agreements as of December 11, 20216 | |||||||||
| NWT | $51 | $4,950 | $7,300 | ||||||
| NU | $66 | $4,950 | $7,300 | ||||||
| ON | $10,235 | $5,960 | $9,320 | ||||||
| NB | $492 | $3,910 | $5,220 | ||||||
1 National Canada-wide early learning and childhood allocations are calculated based on projected 0-12 child population and include base funding of $2 million per province/territory per year. |
|||||||||
The government has also introduced a number of measures which complement existing protection provided to seniors, families with children, and low-income individuals through indexation to inflation of Old Age Security (OAS), Guaranteed Income Supplement (GIS), Canada Child Benefit, Goods and Services Tax (GST) Credit and other benefits:
- a one-time payment in July 2020 of $300 for recipients of the OAS pension, with an additional $200 for GIS recipients;
- a one-time payment of $500 in August 2021 for OAS recipients age 75 and older, and in July 2022 the government is increasing the OAS pension for those 75 and older by $766 to full pensioners in the first year;
- a one-time increase to the Canada Child Benefit of $300 per child in May 2020 and, in 2021, the government is providing additional payments for children under six of up to $1,200 per child for families entitled to the Canada Child Benefit; and
- a one-time special payment to low-income Canadians in April 2020 by doubling the maximum annual GST Credit amounts for the 2019-20 benefit year (the average benefit from this measure was close to $400 for single individuals and close to $600 for couples).
The government is also taking action to reduce cell phone bills. Data from November 2021 shows that prices for most mid-range plans (2GB-6GB) have gone down between 10 per cent and 33 per cent compared to early 2020 and that these prices are trending downwards.
2.3 The Medium-Term Outlook Remains Encouraging
Economists Expect Solid Growth in Economic Activity
The Department of Finance Canada surveyed a group of private sector economists in early November 2021. The survey results have been adjusted to incorporate the actual results of the National Accounts for the third quarter of 2021 and the historical revisions released on November 30th, 2021. To supplement this, and in light of the uncertain global economic situation associated with ongoing supply chain issues and risks associated with new variants of concern, the Department of Finance has provided two alternative scenarios that account for the ongoing uncertainty facing the economy and analyze faster or slower growth tracks.
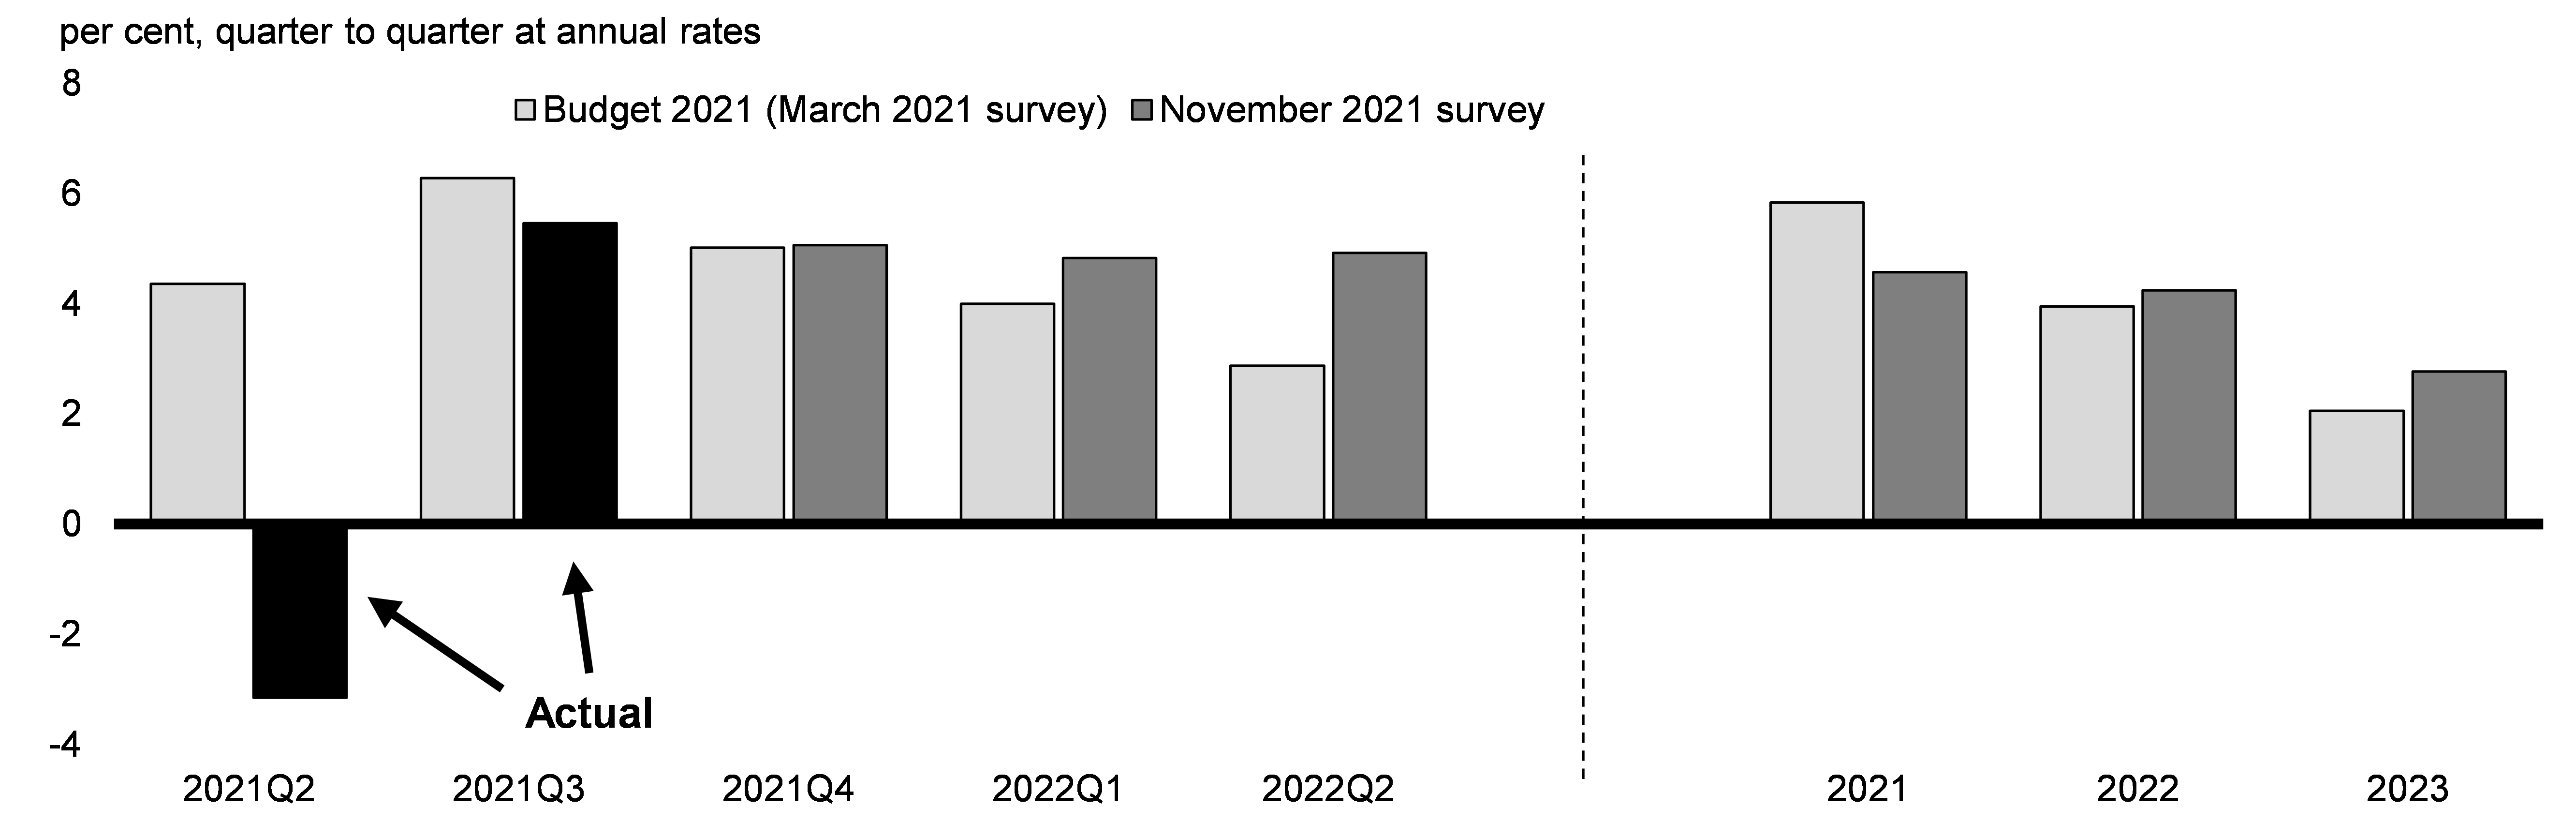
Overall, private sector economists expect solid real GDP growth of 4.6 per cent in 2021, down from the gain of 5.8 per cent expected in Budget 2021. Since Budget 2021, supply chain issues have broadened and intensified throughout the economy, while activity in the housing market moderated following a surge in activity in the first quarter of the year. Together, these two factors led to the first decline in real GDP since the onset of the pandemic in the second quarter of 2021 (Chart 2.25). While GDP and job growth are picking up, led by a healthy rebound in hard-hit services and sustained foreign demand for Canadian commodities, ongoing challenges in supply chains and the housing market continue to weigh on the recovery, leading to slower real GDP growth in the second half of 2021 than expected in Budget 2021.
Real GDP Growth Projections
Growth Projections Broadly in Line with Budget 2021
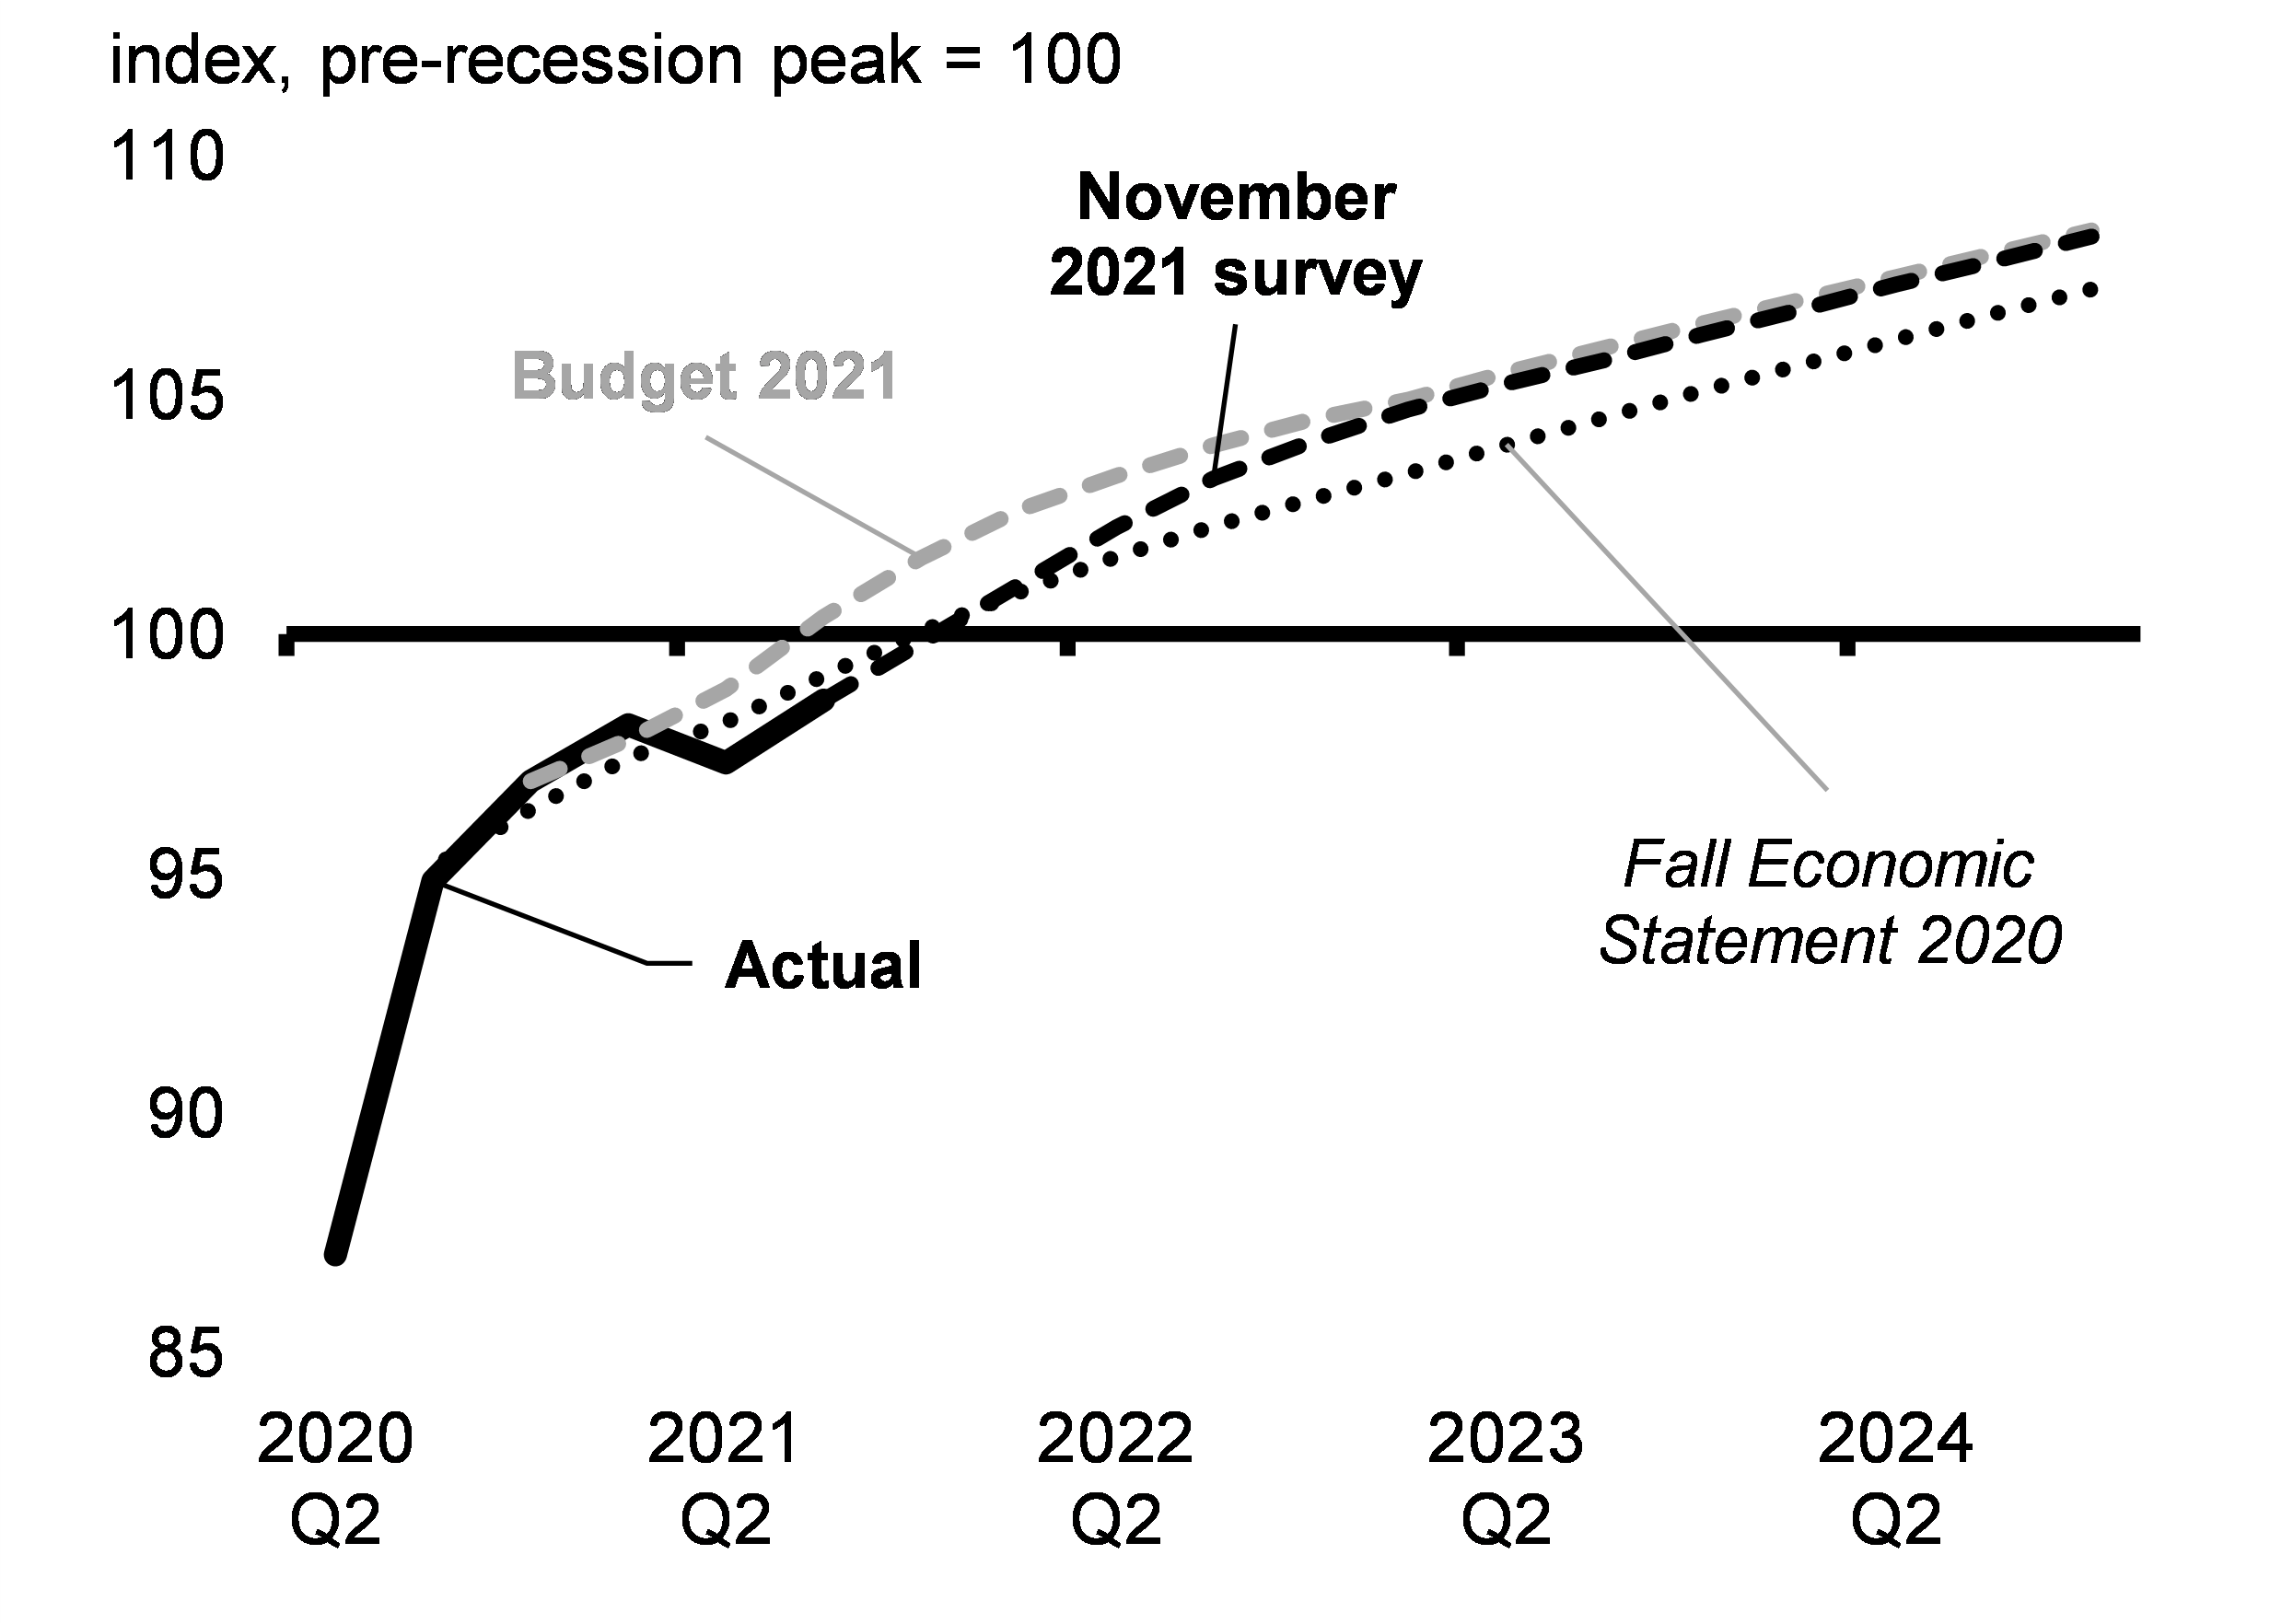
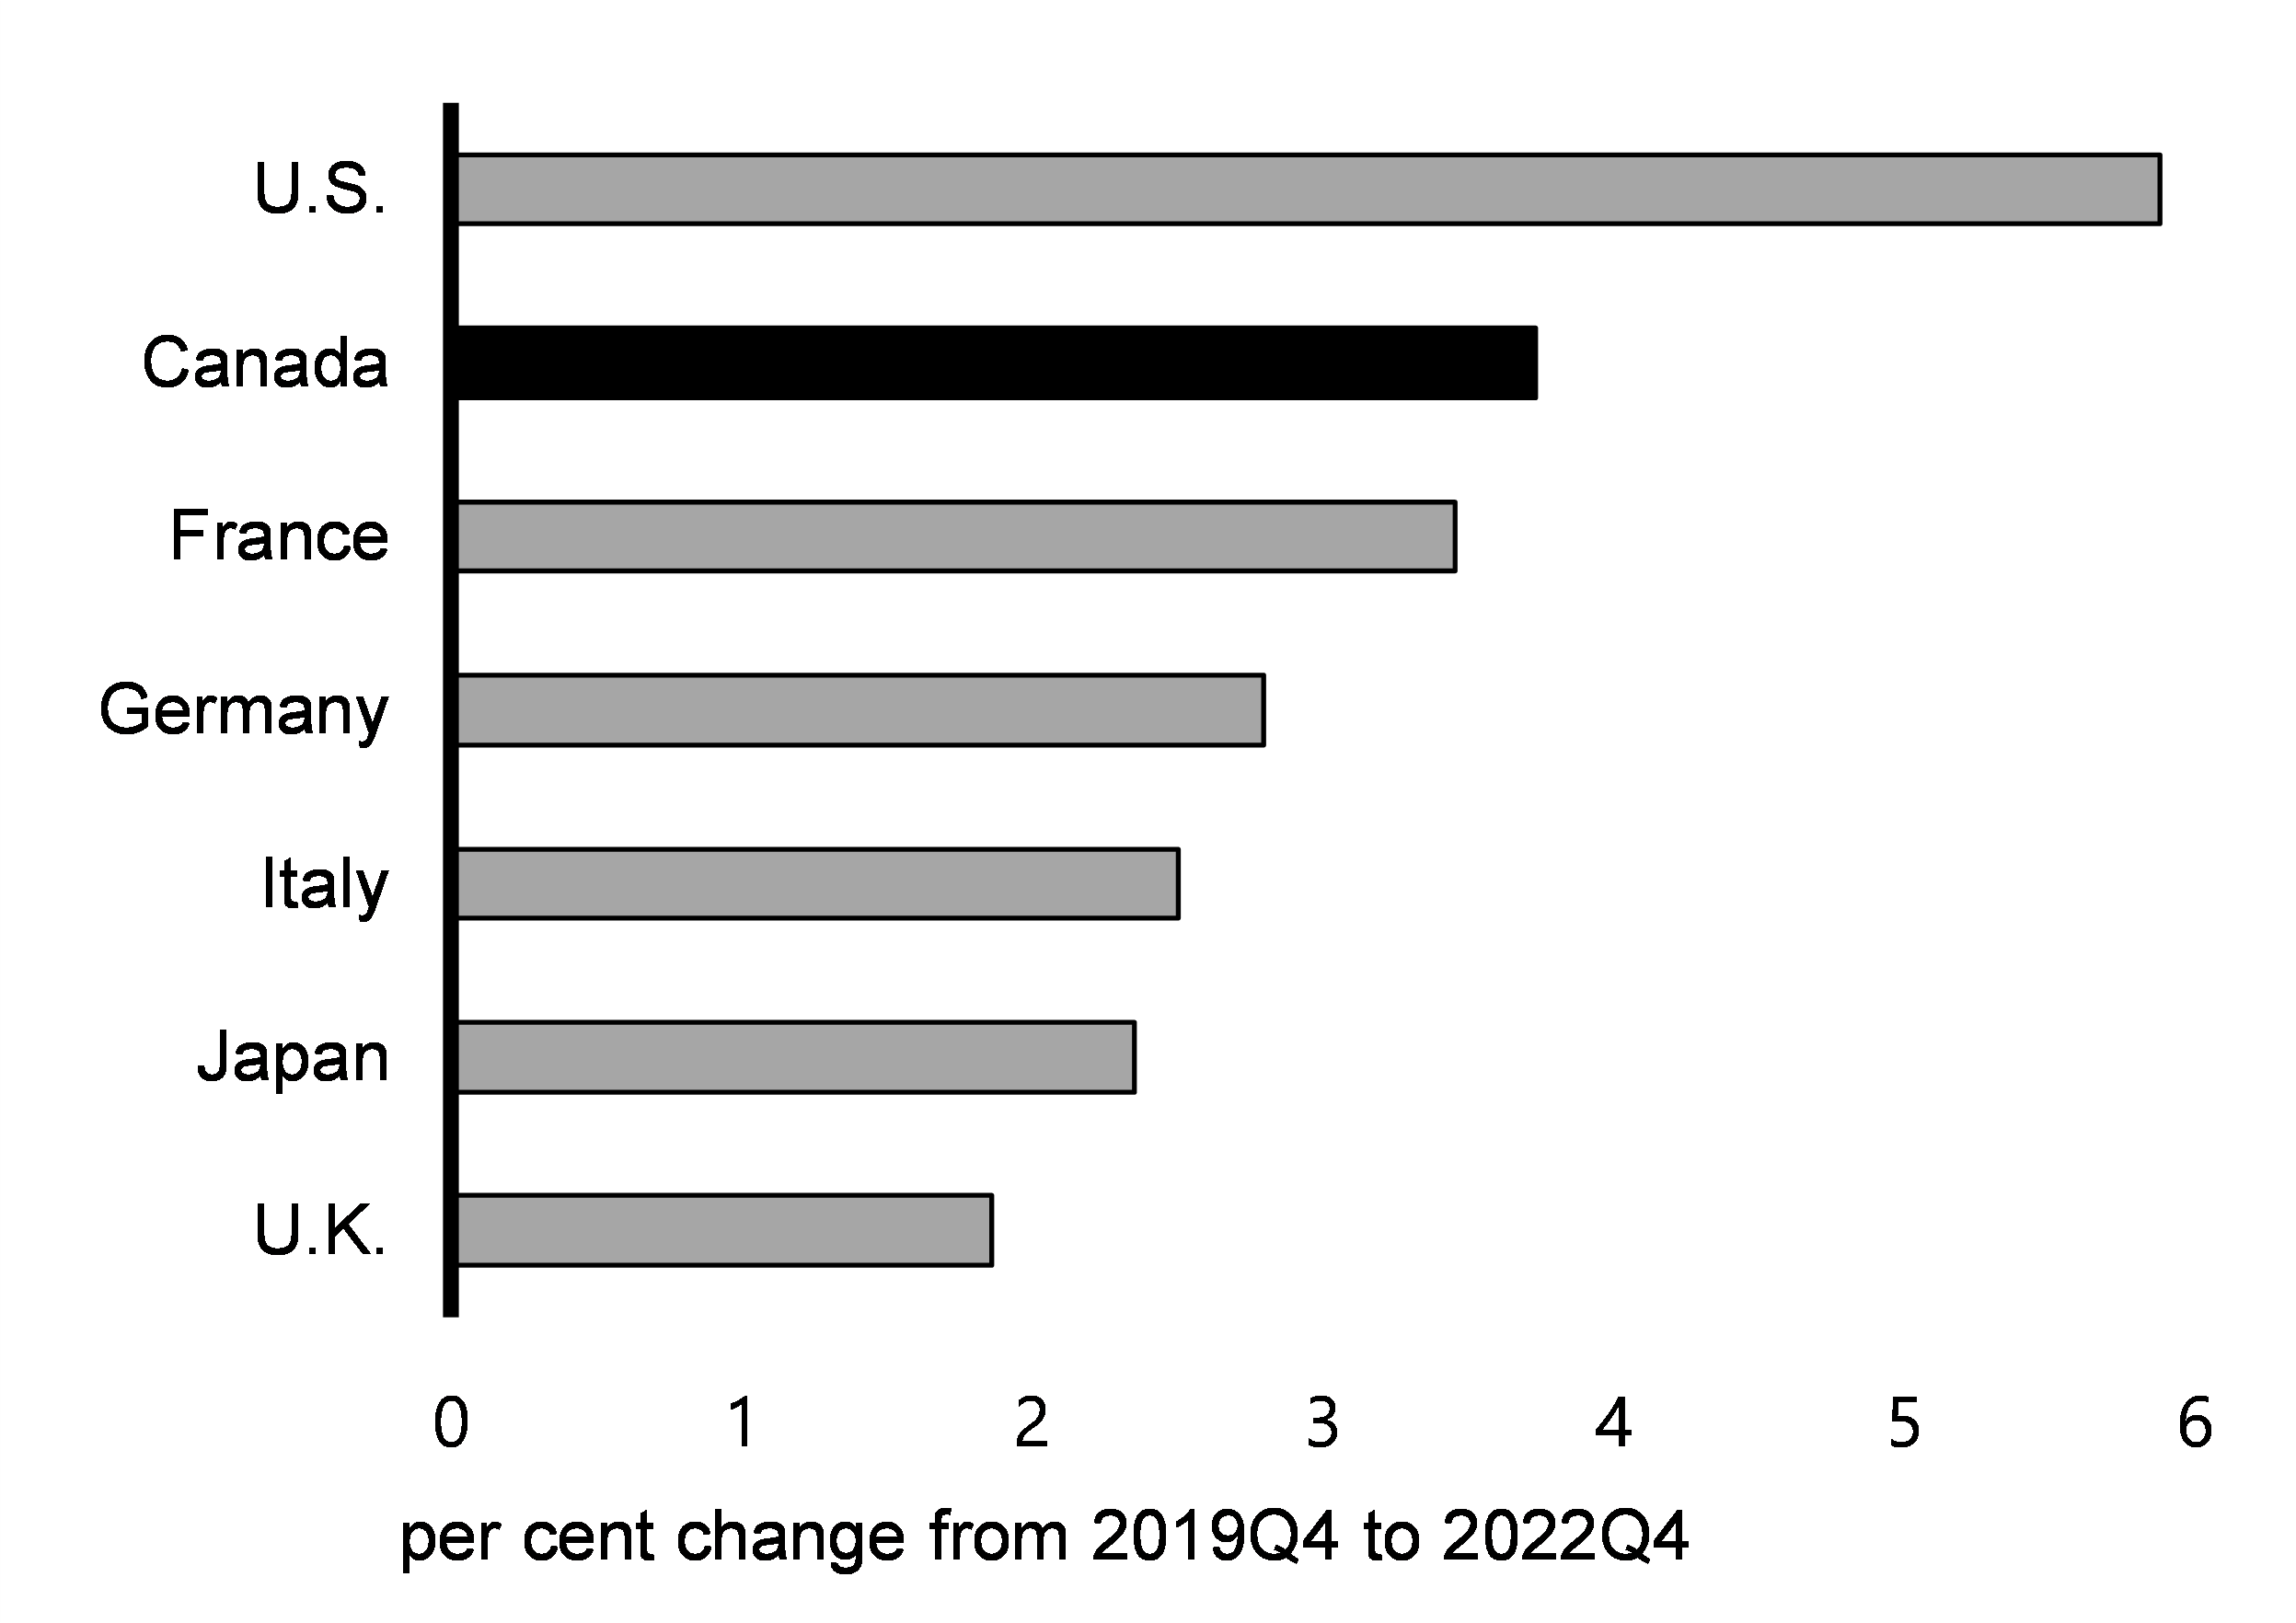
Despite the factors delaying recovery, real GDP is expected to reach its pre-pandemic level by the first quarter of 2022. Real GDP growth should then remain solid at 4.2 per cent in 2022 and 2.8 per cent in 2023, stronger than expected in Budget 2021. As a result, the economy is set to reach a similar level of output by the end of 2022 as expected in Budget 2021 (Chart 2.26). Based on a similar economic outlook, OECD projections suggest the recovery in Canada would be the second fastest (relative to pre-pandemic level of GDP) in the G7 by 2023 (Chart 2.27).
Household Deposits during the Pandemic
Projected Change in Real GDP by 2022Q4
At the same time, the strength in commodity prices led to significantly higher GDP inflation (a measure of price changes for all of the goods and services produced in the economy) in the first half of 2021 than expected at the time of Budget 2021. At 7.6 per cent, the outlook for GDP inflation in 2021 is now double the Budget 2021 projection. As a result, the projected level of nominal GDP (the broadest measure of the tax base) in the November survey is up by an average of about $87 billion per year over the forecast horizon compared to Budget 2021 projections (Chart 2.28) (see Annex 1 for full details of the updated outlook).
Nominal GDP Projections
Canada’s Recovery Is Outpacing Rebound from Previous Recessions
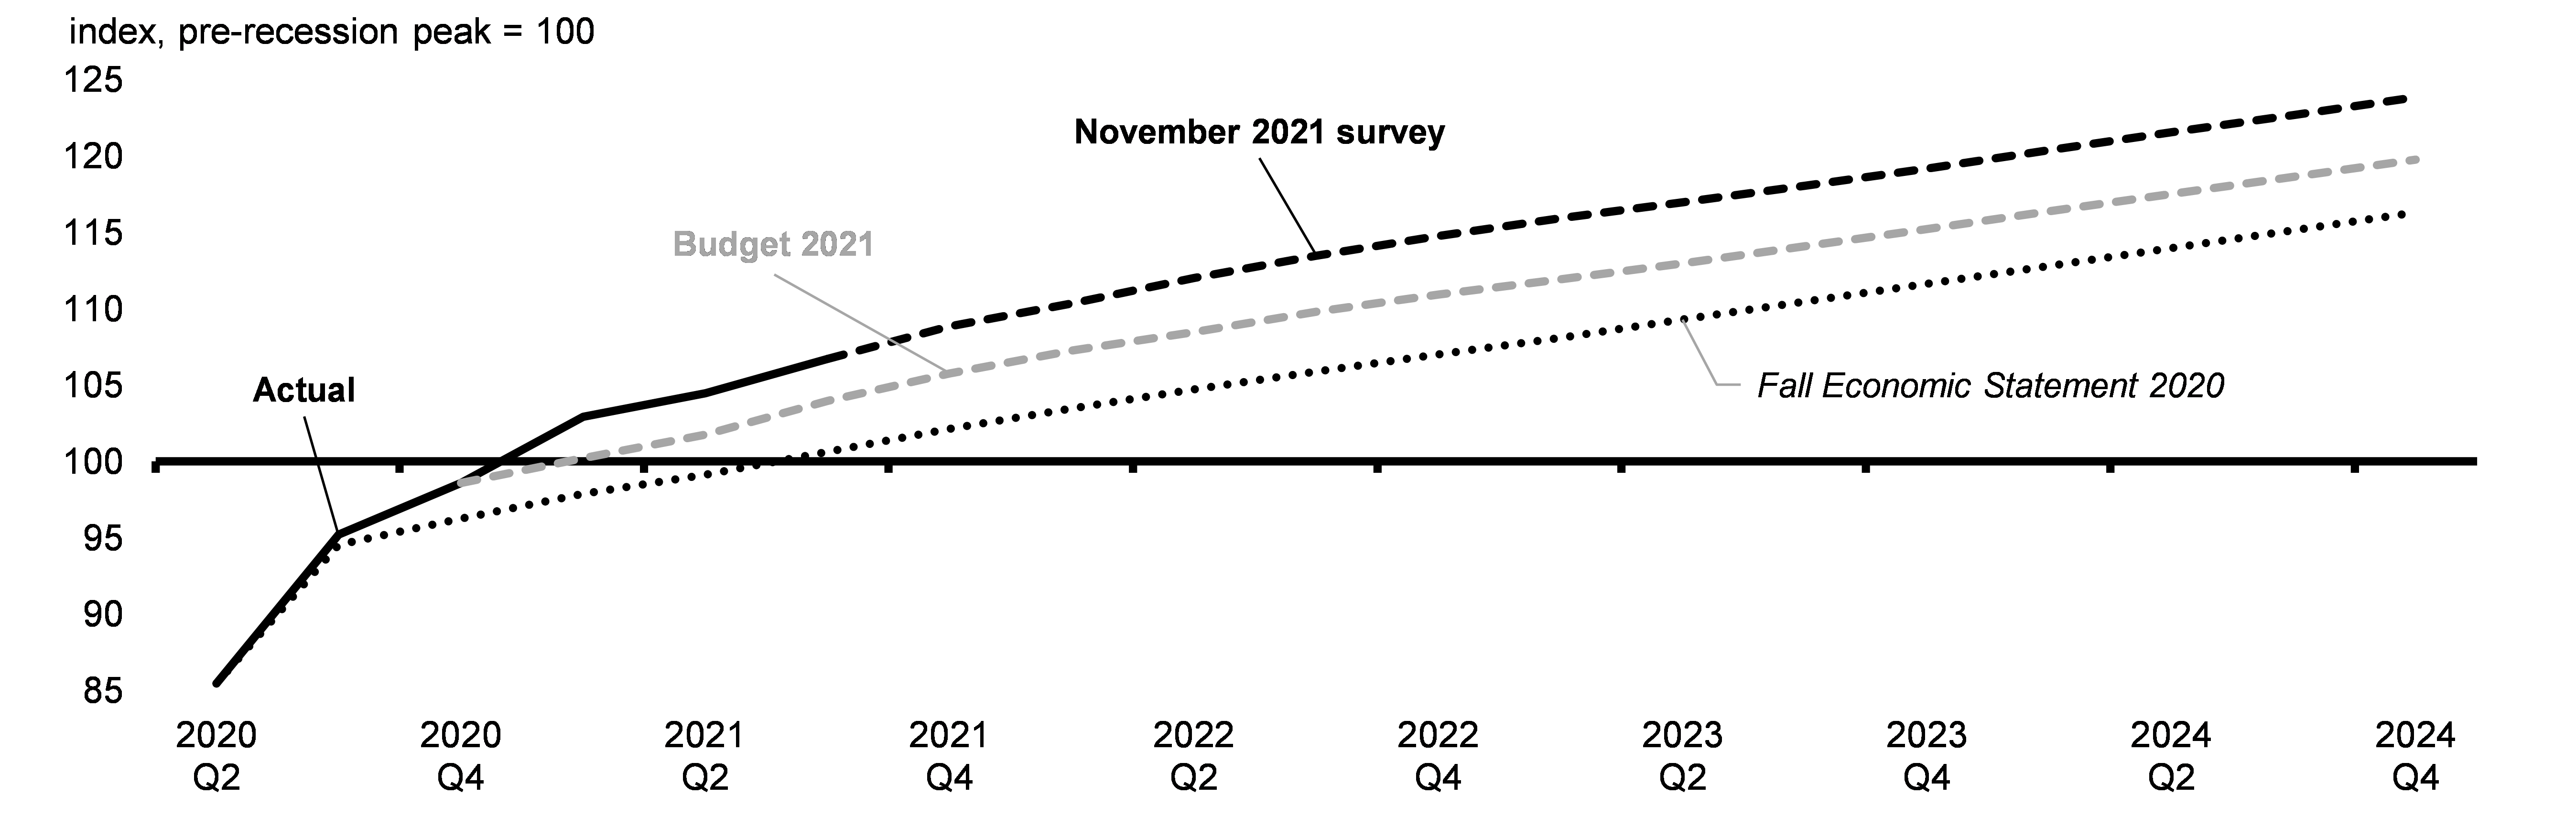
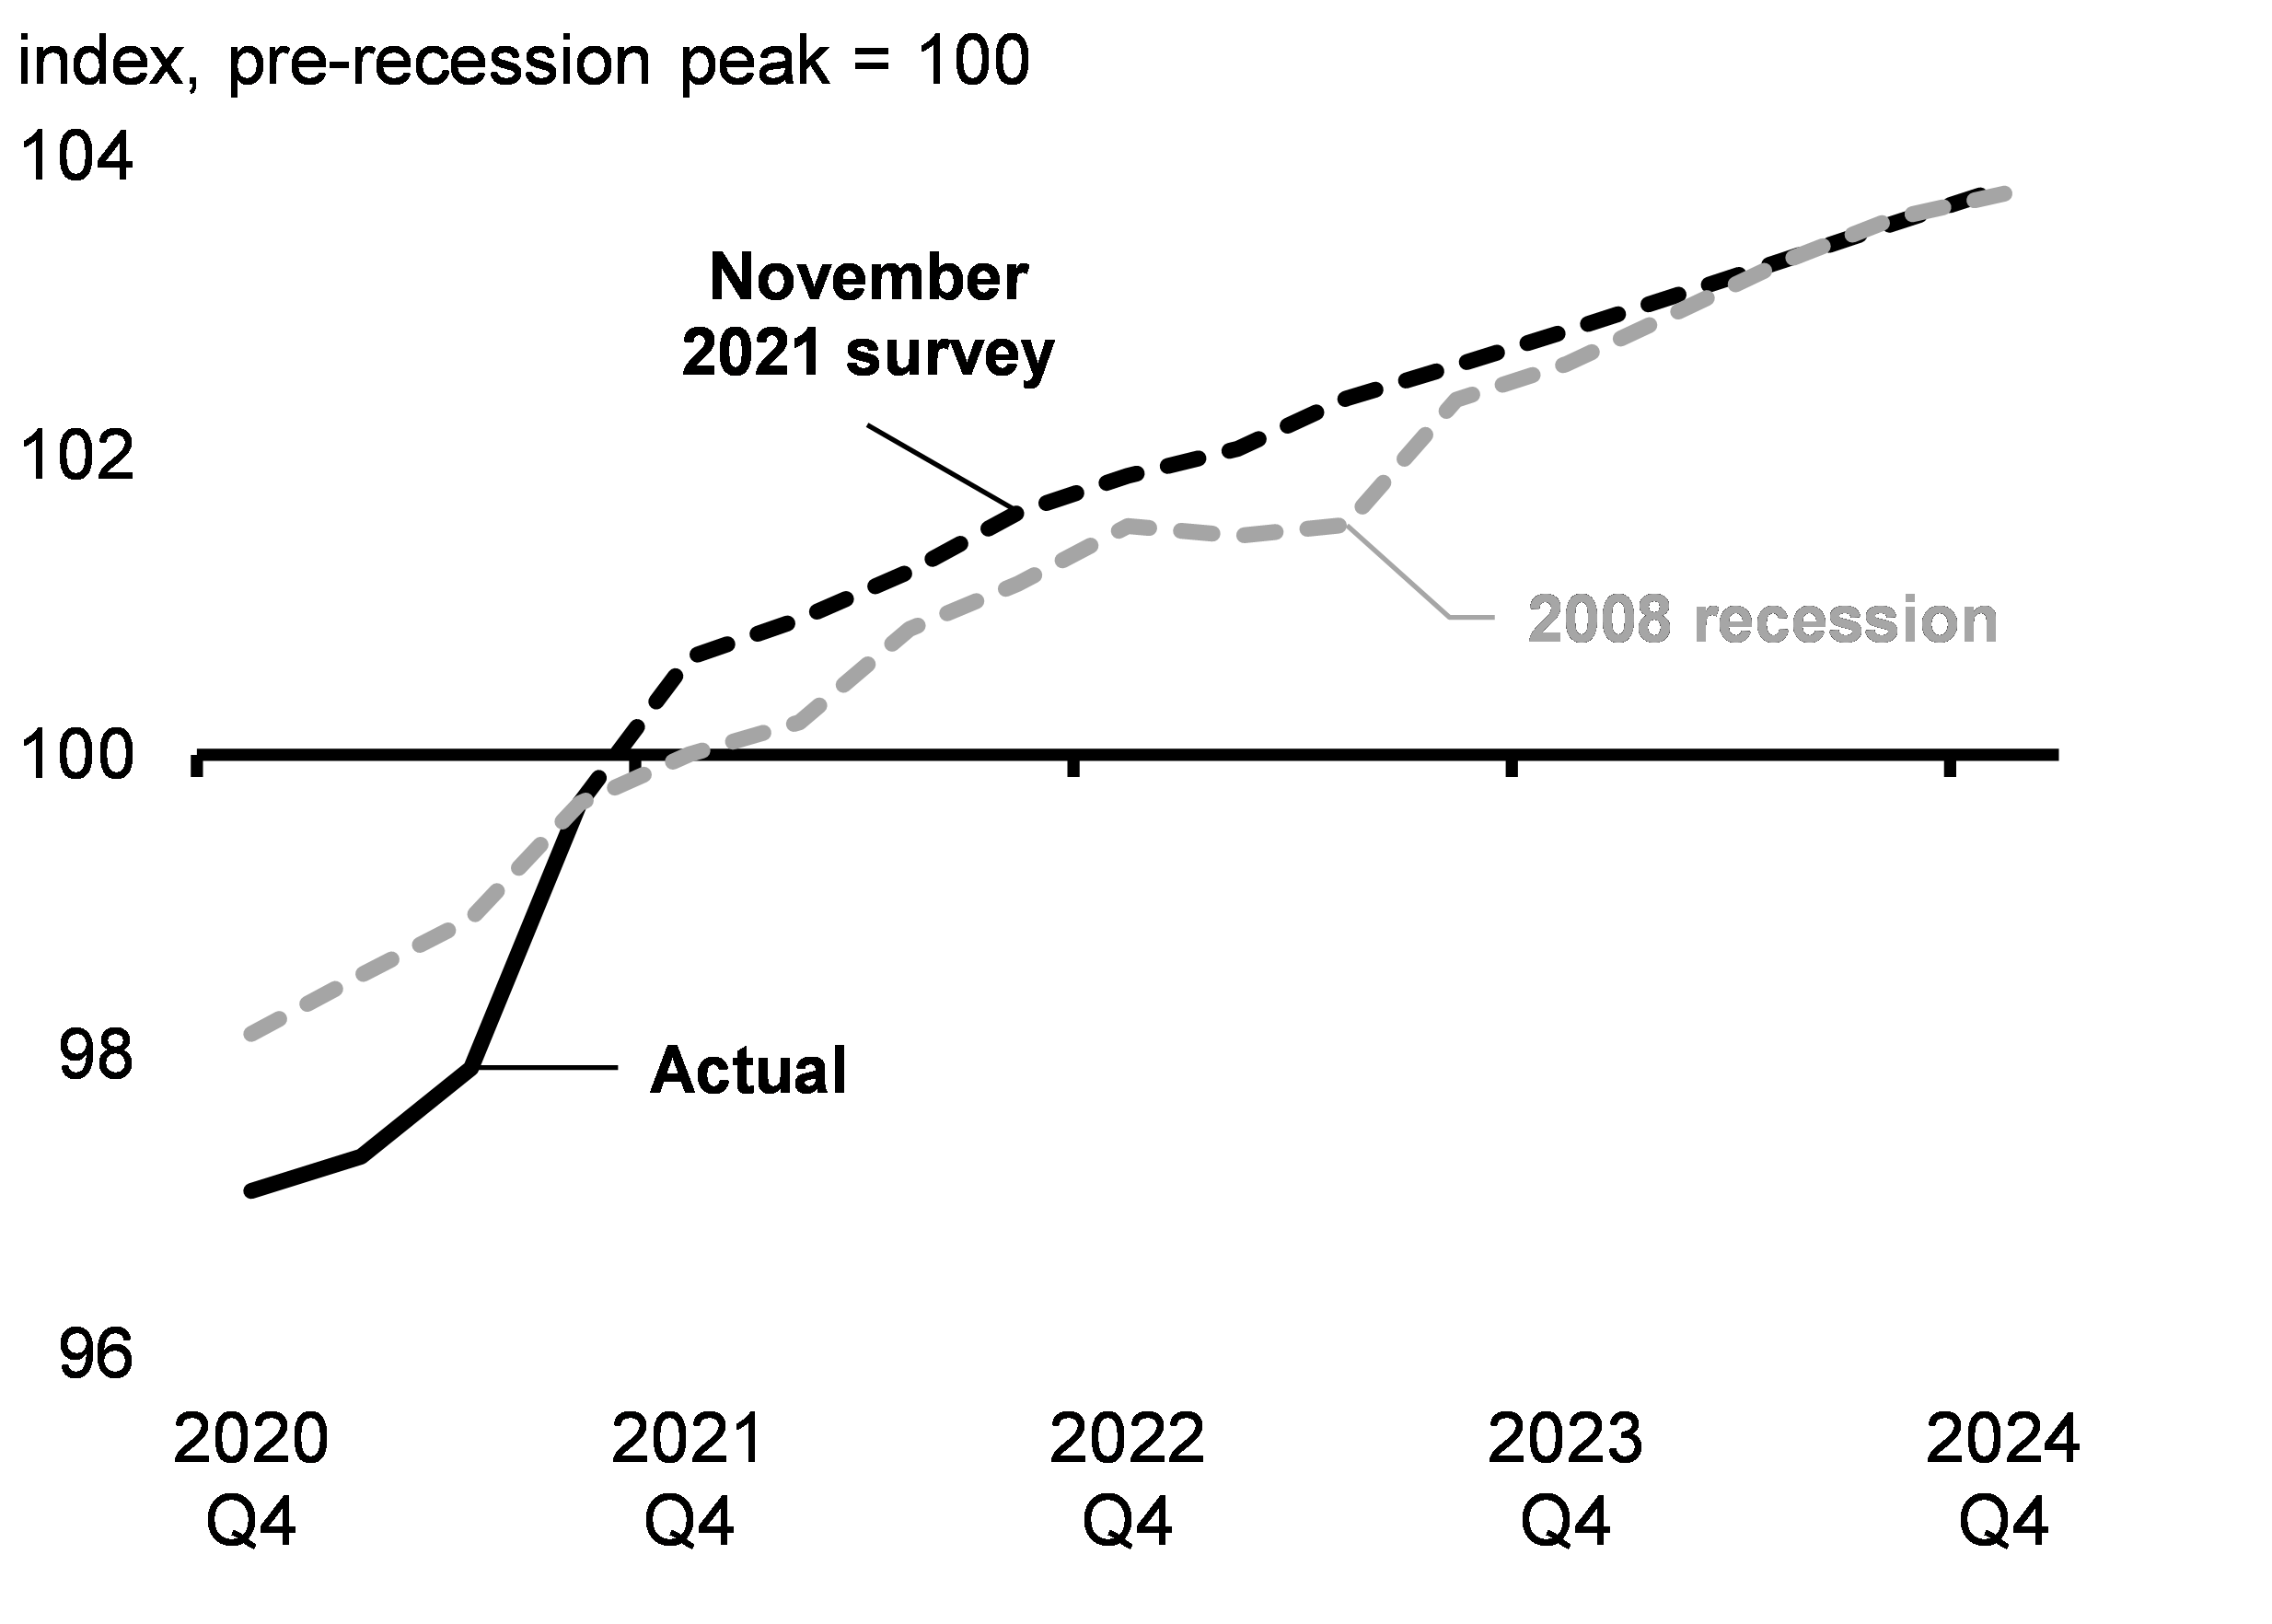
The resilience of the Canadian economy, bolstered by unprecedented fiscal policy support and high vaccination rates, suggests that the lasting effects of the pandemic on Canada’s productive capacity may not be as severe as previously thought. The Canadian economy is expected to experience the fastest recovery of the last three recessions (Chart 2.29). Less scarring means a larger economy in the medium term with lower unemployment and higher wages.
Real GDP Projections Compared to the Pre-Pandemic Outlook and the Experience during Previous Recessions
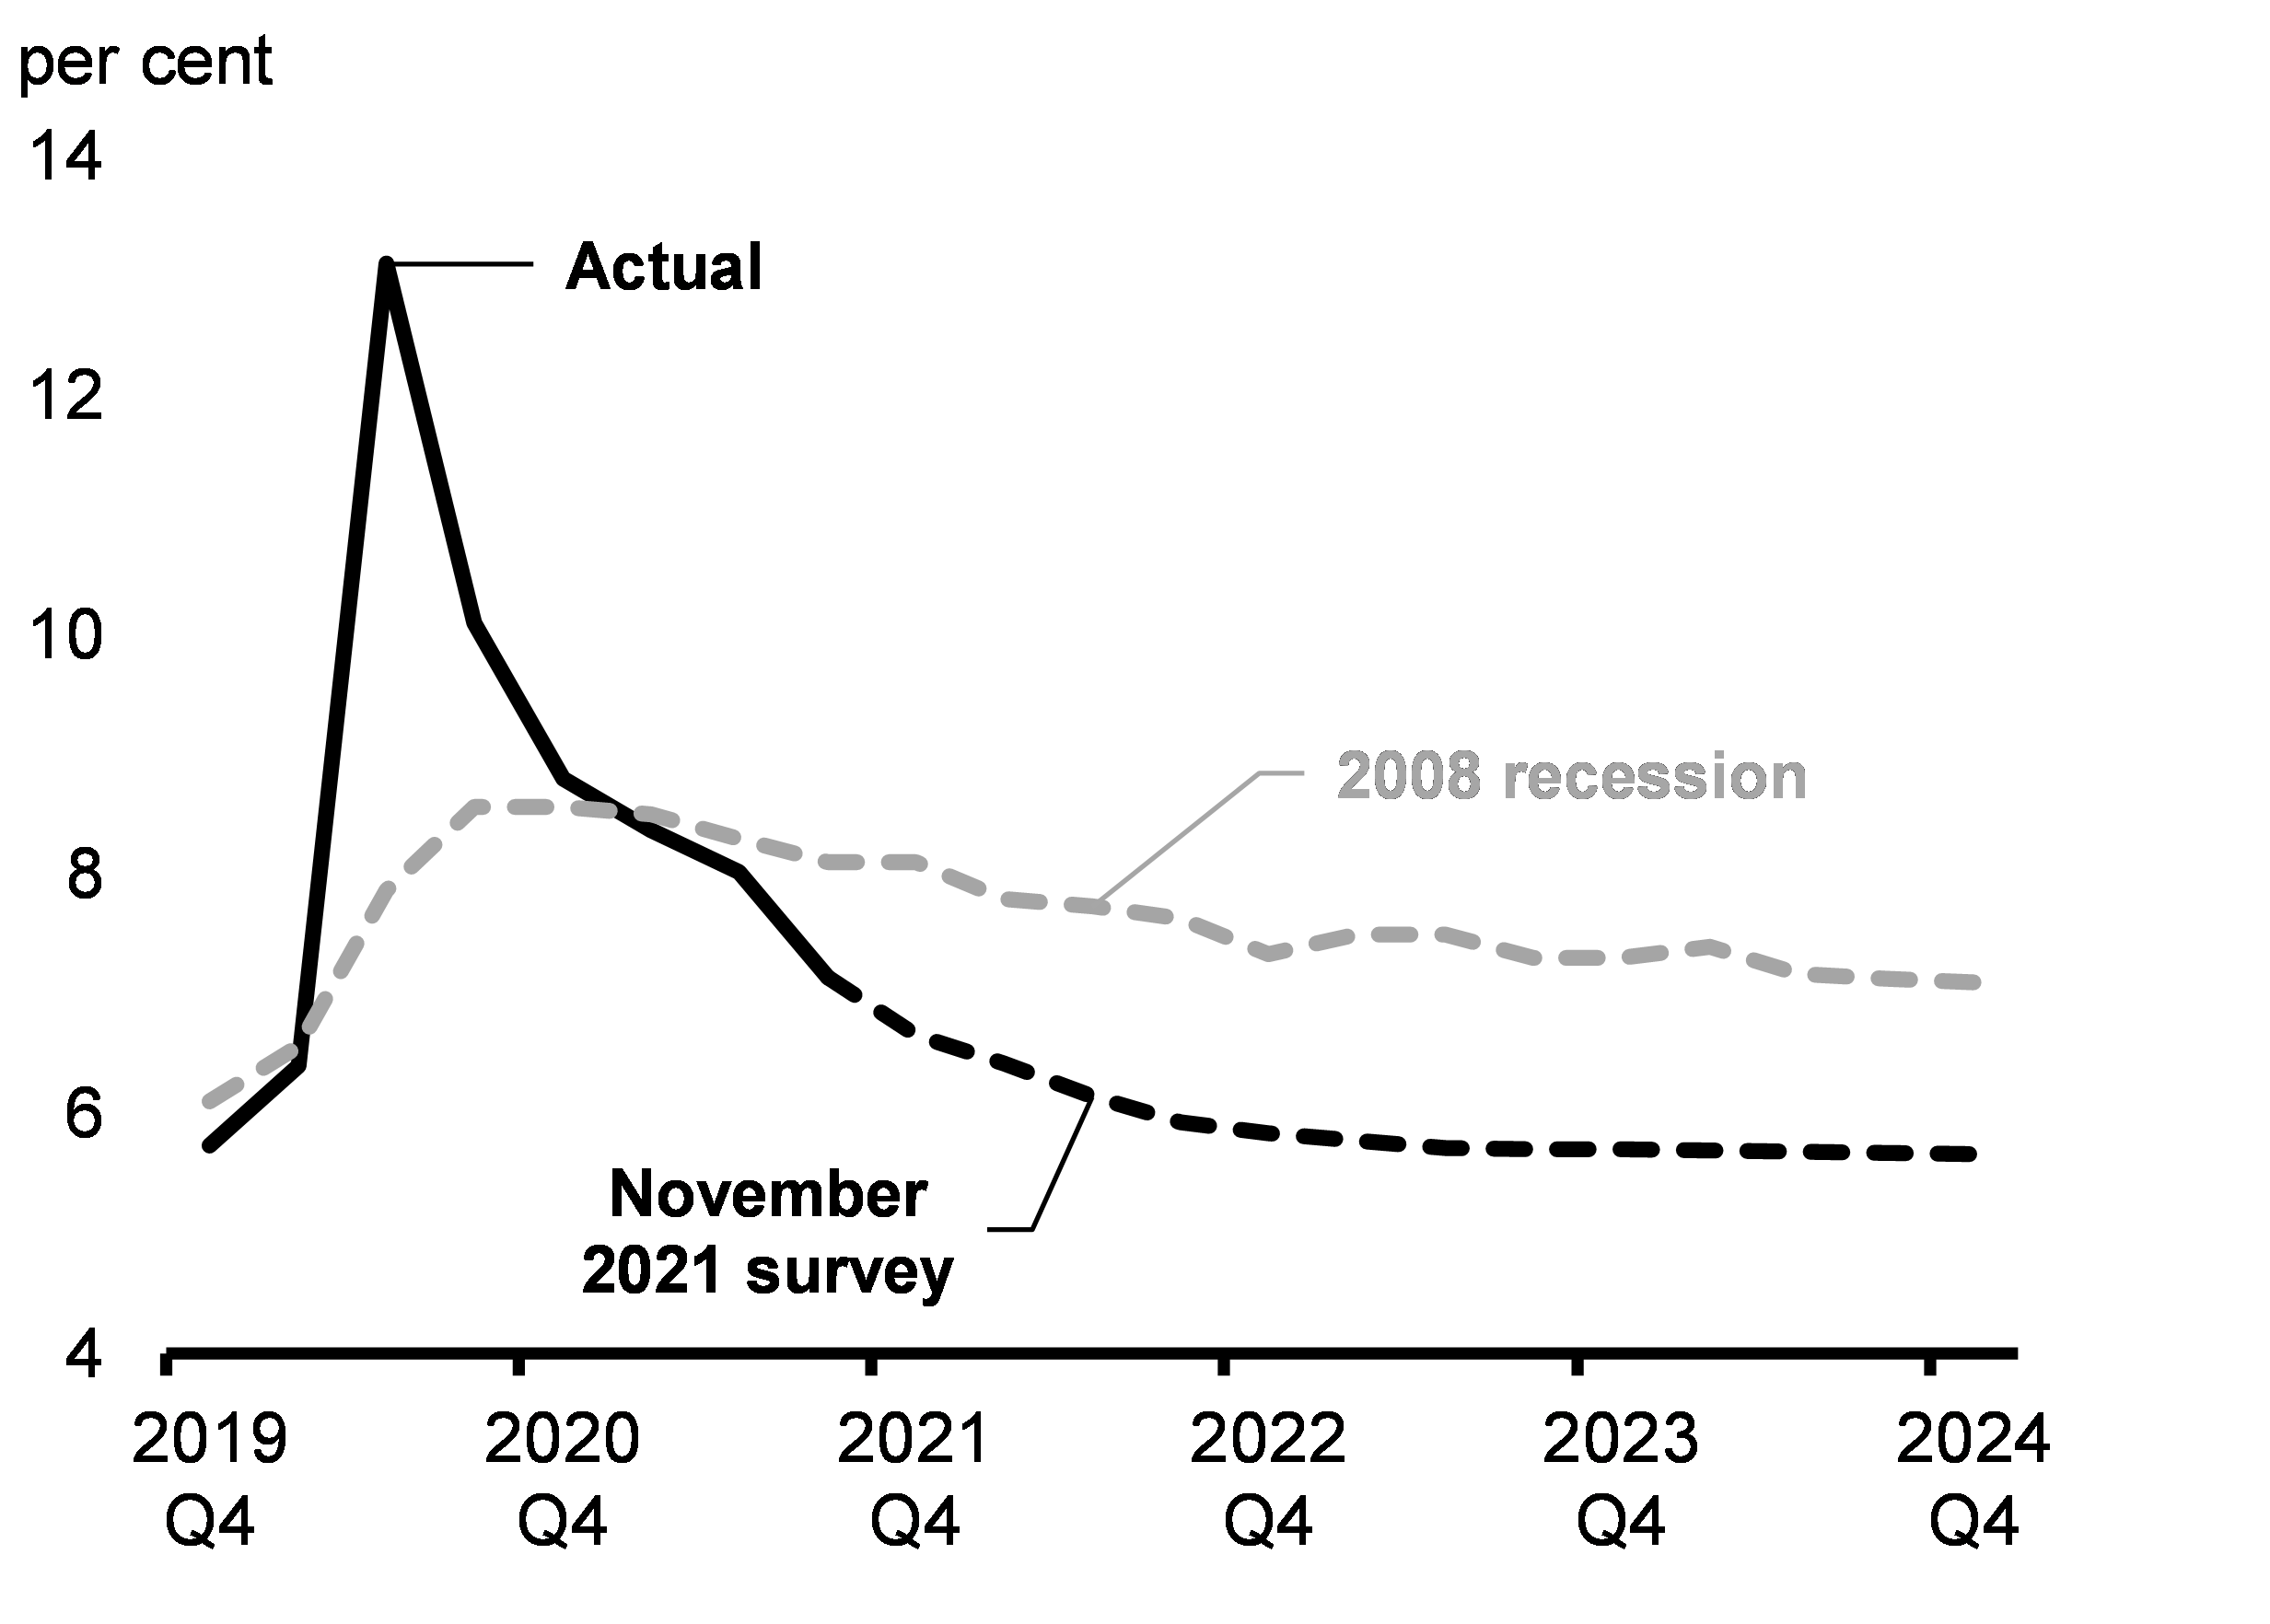
The outlook for the labour market is strong and monthly job gains should continue at an above-normal pace as the remaining slack diminishes (Chart 2.30). With November’s strong job numbers, the labour market recovery is well ahead of expectations. The unemployment rate has dropped to 6.0 per cent, at least six months earlier than expected in the recently completed private sector survey (Chart 2.31).
Employment Projections
Unemployment Rate Projections
Tailwinds and Headwinds for Growth
Although the results of the November private sector survey indicate a robust recovery over the forecast horizon, this outlook remains subject to significant uncertainty. The path forward will depend on a number of tailwinds and headwinds, which could either bolster the recovery or push it off course. Of concern, the global health situation has deteriorated in recent weeks, with resurgences of COVID-19 in some regions and the emergence of a new variant, Omicron.
The recovery continues to be backed by solid underlying fundamentals, which should support robust household spending and business investment. Consumer spending could beat expectations amid a significant build-up in savings by households and the strong rebound in the labour market. Business investment could pick up more than expected given the strength in profits and corporate balance sheets, strong demand, higher commodity prices, and the need for large-scale investment to expand capacity, improve supply chain resiliency, and reduce carbon emissions. More business investment in digitalization could strengthen productivity growth. At the same time, Canada’s world-class universities, growing tech sector, and highly educated and growing workforce will continue to give Canada an economic leg up.
Risks associated with COVID-19 continue to cloud the outlook. While Canada’s vaccination campaign and vaccine mandates have limited the spread of COVID-19 and enabled economic activity to gain momentum, there is still much unknown about the virus, and the emergence of new COVID-19 variants could lead to some setbacks. While it is too soon to determine the economic impacts of the recent resurgence of COVID-19 and the Omicron variant, these developments nonetheless pose a downside risk to Canada’s economic recovery. The global health situation remains fragile. Cases have been rising even in some countries with high vaccination rates, which has led to re-tightening in public health measures, notably in Europe. This could re-intensify global supply chain issues, adding to inflation risks and weighing on growth.
In addition to COVID-19, pockets of supply and labour shortages could constrain economic activity more than anticipated, potentially limiting growth and prolonging inflationary pressures. It will take time for unemployed workers to transition to job opportunities in new sectors and for global supply chains to expand capacity and address current shortages. Global supply chains will likely remain fragile for as long as the virus continues to spread in countries without wide access to vaccines and other measures to limit the spread of the disease. Moreover, the impact of B.C. flooding on critical transportation infrastructure and the flow of goods could put further pressure on supply chains in the near term, temporarily weighing on the recovery and increasing the prices of certain goods.
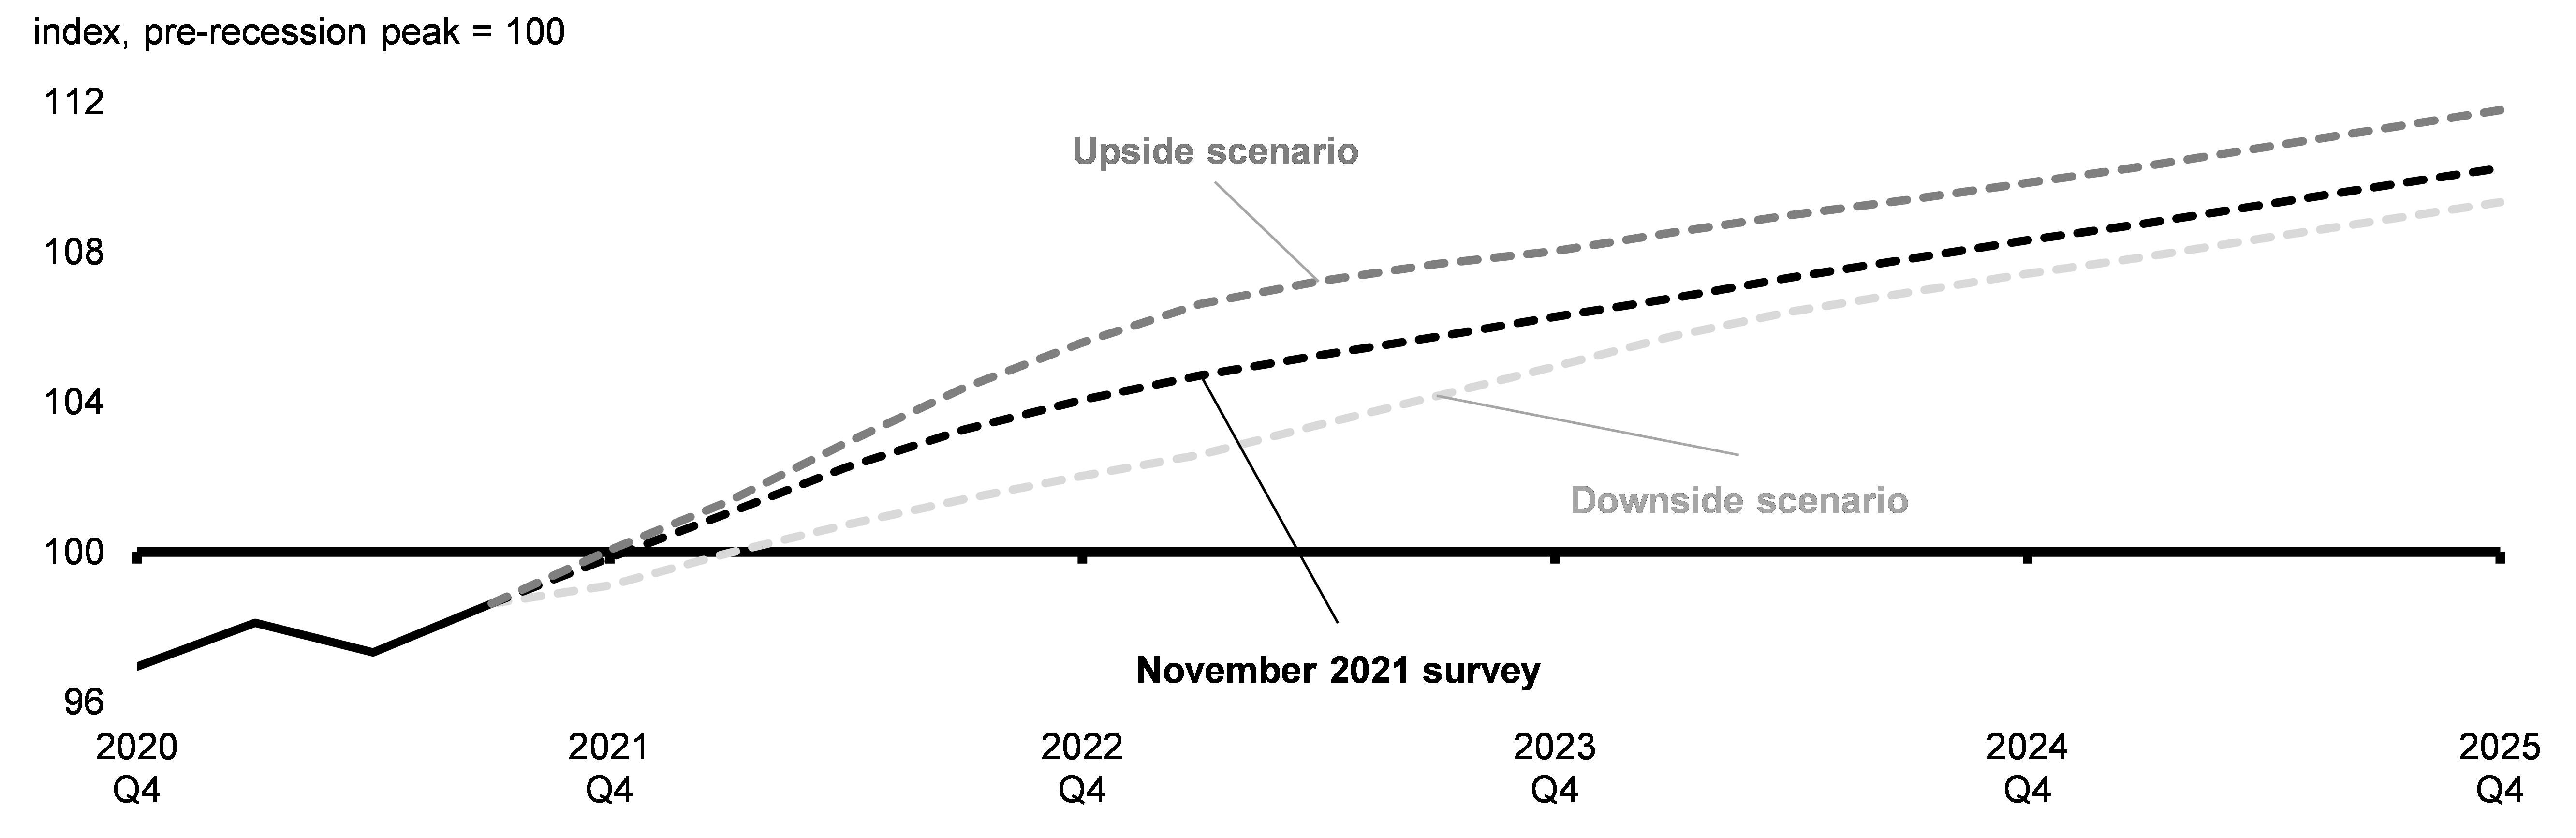
A high degree of uncertainty remains around the trajectory of the recovery. To illustrate the uncertainty in the medium-term outlook, the Department of Finance Canada has considered two alternative scenarios to the private sector projections (see Annex 1 for full details of the alternative scenarios).
Alternative Scenarios for the Medium-Term Outlook
The Department of Finance Canada’s downside scenario considers the impact of more prolonged supply-side issues and difficulty in adapting to COVID-19 if new variants of concern, such as Omicron, delay the return to normal economic conditions (Chart 2.32). Resurgent waves of the virus prevent a full recovery in hard-hit businesses in sectors requiring close contact, large gatherings, or international travel—leading to persistent unevenness that weighs on Canada’s economic potential. The ongoing pandemic also exacerbates the supply disruptions and labour shortages impacting a range of industries, with acute challenges extending until 2023. Meanwhile, the severe flooding in B.C. puts additional pressure on supply chains in the near term, weighing on the recovery in the fourth quarter of 2021. Despite weaker growth in the downside scenario compared to the November private sector survey, supply and labour shortages create significant cost pressures which keep inflation somewhat elevated into the second half of 2022.
In contrast, the upside scenario considers a world in which supply-side issues are resolved more quickly than expected. While certain industries continue to face challenges, the most acute supply and labour shortages ease by early 2022 as businesses adjust their supply chains and boost capital spending to alleviate capacity pressures and supply shortages. Meanwhile, Canadian consumers and businesses continue to adapt to ongoing COVID-19 risks, enabling a shift in spending from goods to services that takes pressure off supply chains and supports a robust recovery in hard-hit sectors. With stronger growth, inflation could be stronger than expected over the near term as robust demand offsets fading pressures from supply constraints. However, with increased inflationary pressures, elevated equity valuations, and elevated levels of indebtedness, a pullback in risk appetite could trigger a sharp tightening of global financial conditions—weighing on the global and Canadian recoveries.
Real GDP Projections
Report a problem on this page
- Date modified: