
Annex
2:
Capital budgeting framework
Building Canada's Productive Capacity
As announced on October 6, 2025, the government is adopting a Capital Budgeting Framework—a new way of budgeting that makes capital investment a national priority. This framework helps distinguish day-to-day operational spending from capital investment (broadly defined as spending that supports capital formation), allowing the government to identify and prioritise initiatives that deliver long-term economic returns. The framework also increases transparency, allowing Canadians to better understand what funds services today, and what builds future prosperity.
An Example of Capital Investment: Expanding Airport Cargo Capacity
Cargo capacity at airports is essential for strengthening supply-chain links for communities and businesses. Each year, operating expenses cover recurring costs such as cargo handlers, ground support, maintenance personnel, fuel costs and utilities to keep these cargo services running. This operating spending is necessary for efficient and reliable service, but it does not contribute directly to capital formation.
On the other hand, expanding cargo capacity is a capital investment. Building warehouses, upgrading cold-chain facilities, and strengthening taxiways for freighters create long-lived assets that transport goods more efficiently. These upgrades reduce turnaround times and move more freight per hour—getting goods to businesses faster and improving service reliability for communities. The benefits compound year after year because the new assets work every day, building value. This enhances productivity and business investment.
This is why a capital budgeting framework is important. It distinguishes day-to-day operating dollars from the dollars that build long-lived assets, allowing the government to prioritise the latter and help deliver lasting benefits to Canadians.
Capital investments are the building blocks to economic growth. Capital investments boost Canada's productivity, helping deliver more and better paying jobs, supporting rising living standards for all Canadians over the long term. While U.S. business investment has grown steadily, Canada's has remained close to its 2015 levels (Chart A2.1). Canada's growth has been held back by weak productivity associated with low investment in business capital— particularly in machinery, equipment, and intangible assets like intellectual property (Chart A2.2). In a global economy increasingly shaped by shifting trade dynamics and rapid adoption of artificial intelligence, this gap weighs on competitiveness and resilience. To reverse this trend, Canada requires a step change in capital investment, with renewed commitment from both the public and private sectors to make growth-enhancing capital investment a national priority. The Capital Budgeting Framework ensures that growth and productivity are core elements of the fiscal planning architecture across the federal government.
Real Non-Residential Business Investment Since 2000, Canada and U.S., 2000Q1-2025Q2

Non-Residential Investment as a Share of GDP, Canada and U.S., 2023

The Capital Budgeting Framework builds on established public financial management practices used in advanced economies and adapts them to a made-in-Canada approach. As an example, the United Kingdom separates capital spending (investment in long-lived assets) from current spending for planning, reporting, and control, consistent with their national macroeconomic accounts. Singapore similarly distinguishes operating from "development" expenditures, defined as long-term investments that advance economic development and welfare. In Singapore, the government may borrow only to finance "nationally significant" capital investments, while other spending must generally be covered by revenues. The objective is fiscal sustainability and intergenerational fairness, so that debt incurred today is tied to assets that benefit future generations.
Table A2.1 compares capital budgeting approaches in the United Kingdom, Singapore, Canadian provinces, and the Canadian federal government.
|
|
United Kingdom |
Singapore |
Canada Provinces |
Canada Federal (Budget 2025) |
|---|---|---|---|---|
|
Operating/capital split presented in budgets? |
Yes |
Yes |
Partial1 |
Yes |
|
Some capital excluded from jurisdiction-specific deficit constraint? |
Yes |
Yes |
Yes2 |
Yes |
|
by type: |
||||
|
Capital amortisation |
No |
No |
No |
Yes |
|
Acquisition of tangible capital assets3 |
Yes4 |
Some5 |
N/A6 |
N/A7 |
|
Acquisition of intangible capital assets3 |
Yes4 |
No |
N/A8 |
N/A7 |
|
Capital transfers to sub-levels of government |
Yes |
No |
No9 |
Yes |
|
Capital transfers to private sector |
Yes |
No |
No9 |
Yes |
|
Corporate income tax credits |
No |
No |
No |
Yes |
|
1 Spending in the main budget tables is generally not split between operating and capital, and the key fiscal metrics are using the same accounting basis for reporting actual financial results under the Canadian public sector accounting standards. However, provinces also present a capital or infrastructure plan either as part of their main budget document or separately. 2 Not all provinces have an explicit deficit constraint. 3 For comparison purposes, refers only to capital assets to be amortised over their useful lives under each jurisdiction's accounting practices. 4 The United Kingdom budget explicitly presents in its main budget tables the net acquisition of capital (i.e., excluding amortisation) as part of its "public sector net investment" fiscal metric, which is excluded from its stability (current budget) rule. 5 In Singapore, only a small fraction of capital spending is excluded from the country's "balanced budget over each term of government" constraint. It is limited to "nationally significant" projects (≥ S$4 billion, ≥ 50-year life, productivity or sustainability benefits, government-owned) and subject to a hard S$90 billion cap. The budget impact from these projects is from amortising the assets over their useful life after construction. 6 Canadian provinces generally present amounts associated with the acquisition of tangible capital assets in their capital or infrastructure plan, but not in the main budget tables. In alignment with Canadian public sector accounting standards, amortisation expense, rather than acquisition cost is included in the provinces' key budgetary balance metrics. 7 Considered in the federal Capital Budgeting Framework through capital amortisation only. 8 Some provinces include intangible capital assets in their capital or infrastructure plans. 9 Some provinces do present capital transfers to municipalities and the private sector as part of their capital or infrastructure plans. These transfers are included in the budgetary balance, reflecting the same accounting principles for reporting actual financial results, and, when applicable, are subject to the deficit constraint. |
||||
Definition and Categories
The Capital Budgeting Framework establishes a consistent way to classify spending, including tax expenditures, that contributes to capital formation—referred to here as capital investment—while maintaining pre-existing categories used in budgets and financial reports.
Capital investments, for the purposes of the framework, are defined broadly as any government expenditures or tax incentives that contribute to public or private sector capital formation, held directly on the government's balance sheet or on that of a private sector entity, Indigenous community or another level of government. Within this broad definition, the focus is on capital investments that meet the following criteria:
- Conditionality – whether the funding recipient is required to invest in capital formation to receive the benefit.
- Clear linkage – whether the spending encourages or enables capital investment in identifiable sectors or projects.
Applying this definition, federal government spending classified as capital investment is categorised as follows:
- Capital transfers – transfers to other levels of
government and organisations expressly intended for the recipient to invest in infrastructure or
a productive asset.
- Transfer payments, and other forms of support, are classified as capital investments when the recipient (e.g., a province or territory, an Indigenous community, an arms-length or private organisation) is required to use the funds to build, acquire, or better capital assets, with reporting to the federal government for monitoring. Unrestricted transfers count towards the day-to-day operating budget. For Indigenous infrastructure, including transfers under modern treaties, self-government, new fiscal relationships, and similar arrangements, the conditionality criterion is applied in a manner consistent with self-determination.
- Capital-focused tax incentives – tax expenditures intended to incentivise
new capital formation.
- Tax expenditures (predominantly corporate income-tax related) are classified as capital investments when the measure directly incentivises investment in capital rather than ongoing operations.
- Amortisation of federal capital assets – expenses recorded to spread the
cost of capital assets owned or controlled by the federal government over their useful lives.
- This is aligned with existing reporting of amortisation of federal capital assets in the Public Accounts of Canada, which is based on Canadian public sector accounting standards.
- Examples of federal capital assets include buildings, machinery and equipment, aircraft, etc.
- Private sector research and development – direct funding, or tax
incentives, for research and development (R&D) activities that enable commercialisation or
scale-up and raise future productive capacity.
- Private sector R&D is emphasised given its closer link to commercialisation and production, and more direct tie to asset formation.
- Support to unlock large-scale private sector capital investment
– contractual agreements with proponents involving exceptional, significant
operating subsidies designed to unlock incremental large-scale private capital investments.
- Although these transfers to private sector entities are expressly intended to support operating costs, they are delivered under a contractual agreement requiring the recipient to make prescribed capital investments and are therefore classified as capital investment under the framework.
- Measures to grow the housing stock – measures that accelerate new housing
supply.
- Initiatives that contribute to private sector capital formation, such as building new homes, as well as those that lift construction productivity through significant at-scale programs.
Spending not classified as capital investment is considered day-to-day operating spending. This includes major government expenditures like transfers to persons, health and social transfers, and the costs of running government operations and services, including salaries and benefits. This spending remains essential for service delivery and accounts for the bulk of government spending.
Consistent with the presentation of the federal budget, under the Capital Budgeting Framework projected costs of capital investments are determined on a full accrual basis of accounting. Using a consistent basis of accounting makes it easier to understand how changes in capital investments impact the budgetary balance, and promotes comparability.
Projected fiscal costs of capital investments over the budget horizon are generally similar on cash and accrual bases for a given year, except for mostly temporary timing differences for federal capital assets, loans and guarantees. For example, under accrual accounting, the cost (cash basis) of acquiring federal land, buildings, equipment and other capital property, like bridges is capitalised, recorded as an asset and, except for land, amortised to expense (accrual basis) over the useful life of the capital property. For loans, cash impacts reflect the disbursement and repayment of loans, whereas accrual costs reflect allowances recorded to reflect concessionary terms and collectability and risk of loss.
On a cash basis, the total fiscal cost of capital investments included in Budget 2025 would be about $450.6 billion over five years.
Detailed Outlook for Capital Investments
Table A2.2 provides further detail on projections for major capital investments, organised by the framework's six categories. Historical information is provided in Table A2.3. Unless otherwise specified, these projections are based on Department of Finance estimates. In the coming months, the Department will work with the Treasury Board Secretariat and participating organisations to develop an ongoing reporting approach for capital investments, leveraging existing sources wherever possible.
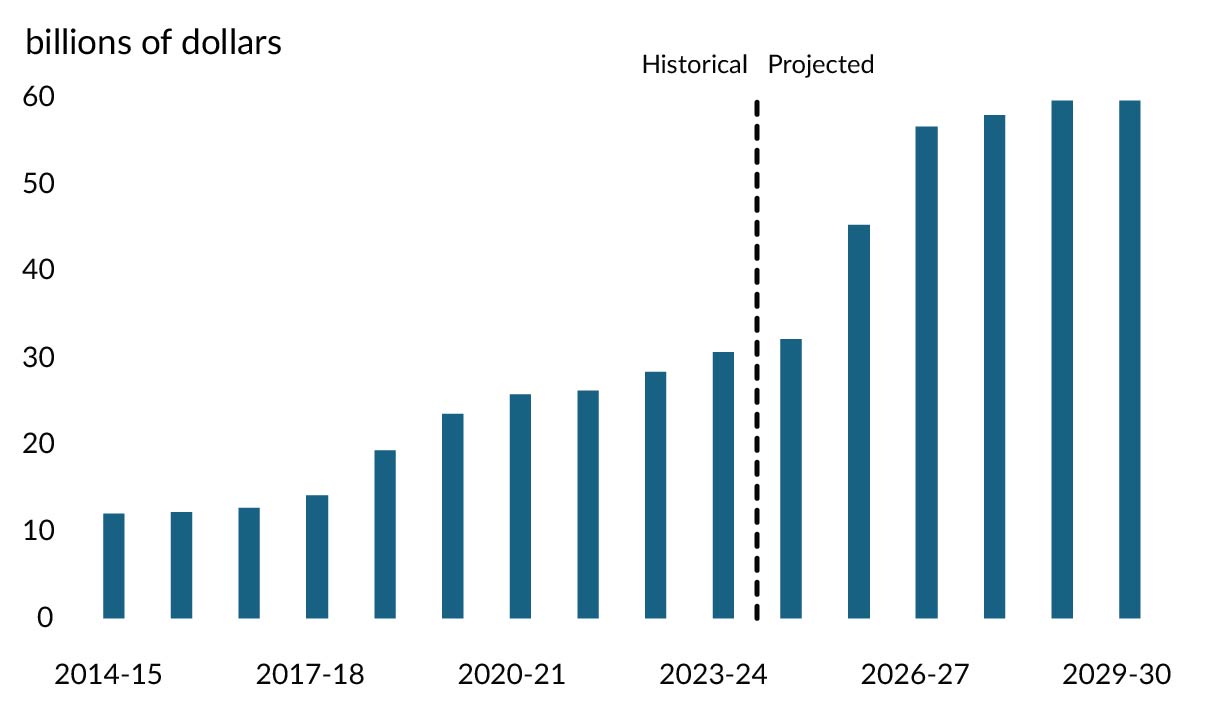
Capital investments over the budget horizon account for a larger share of spending than during the previous 20 years. With measures in the budget, annual capital investment will also nearly double from $32.2 billion in 2024-25 to $59.6 billion in 2029-30 (Chart A2.3).
Capital Investment Expenses, Historical and Projected
| Projection | ||||||
|---|---|---|---|---|---|---|
| 2024-2025 | 2025-2026 | 2026-2027 | 2027-2028 | 2028-2029 | 2029-2030 | |
| Capital transfers | 16,395 | 20,578 | 26,051 | 27,989 | 26,167 | 24,388 |
| Baseline | 16,372 | 19,287 | 19,579 | 19,720 | 18,642 | 16,896 |
| Canada Community-Building Fund | 2,368 | 2,467 | 2,467 | 2,566 | 2,566 | 2,668 |
| Investing in Canada Infrastructure Program | 2,295 | 2,751 | 3,164 | 4,187 | 4,160 | 3,250 |
| Other provincial, territorial, and municipal infrastructure investments | 3,272 | 3,291 | 4,383 | 5,294 | 5,938 | 5,973 |
| Indigenous Community Infrastructure | 4,058 | 4,634 | 3,617 | 3,110 | 2,006 | 1,739 |
| Canada Foundation for Innovation | 567 | 552 | 623 | 674 | 487 | 487 |
| Strategic Innovation Fund | 1,703 | 2,708 | 2,941 | 2,527 | 2,109 | 1,429 |
| Other capital transfers available to the private sector | 2,109 | 2,885 | 2,384 | 1,363 | 1,376 | 1,351 |
| Since FES 2024 | 23 | 915 | 1,070 | 1,527 | 1,506 | 1,028 |
| Co-Development Funding for High-Speed Rail | 151 | 597 | 697 | 1,025 | 966 | 681 |
|
Less: Funds Previously Provisioned
in the Fiscal Framework
|
0 | -79 | -53 | -53 | -53 | -53 |
|
Less: Funds Sourced From Existing
Departmental Resources
|
-128 | 0 | 0 | 0 | 0 | 0 |
| Other | 0 | 397 | 426 | 556 | 594 | 401 |
| In Budget 2025 | 0 | 376 | 5,403 | 6,742 | 6,019 | 6,464 |
| Generational Infrastructure Investments (Sec. 1.2) | 0 | 0 | 4,750 | 5,050 | 5,450 | 4,850 |
|
Less: Funds Previously Provisioned
in the Fiscal Framework
|
0 | 0 | -2,530 | -2,788 | -2,853 | -2,903 |
| Protecting Workers and Transforming Canada's Strategic Industries - Equipping Companies for Growth and Diversification (Sec. 2.1) | 0 | 459 | 1,036 | 1,778 | 1,485 | 1,238 |
|
Less: Funds Previously Provisioned
in the Fiscal Framework
|
0 | -1,000 | -250 | -250 | -250 | -250 |
| A New Trade Infrastructure Strategy (Sec. 2.2) | 0 | 0 | 650 | 1,100 | 1,300 | 950 |
| Strengthening First Nations Infrastructure Financing and Access to Clean Water (Sec. 3.1) | 0 | 0 | 749 | 749 | 749 | 0 |
| Rebuilding, Rearming, and Reinvesting in the Canadian Armed Forces (Sec. 4.1) | 0 | 861 | 825 | 1,075 | 1,103 | 865 |
| Other | 0 | 56 | 172 | 27 | -966 | 1,714 |
| Capital-focused tax incentives | 1,271 | 6,328 | 9,250 | 9,270 | 10,901 | 10,649 |
| Baseline | 1,271 | 6,199 | 8,912 | 8,935 | 10,515 | 10,228 |
| Atlantic investment tax credit1,2 | 150 | 175 | 175 | 185 | 195 | 200 |
| Clean Economy investment tax credits | 22 | 1,585 | 3,836 | 5,444 | 7,231 | 6,584 |
| Film and video tax credits | 733 | 1,135 | 1,140 | 1,190 | 1,240 | 1,285 |
| Flow-through share deductions and related tax credits2,3 | 579 | 578 | 530 | 160 | 268 | 268 |
| Accelerated investment incentive and other accelerated capital cost allowance measures2,3 | -213 | 2,726 | 3,231 | 1,956 | 1,581 | 1,891 |
| Since FES 2024 | 0 | 80 | 55 | -25 | 0 | 0 |
| Extending the Mineral Exploration Tax Credit2 | 0 | 80 | 55 | -25 | 0 | 0 |
| In Budget 2025 | 0 | 49 | 283 | 360 | 386 | 421 |
| Productivity Super-Deduction (Sec. 1.2)2,3 | 0 | 45 | 280 | 360 | 385 | 420 |
| Other2,3 | 0 | 4 | 3 | 0 | 1 | 1 |
| Amortization of federal capital | 6,044 | 6,628 | 7,348 | 8,455 | 10,864 | 12,512 |
| Baseline | 6,086 | 6,642 | 7,295 | 8,228 | 10,290 | 11,377 |
| Capital amortization expenses | 6,086 | 6,642 | 7,295 | 8,228 | 10,290 | 11,377 |
| Since FES 2024 | -43 | -29 | -2 | -31 | 9 | 24 |
| Construction of River-class Destroyers | 0 | 0 | 0 | 0 | 8 | 9 |
|
Less: Funds Sourced From Existing
Departmental Resources
|
-45 | -48 | -22 | -40 | -14 | -25 |
| Future Fighter Capability Project | 2 | 10 | 30 | 43 | 92 | 197 |
|
Less: Funds Sourced From Existing
Departmental Resources
|
0 | 0 | -12 | -41 | -94 | -182 |
| Air Fleet Renewal and Modernisation | 0 | 0 | 0 | 3 | 10 | 16 |
|
Less: Funds Sourced From Existing
Departmental Resources and Other Revenue
|
0 | 0 | 0 | 0 | 0 | 0 |
| Other | 1 | 10 | 2 | 5 | 8 | 9 |
| In Budget 2025 | 0 | 15 | 55 | 258 | 564 | 1,111 |
| Seizing the Full Potential of Artificial Intelligence (Sec. 1.2) | 0 | 4 | 5 | 181 | 673 | 63 |
|
Less: Funds Previously Provisioned
in the Fiscal Framework
|
0 | -4 | -5 | -181 | -610 | 0 |
| Rebuilding, Rearming, and Reinvesting in the Canadian Armed Forces (Sec. 4.1) | 0 | 12 | 62 | 216 | 405 | 972 |
|
Less: Funds Previously Provisioned
in the Fiscal Framework
|
0 | 0 | -30 | -61 | -92 | -122 |
| Strengthening Canada's Presence: Operations REASSURANCE and AMARNA (Sec. 4.1) | 0 | 2 | 14 | 27 | 40 | 40 |
|
Less: Funds Sourced From Existing
Departmental Resources
|
0 | -2 | -2 | -2 | -2 | -2 |
| Strengthening Federal Law Enforcement (Sec. 4.2) | 0 | 0 | 6 | 15 | 26 | 33 |
| Modernising the Meteorological Service of Canada (Sec. 4.2) | 0 | 0 | 0 | 57 | 115 | 116 |
| Other | 0 | 1 | 4 | 5 | 9 | 12 |
| Private sector research and development | 4,896 | 5,478 | 5,772 | 5,901 | 6,057 | 6,222 |
| Baseline | 4,896 | 5,475 | 5,702 | 5,816 | 5,992 | 6,152 |
| Industrial Research Assistance Program | 436 | 525 | 507 | 476 | 447 | 397 |
| Scientific Research and Experimental Development tax incentives1,2 | 4,460 | 4,950 | 5,195 | 5,340 | 5,545 | 5,755 |
| In Budget 2025 | 0 | 3 | 70 | 85 | 65 | 70 |
| Enhancing the Scientific Research and Experimental Development Tax Incentives (Sec. 1.2)1 | 0 | 3 | 70 | 85 | 65 | 70 |
| Support to unlock large-scale private sector capital investment | 73 | 504 | 1,378 | 2,370 | 2,843 | 3,217 |
| Baseline | 73 | 504 | 1,378 | 2,370 | 2,843 | 3,217 |
| Support for battery manufacturing1 | 73 | 504 | 1,378 | 2,370 | 2,843 | 3,217 |
| Measures to grow the housing stock | 3,527 | 5,835 | 7,390 | 4,633 | 3,693 | 3,355 |
| Baseline | 3,527 | 5,062 | 5,633 | 3,001 | 2,344 | 2,411 |
| Affordable Housing Fund | 922 | 1,182 | 1,664 | 464 | -132 | 33 |
| Housing Accelerator Fund | 1,075 | 1,085 | 1,082 | 103 | 0 | 0 |
| Apartment Construction Loan Program | 179 | 417 | 573 | 515 | 523 | 29 |
| Indigenous Housing | 1,138 | 1,811 | 1,595 | 1,049 | 1,019 | 1,082 |
| Tax measures2,3 | 26 | 52 | 165 | 365 | 615 | 845 |
| Other programs | 186 | 515 | 553 | 504 | 319 | 421 |
| Since FES 2024 | 0 | -5 | -6 | -6 | -4 | -1 |
| Topping Up the Affordable Housing Fund | 0 | 0 | 0 | 0 | 3 | 6 |
|
Less: Funds Previously Provisioned
in the Fiscal Framework
|
0 | -5 | -6 | -6 | -7 | -7 |
| In Budget 2025 | 0 | 778 | 1,763 | 1,638 | 1,353 | 946 |
| Launching Build Canada Homes (Sec. 3.1) | 0 | 898 | 1,880 | 1,755 | 1,470 | 1,062 |
|
Less: Funds Previously Provisioned
in the Fiscal Framework
|
0 | -120 | -118 | -117 | -117 | -116 |
| Total - Baseline | 32,225 | 43,170 | 48,500 | 48,070 | 50,627 | 50,280 |
| Total - Since FES 2024 | -20 | 962 | 1,117 | 1,465 | 1,512 | 1,051 |
| Total - In Budget 2025 | 0 | 1,221 | 7,573 | 9,083 | 8,387 | 9,011 |
|
Less: Comprehensive
Expenditure Review
|
0 | 0 | -532 | -606 | -876 | -720 |
| Total capital investments | 32,205 | 45,352 | 56,658 | 58,012 | 59,650 | 59,622 |
| Total capital investments (cash basis) | 51,574 | 76,792 | 92,343 | 93,314 | 94,640 | 93,497 |
|
Notes: Numbers may not add due to rounding. Department of Finance estimates, based on information received from other government departments. 1 Fiscal cost includes transfer payments and an estimate of forgone corporate income tax revenue. 2 Fiscal cost includes an estimate of forgone personal income tax revenue. 3 Fiscal cost includes an estimate of forgone corporate income tax revenue. |
||||||
Historical Information
Table A2.3 includes a backward-looking application of the Capital Budgeting Framework to the past twenty years. This history traces the fiscal cost of the programs identified as baseline capital investments in Table A2.2 and their readily identifiable precursors. For example, while the Scientific Research and Experimental Development (SR&ED) program has supported private sector research and development for decades, other capital investment programs are newer, such as the Strategic Innovation Fund which incorporated several legacy programs and has now been replaced by the Strategic Response Fund. In these cases, Table A2.3 includes both current and predecessor programs.
| Capital transfers | Capital-focused tax incentives | Amortisation of federal capital | Private sector research and development | Measures to grow the housing stock | Total | |
|---|---|---|---|---|---|---|
| 2005- 2006 |
1,509 | 1,167 | 3,904 | 2,720 | 9,300 | |
| 2006- 2007 |
1,691 | 1,118 | 3,807 | 2,825 | 9,441 | |
| 2007- 2008 |
2,090 | 1,295 | 3,954 | 3,305 | 10,644 | |
| 2008- 2009 |
2,448 | 816 | 4,176 | 3,290 | 10,730 | |
| 2009- 2010 |
3,856 | 686 | 4,418 | 3,155 | 12,115 | |
| 2010- 2011 |
3,848 | 905 | 4,756 | 3,068 | 12,577 | |
| 2011- 2012 |
4,291 | 865 | 4,859 | 3,144 | 13,159 | |
| 2012- 2013 |
4,484 | 890 | 5,184 | 3,319 | 13,877 | |
| 2013- 2014 |
4,079 | 840 | 4,865 | 3,343 | 13,127 | |
| 2014- 2015 |
3,609 | 755 | 5,090 | 2,606 | 12,060 | |
| 2015- 2016 |
3,682 | 810 | 5,049 | 2,676 | 12,217 | |
| 2016- 2017 |
3,740 | 825 | 5,168 | 2,725 | 293 | 12,751 |
| 2017- 2018 |
4,424 | 1,315 | 5,261 | 2,846 | 358 | 14,204 |
| 2018- 2019 |
9,703 | 1,030 | 5,643 | 2,836 | 194 | 19,406 |
| 2019- 2020 |
8,433 | 5,490 | 5,790 | 3,271 | 574 | 23,559 |
| 2020- 2021 |
10,602 | 4,315 | 5,969 | 3,306 | 1,659 | 25,852 |
| 2021- 2022 |
10,691 | 3,905 | 5,514 | 3,846 | 2,323 | 26,280 |
| 2022- 2023 |
12,516 | 4,130 | 5,644 | 4,206 | 1,899 | 28,395 |
| 2023- 2024 |
13,207 | 3,575 | 5,633 | 4,256 | 4,008 | 30,679 |
| Note: Historical capital investments are actual expenses for ongoing capital investments and their readily identifiable precursors. For those tax expenditures that are not considered expenses for the purposes of the Public Accounts of Canada, historical capital investments are the Department of Finance's most recent estimate of their fiscal cost. | ||||||
Page details
- Date modified: