
Archived - Budget 2024
Statement and Impacts Report on Gender, Diversity, and Inclusion

Statement and Impacts Report on Gender, Diversity, and Inclusion(PDF, 3.4 MB)
On this page:
Statement on Gender Equality, Diversity, and Inclusion
A foundational strength of Canada is its diversity. Since the 2016 Fall Economic Statement our government has expressly included gender and diversity in the development of policy, taxation and resource allocation decisions.
The Canadian Gender Budgeting Act which came into effect in December 2018, enshrined gender budgeting in legislation. This approach mandated reporting on the gender and diversity impacts for all new budget measures in every budget cycle. Budget 2024 constitutes the fifth annual report.
Canada's gender budgeting approach has yielded significant positive results and continues to evolve––leveraging key strengths and identifying areas where improvements are most needed.
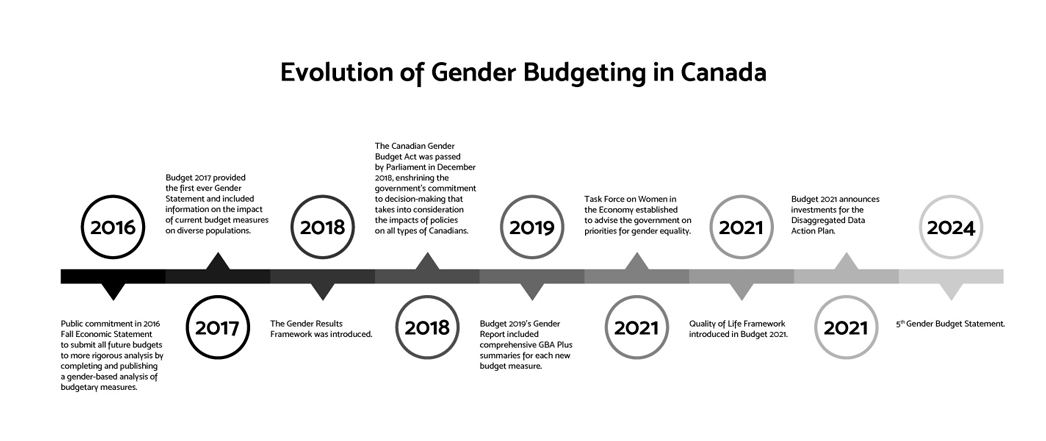
In practice, Canada's gender budgeting approach, particularly its efforts towards incorporating both gender and diversity, has garnered international recognition. Amongst Organisation for Economic Co-operation and Development (OECD) countries, Canada ranks first for gender budgeting best practices––with the 2022 OECD Survey on Gender Budgeting citing Canada's clear identification of gender equality objectives within the budget process and the systematic use of analytical tools, to inform gender-responsive policies.
Since 2015, the government has been working to close inequalities by building an economy that works for everyone. This is why the government has made and is making significant investments to strengthen Canada's social safety net for every generation—investments which enable more women to participate in the workforce, more children and seniors to get the dental care they need, more diverse Canadians to feel safe in their communities, and more support to addressing the violence Indigenous women and girls face. Key investments since 2015 to uplift Canadians include:
- Early Learning and Child Care, which is supporting better economic outcomes for women, by making it possible for more women to participate in the workforce, while securing access to quality child care and learning, thus contributing to positive childhood development and the future well-being of children.
- The interim Canada Dental Benefit has helped hundreds of thousands of children get the oral health care they need, and once fully implemented in 2025, the new Canadian Dental Care Plan will improve the long-term health of 9 million Canadians, who may have previously been unable to visit an oral health professional due to the cost.
- The National Action Plan to End Gender-Based Violence provides targeted action to protect Canadians who experience or are at risk of experiencing violence because of their sex, gender, gender identity, gender expression, or perceived gender.
- The Federal 2SLGBTQI+ Action Plan advances the rights and equality for Two-Spirit, lesbian, gay, bisexual, transgender, queer, intersex, and other sexually and gender diverse people in Canada.
- The Implementation of the National Action Plan to End the Tragedy of Missing and Murdered Indigenous Women and Girls is providing targeted, culturally-appropriate supports to Indigenous women, girls, and 2SLGBTQQIA people, while working to address the root causes of the violence they face.
In Budget 2024, the government is making investments to close the divide between generations. For younger Canadians, the government is taking new action to reduce tax advantages that benefit the wealthy, is investing to build more homes, faster, is strengthening Canada's social safety net, and is boosting productivity and innovation to grow an economy with better-paying opportunities.
These efforts will improve the lives of all younger Canadians, and their impacts will be greatest for lower-income and marginalized younger Canadians, who will benefit from new pathways to unlock a fair chance at building a good middle class life.
This starts with a focus on housing. Resolving Canada's housing crisis is critical for every generation and the most vulnerable Canadians. The government is building more community housing to make rent more affordable for lower-income Canadians, including through:
- The $618.2 million Federal Community Housing Initiative;
- The $15 billion Affordable Housing Fund, including a $1 billion top-up in Budget 2024;
- The $1.5 billion Co-Operative Housing Development Program; and,
- The $4.4 billion Housing Accelerator Fund, including a $400 million top-up in Budget 2024.
These investments provide Canadians and younger generations with opportunity –– finding an affordable home to buy or rent; having access to recreational spaces, amenities, and schools to raise families.
Having a place to call home creates a broad range of benefits. When survivors of domestic partner violence can find affordable housing, this creates a safe home base for their children to break cycles of violence and poverty. When Indigenous people can find affordable housing that meets their specific needs that means they can access cultural supports to help heal from the legacy of colonialism. When persons with disabilities are able to find low-barrier or barrier-free housing, this enables them to utilize the entirety of their homes.
To ensure that young people and future generations benefit from continued actions for sustained and equitable prosperity for all, this budget makes key investments to guarantee access to safe and affordable housing, help Canadians have a good quality of life while dealing with rising costs, and provide economic stability through good-paying jobs and opportunities for upskilling.
Building More Affordable Homes
The housing crisis impacts Canadians differently based on their background, and today it is disproportionately impacting younger Canadians, especially Millennials and Gen Z, who are renting at higher rates than older generations. For lower-income households in particular, affordability challenges erode disposable income and household savings capacity, which could otherwise be put towards educational and professional opportunities, upward mobility and general life satisfaction. One in five young adults not living with their parents live in unaffordable housing and spend 30 per cent or more of their pre-tax income on housing costs. To offset these costs, younger Canadians are often living with their parents or extended family, or roommates, to cover high housing and living costs.
To alleviate the rising housing costs, especially for young adults, Budget 2024 supports governmental and non-governmental stakeholders in initiatives to increase Canadians access affordable housing. These efforts will advance well-being and contribute to a prosperous Canada. For example, several studies have shown that housing affordability has a positive impact on the well-being of families with children and improves children's outcomes. For other groups such as women and newcomers, who are more likely to work minimum wage and part-time jobs, having a safe and affordable place to call home prevents them from returning to contexts of domestic violence.
Budget 2024 therefore adopts a nuanced approach to address the specific housing needs of the diverse Canadian population. Some measures (detailed in Chapter 1) include:
- Addressing Homelessness and Encampments, which would reach those most at risk of homelessness, which include Indigenous people, Black and racialized people, and veterans. As an example, Indigenous people represent five per cent of the total population, but account for 39.1 per cent of shelter users in Canada. Women on the other hand are more likely to experience "hidden homelessness," as they tend to exhaust all informal supports and resources before seeking formal services. Domestic violence is a leading cause of homelessness among women. Moreover, it is estimated that 45 per cent of all people experiencing homelessness are disabled or diagnosed with a mental illness.
- Sheltering Asylum Claimants, which would provide safe and secure housing for the rising number of asylum seekers coming to Canada. Asylum claimants are a diverse population, which can include 2SLGBTQI+ people, and Black and racialized people fleeing contexts of persecution, oppression, and conflict.
- Protecting and Expanding Affordable Housing would support households in core housing need and help them maintain a good standard of living. In 2021, according to Statistics Canada, 7.7 per cent of the Canadian population experienced core housing need, with women and girls having a slightly higher incidence (8.2 per cent) compared to men and boys (7.1 per cent).
- Measures to Save for a First Down Payment, Faster, would help young Canadians save for their first home, especially as the Canadian homeownership rate has been on the decline after peaking in 2011 (69.0 per cent).
- Building Apartments, Bringing Rents Down, would benefit low- and middle-income renters, and particular subgroups that are more likely to be renters. Renters who more recently entered the housing market, who typically pay higher rents, are more likely to be Black, Arab, or Latin American (9.7 to 11.9 per cent), recent immigrants (16.7 per cent), and aged 18 to 34 (38.6 per cent). Single-parent family households are also more likely to be renters in core housing need (29.4 per cent), compared to the total population of renters (17.2 per cent).
Making Life More Affordable
For many Canadians the cost of living remains elevated. In addition to the costs associated with a place to call home, families still need to cover a range of basic needs, such as food, transportation, medical bills, and necessities for their children's well-being.
Recognizing how multiple costs can accumulate and squeeze household budgets, the government has in recent months taken actions such as the Grocery Rebate, to provide targeted inflation relief for 11 million low- and modest-income Canadians and families. Other measures also include Cracking Down on Predatory Lending, to ensure that the most vulnerable in our society --which often include low-income people, seniors, and newcomers --are not financially exploited. Increasing Canada Student Grants and Raising the interest-free Canada Student Loan limits have helped younger people to pursue their dreams regardless of their background or ability to pay.
There is recognition that transformative supports are still needed to help Canadians deal with affordability challenges.
- Launching a National Pharmacare Plan will be transformative for those who rely on contraceptives and diabetes medications. Once agreements are reached with willing provinces and territories, up to 9 million Canadians of reproductive age will have better access to contraception and reproductive autonomy, improving their ability to plan for their future. Additionally, one in four Canadians with diabetes reported not following their treatment plan due to cost. Providing first-dollar coverage for diabetes medications will help improve the health of 3.7 million Canadians with diabetes and reduce the risk of serious life-changing health complications such as blindness or amputations.
- A National School Food Program would improve dietary quality and reduce health inequities. Currently one in four children in Canada, experience food insecurity. While this program would primarily support children, there is also a gendered impact for parents, as women typically invest more time and money preparing food for school. It is estimated that a program covering breakfast and lunch would save participating families up to $800 per year, with lower-income families seeing proportionally greater benefits.
- The Local Food Infrastructure Fund would benefit equity-deserving populations, particularly Indigenous people, Black communities, and women led one-parent households, by supporting community-based organizations to invest in local food infrastructure to enhance access to nutritious and culturally appropriate food. Nearly 43 per cent of women lone-parent households and one in four children under 18 are food insecure. Over 39 per cent of Black households and 33 per cent of off-reserve Indigenous population report food insecurity.
- The Canadian Shellfish Sanitation Program would provide Indigenous communities with access to safe shellfish harvesting for food, social, and ceremonial purposes. Inuit youth and adults experience the greatest food insecurity among all Canadians (about 57 per cent of Inuit youth and 45 per cent of Inuit adults).
- Launching the Canada Disability Benefit would improve the quality of life for working-age persons with disabilities, who are more likely to face multiple and compounding barriers. About 60 per cent of persons with disabilities between the ages of 25 and 64 are employed, compared with about 80 per cent for those age 25 to 64 without a disability. Canadians aged 18-64 with disabilities experience poverty at about twice the rate of Canadians aged 18-64 without disabilities (23 per cent vs. 12 per cent).
- Establishing a Child Care Expansion Loan Program would increase the availability of not-for-profit and public child care spaces across Canada. The program will offer $1 billion in low-cost loans and $60 million in non-repayable contributions to not-for-profit child care providers for the construction and renovation of child care centres. This initiative is not just about ensuring the spaces needed, it is also about ensuring that these spaces support the diverse needs of Canadian families, including those of vulnerable and underrepresented communities.
- Cracking Down on Junk Fees, would help strengthen consumer protections for Canadians and better ensure fair and transparent pricing within the marketplace. This will help ensure that all Canadians, particularly those who are disproportionately impacted like low-income Canadians, are not adversely impacted by unfair fees.
- Cheaper Internet, Home Phone and Cell Phone Plans, through the removal of extra switching fees, are expected to benefit all Canadians and in particular low-income Canadians. Certain populations are more likely experience lower incomes, such as Indigenous people (12.3 per cent) compared to the non-Indigenous population (7.2 per cent), newcomers (8.1 per cent) compared to those born in Canada (6.7 per cent), and persons with disabilities (10.6 per cent) compared to persons without disabilities (5.7 per cent).
Good Jobs and Meaningful Opportunities for Everyone
Economic opportunities for young people ensure that Canadians and Canada reach their full potential. Access to economic opportunities allows Canadians – no matter their background –to build a life that works for them. This looks like the ability to own a home or afford rent, have a family, invest in meaningful experiences, save for their futures, or support their parents. In the long-term, this creates flourishing communities.
Canada must support young people to get the skills they need to reach their and Canada's full potential. This is especially true for those seeking careers as skilled trade workers, who are pivotal to the essential sectors such as infrastructure, manufacturing, and increasingly the low-carbon economy. Despite the increasing need for skilled tradespeople, the overall certification rate has declined over time, with the number of certificates awarded to new apprentices growing at a slower pace than the number of new registrations in apprenticeship programs.
To unlock pathways for more Canadians, especially younger people, to engage in well-paying and diversified employment and educational opportunities, Budget 2024 proposes strategic investments, which include:
- More Jobs for young Canadians through the Jobs and Skills Training for Gen Z, which would deliver a range of activities that help youth (aged 15 to 30) overcome barriers to employment. Youth who face barriers often include youth who are Indigenous; Black and racialized, 2SLGBTQI+, persons with disabilities, early leavers from high school, low income, those in precarious housing, and living in rural, remote, Northern or fly-in communities.
- More Skilled Trades Workers Building Homes, reinforces the government's commitment to particularly support younger people gain valuable work experiences and secure good-paying jobs. The average completion rate for men in the top 15 largest apprenticeship programs in Canada was 47 per cent in 2021, but much lower for women, at 34 per cent. In Budget 2024, the government proposes to provide funding for the Canadian Apprenticeship Strategy to the Skilled Trades Awareness and Readiness (STAR) program to encourage high school students to enter the skilled trades and includes a focus on those who face barriers such as equity-deserving groups, and funding for the Apprenticeship Service to help create placements with SMEs for apprentices. The Apprenticeship Service offers additional financial support to SMEs that hire women and apprentices from other equity deserving groups.
- Empowering Young Entrepreneurs, would target young entrepreneurs and aspiring business owners aged 18-39, including from various equity-deserving groups, such as entrepreneurs from official language minority communities and rural and remote communities, as well as women, Black, Indigenous, and newcomer entrepreneurs.
- More Rent Supports for Students would benefit students, especially those with dependents. As of 2022-23, housing costs (whether in student residence or an apartment off-campus) accounted for the biggest draw on Registered Education Savings Plans. Canadians aged 15-24 not living with a parent spend, on average, 23 percent of their income on housing, compared to 16 percent across all age groups.
- Helping People Return to School is targeted at adult learners, so that they get the support they need to succeed in the workforce and manage the financial and time pressures of pursuing higher education, while still raising families. Women are disproportionately represented (60 per cent) amongst those who have historically taken up these supports.
- Investing in Homegrown Research Talent, is targeted at postsecondary student researchers, so they can learn, grow, and enter a fulfilling career. These researchers are typically younger adults. Of award recipients of the Social Sciences and Humanities Research Council, the Canadian Institutes of Health Research, and the Natural Sciences and Engineering Research Council, those who identify as women comprise 63 per cent, 43 per cent, and 24 per cent respectively.
- Strengthening Canada's AI Advantage, which is targeting all Canadians by supporting an AI regulatory and global leadership regime as well as new AI initiatives meant to ensure Canada can continue to be a world leader in AI research, talent and commercialization.
The Gender Results Framework
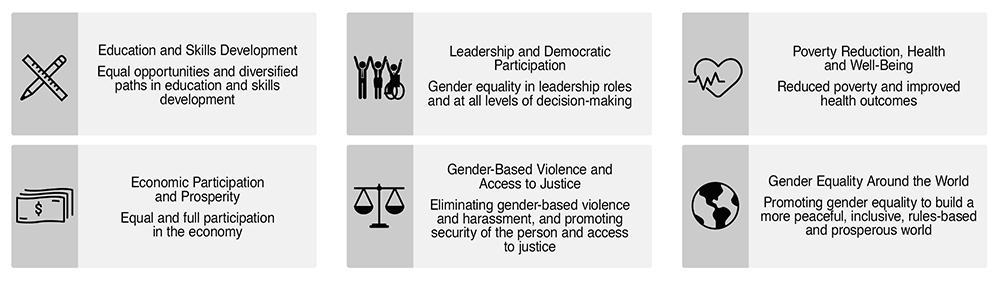
In 2018 the Government introduced the Gender Results Framework, to complement the Canadian Gender Budgeting Act. The Gender Results Framework represents the Government of Canada's vision for gender equality. Under this framework, the federal government has identified six key areas (see Figure 1) where change is required to advance gender equality. The framework is designed as a whole-of government tool to track how Canada is doing to achieve gender equality objectives. It is also aligned with the Government of Canada's policy of Gender-based Analysis Plus, ensuring that gender is considered in addition and in relation to other intersecting identity factors including age, disability, education, ethnicity, race, geography, sex, religion, economic status, and language.
Gender Equality Goals for Canada
Note on Methodology
As with previous budgets, this Statement uses indicator dashboards for the six pillars of the Gender Results Framework, to track progress towards equality across gender and intersecting identity factors. Building on the Budget 2021 investments in disaggregated data, the Statement puts an emphasis on an intersectional approach to reporting data. It recognizes that that no person is defined by a single identity and that overlapping identity factors contribute to varying outcomes across groups.
The terminology used in this Statement is partially dictated by the data collection process, which, until recently, continued to reflect binary norms around gender and did not consider differences between sex at birth and gender identity. Where the data is available, these differences will be reflected in the indicator dashboards.
However, it is not always possible to report on the indicators for each group individually, due to concerns around small population sizes and protecting privacy. This is the case for some statistics disaggregated by sexual orientation (lesbian, gay, or bisexual) or by non-binary gender identity.
In terms of time periods reflected in the dashboards, this varies, as not all Statistics Canada surveys are conducted across a consistent time series. Where possible, efforts have been made to reflect the most recently available data. It should also be noted that due to the potential differences in methodology and context across some surveys, small differences across groups should be viewed with caution.

Gender Results Framework
Pillar: Education and Skills Development
Goal: Equal opportunities and diversified paths in education and skills
development
Equal access to quality education and skills training is the cornerstone of a just and thriving society.
Educational attainment
Field of study
Tradespeople
| Men+ | Women+ | |
|---|---|---|
| Total | 13 | 6 |
| Indigenous | 16 | 6 |
| Racialized group | 5 | 4 |
| Has a disability | 13 | 7 |
| Recent immigrant | 5 | 3 |
| Share granted to women (%) | |
|---|---|
| Total all trades | 11 |
| Early childhood educators and assistants |
98 |
| Hairstylists and estheticians | 91 |
| Community and social service workers | 90 |
| Plumbers, pipefitters and steamfitters | 2 |
| Heavy duty equipment mechanics | 2 |
| Refrigeration and air conditioning mechanics | 2 |
Distribution among women (%)
High school mathematics, reading and science
Share aged 15 at proficiency level 2 or above (minimum level of proficiency students should acquire by end of secondary education, % 2006-2022)
Note: * As the non-binary population is small, data aggregation to a two-category gender protects confidentiality. People in the category "non-binary persons" are distributed into the other two-gender categories and denoted by the "+" symbol. Recent immigrants are persons who landed in Canada within the last 10 years.
Sources: Census of Population, Canadian Survey on Disability, Registered Apprenticeship Information System, Postsecondary Student Information System, Programme for International Student Assessment.
Although women may be underrepresented in certain educational fields, substantial progress has been made in overall educational attainment for women, Indigenous people, recent immigrants, racialized people and persons with a disability.
- With each successive generation of Canadians, both men and women have attained a higher level of education, with women more likely than men to attain a bachelor's degree or above.
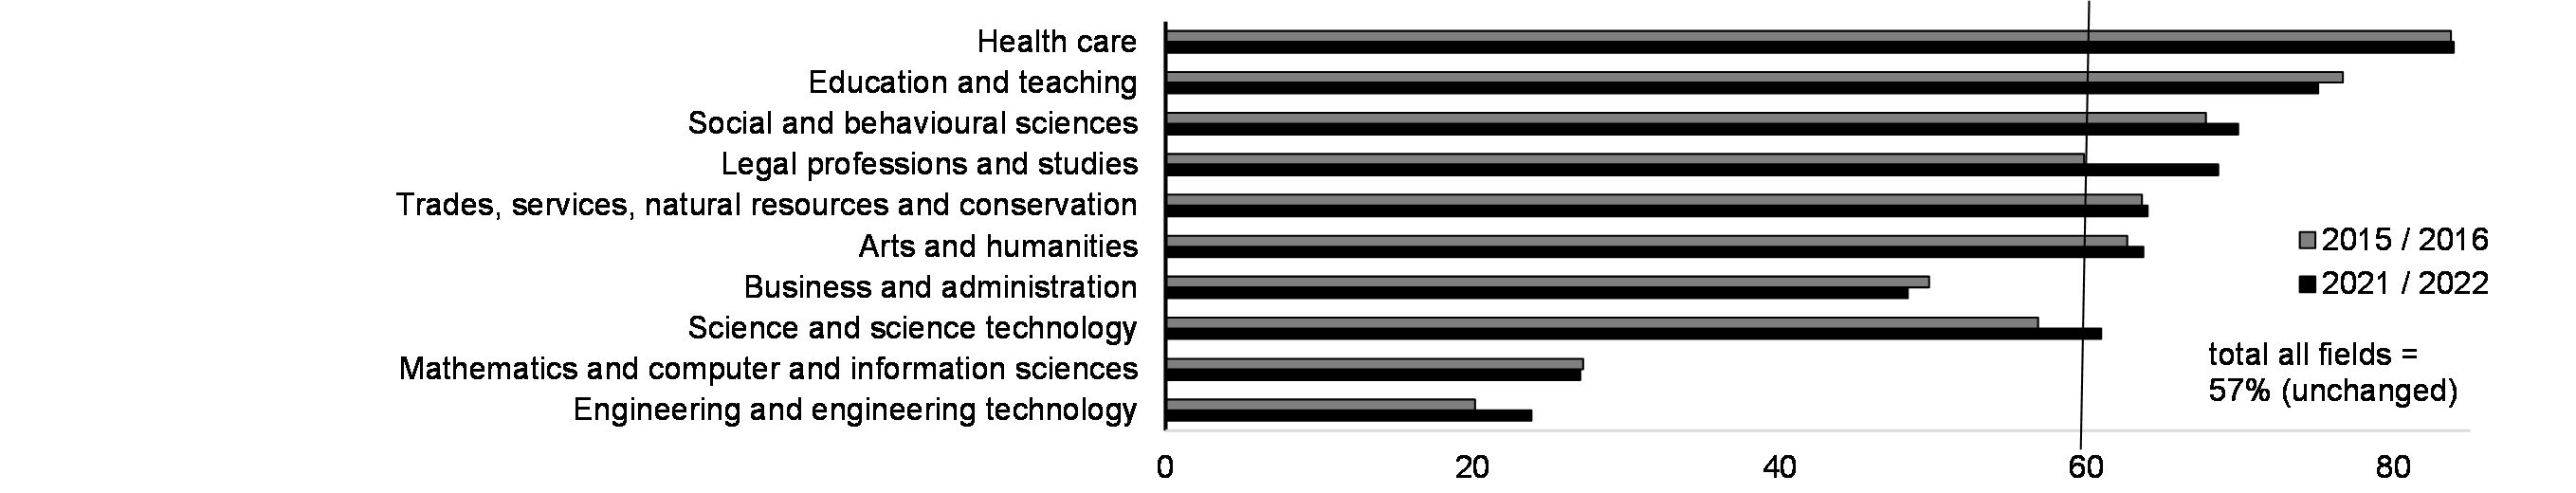
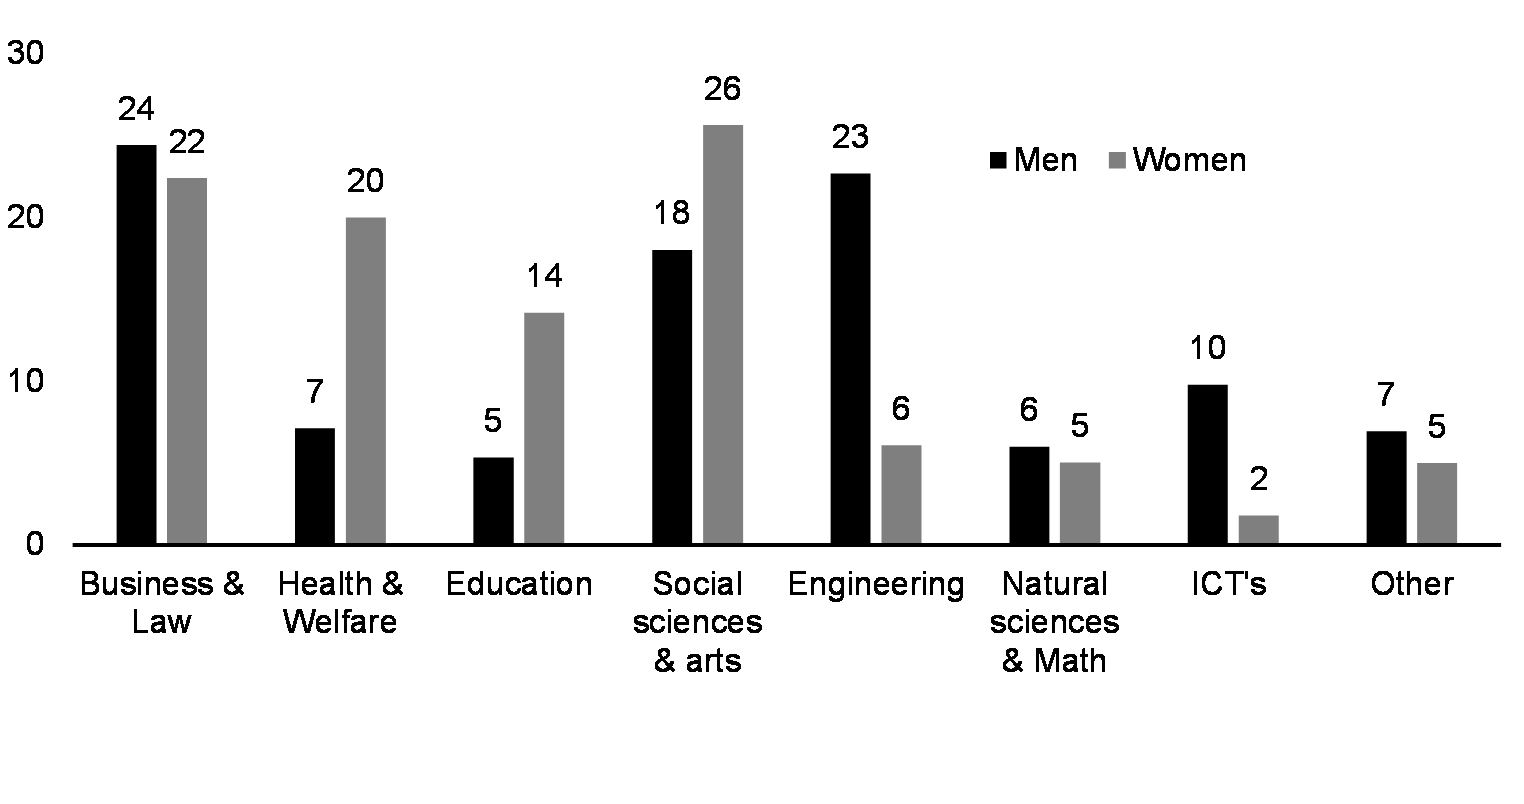
- While women remain less likely than men to enroll in the fields of science, technology, engineering, and mathematics (STEM), enrolment in these fields accounted for almost two-thirds of the increase in women's enrolment in bachelor degree programs between 2015-16 and 2021-22.
- A higher proportion of Black and racialized people and recent immigrants attain a bachelor's degree or above, but with women outperforming men to a lesser extent than observed in the total population within these groups. However, persons with a disability and Indigenous people are less likely to attain a bachelor's degree, with men less likely to attain a degree compared to women.
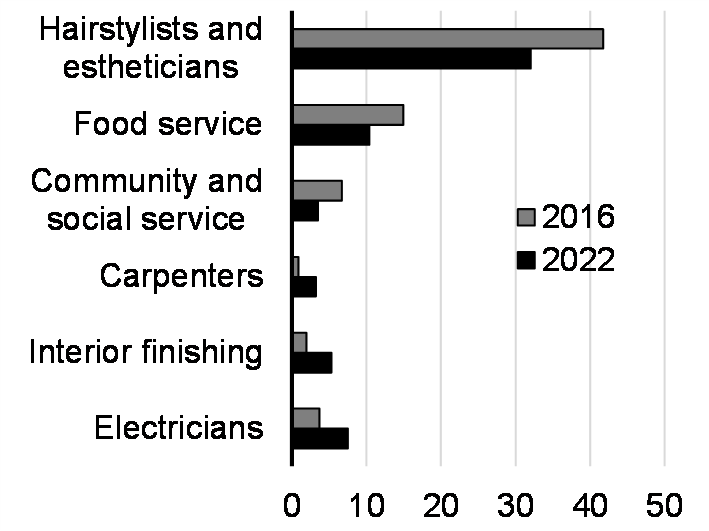
- Women continue to be underrepresented among new apprenticeship certificate holders, and the gap has slightly worsened in recent years with women's share decreasing from 13 per cent to 11 per cent since 2016. Nevertheless, there has been a shift in the composition of certificates granted to women away from trades historically dominated by women and towards those dominated by men, including some well-paying construction trades, such as carpenters, interior finishers, and electricians.
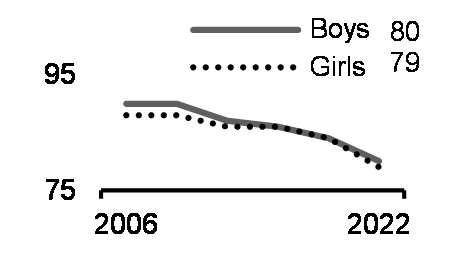
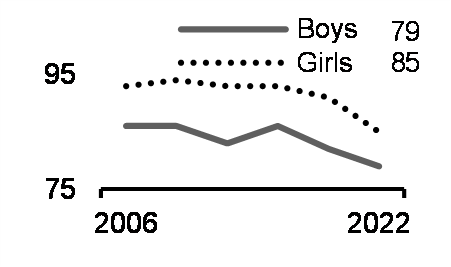
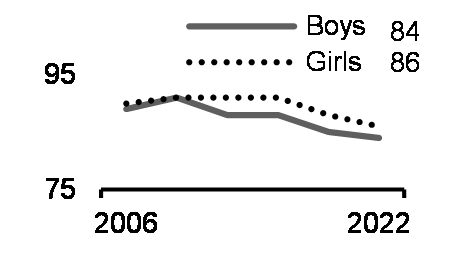
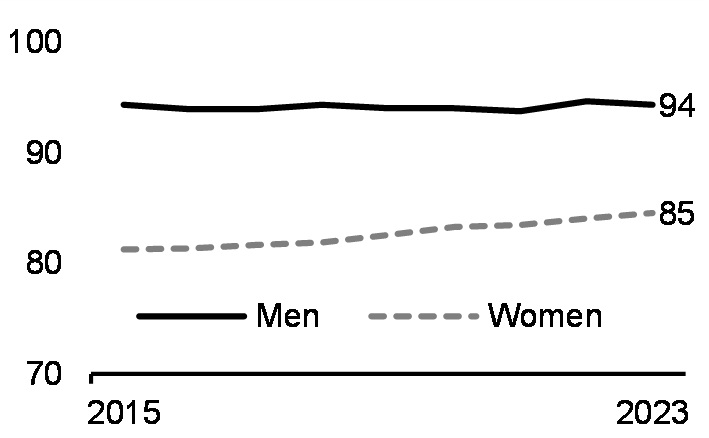
- With respect to basic education, the vast majority of students in Canada continue to graduate from high school, with 87 per cent of boys and 92 per cent of girls completing high school within five years of starting grade 10. International test scores in mathematics, reading, and science show that Canadian 15-year-old boys and girls continue to compare favourably with their counterparts from other countries, although there has been a general decline in proficiency, consistent with a global trend. Overall, performance among girls and boys is comparable; however, boys continue to perform worse in reading.
Budget 2024 includes substantial investments in education including student financial assistance and training programs for young people, including women, Black and racialized people, and Indigenous people. Ensuring equal access to education and training opportunities fosters individual empowerment, economic prosperity, and global competitiveness. By breaking down discriminatory barriers and empowering individuals to shape their own paths to success, advancing equality of opportunities benefits not only individuals in historically disadvantaged groups, but all Canadians.
Actions to Support Education and Skills Development
Previous Budget Actions
- As of March 31, 2023, CanCode 3.0 has supported 2,756,271 training opportunities to K-12 students. As well, the program has surpassed targets for providing training and professional development opportunities to teachers (target 120,000, reached 134,615), and for reaching specific groups such as Indigenous youth (target 7 per cent, reached 7 per cent); youth with disabilities (target 1 per cent, reached 4 per cent); and youth located in rural, remote, and Northern communities (target 17 per cent, reached 23 per cent).
- Funding for the Youth Employment and Skills Strategy in Budget 2021 supported 141,262 youth job placements and skills training opportunities in 2022-23, while support for the Student Work Placement Program supported 83,073 work-integrated learning opportunities for post-secondary students in their field of study in 2021-22.
- Through its various program streams, Mitacs supported a total of 21,431 work-integrated learning placements in 2022–23, hosting 9,800 students in both the for-profit and not-for-profit sectors.
Budget 2024 Actions*
- Additional funding for Coding Skills for Kids will support coding and digital skills training opportunities for kids in grades K-12.
- Investing in Homegrown Research Talent ensures the best possible educational opportunities in science for post-secondary students and fellows and will help further develop the skills-based workforce.
- Additional funding for First Nations K-12 Education and First Nations Post-Secondary Education will support First Nations elementary and secondary students on-reserve, and First Nations post-secondary students seeking to obtain a credential.
- Continued funding for the Jobs and Skills Training will support employment and skills development opportunities for young people, particularly those facing barriers to employment.
- Expanding the Helping Students Gain Work Experience will provide quality work-integrated learning opportunities, such as co-ops, to post-secondary students.
- Increases to Canada Student Grants and Loans will stabilize access to post-secondary education for low- and middle-income families.
- Making it Easier to Save for Your Child's Education will facilitate access to education savings to help children from low-income families pursue post-secondary education.

Gender Results Framework
Pillar: Economic Participation and Prosperity
Goal: Equal and full participation in the economy
An economy that advances equal and meaningful opportunities for participation creates strong economic growth for all Canadians.
Labour force
Earnings and employment
Type and hours of work
| Share of women in selected occupations (%, 2023) | |
|---|---|
| Nursing and health professionals | 90 |
| Legal, social, community and education services | 89 |
| Health services support | 84 |
| Trades helpers, construction labourers | 13 |
| General trades | 9 |
| Technical trades, transportation officers/controllers | 5 |
Consumer Price Index for child care services (Index, 2019=100, 2005-2023)
Note: * As the non-binary population is small, data aggregation to a two-category gender protects confidentiality. People in the category "non-binary persons" are distributed into the other two-gender categories and denoted by the "+" symbol. Labour force participation rates for "Has a disability" are 2017 and 2022. For racialized groups, 2016 value is from Census and 2023 value is from Labour Force Survey. Recent immigrants are persons who landed in Canada within the last 10 years.** Low-wage work is defined as two-thirds of the median hourly wage of full-time permanent employees aged 25-54 years.
Sources: Labour Force Survey, Census of Population, Canadian Survey on Disability, Canadian Income Survey, Canadian Social Survey, Consumer Price Index (child care services).
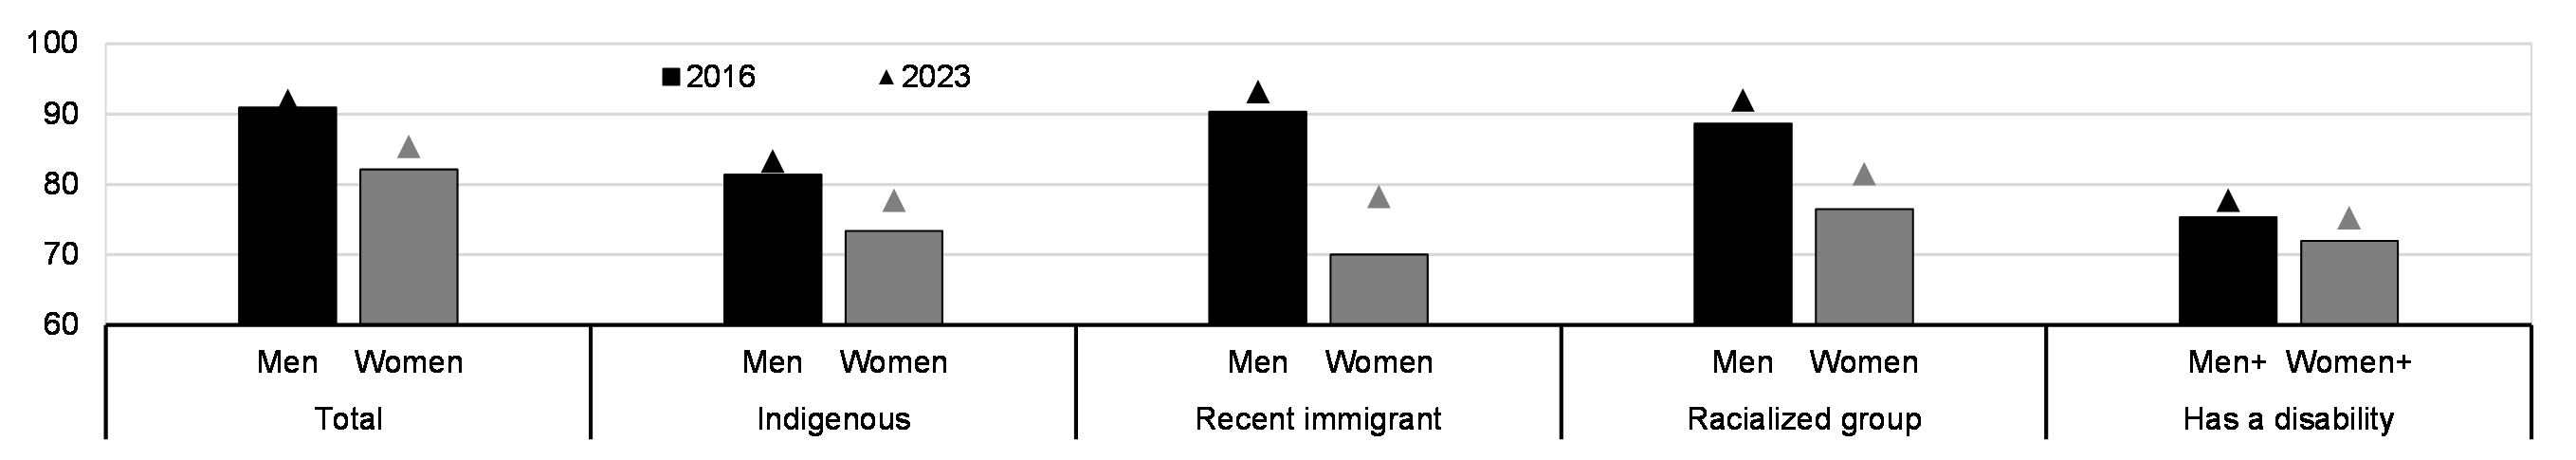
Strong labour market conditions (including more flexibility in work arrangements and hybrid work) and reduced child care costs have fostered greater participation. Canadian women are participating in the labour market at a higher rate than at any time in history, as gender-based inequalities in economic outcomes continue to decline. Despite this progress, work remains to secure full and equal participation for women and other underrepresented groups.
- There have been substantial increases in labour market participation among Indigenous women and recent immigrant women in recent years. In fact, improvements in labour market performance of immigrants of both genders have exceeded that of the total population. Nonetheless, women, particularly those who are Indigenous, recent immigrants, racialized, or have a disability, continue to participate in the labour market at lower rates than men.
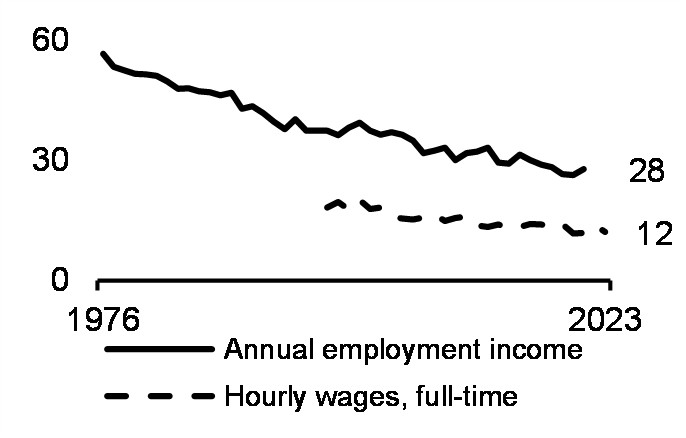
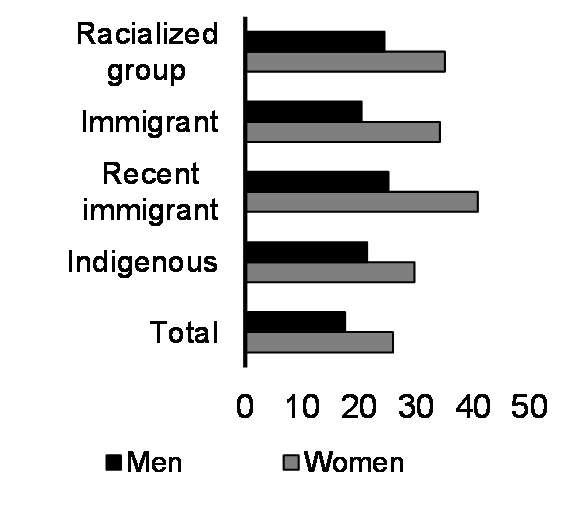
- Gender gaps in earnings have narrowed over the past few decades, with the gap in annual earnings reduced to 28 per cent (12 per cent for full-time hourly wages). However, women still constitute a disproportionate share of low-wage workers. Persons who are Indigenous, racialized or an immigrant, especially women who are recent immigrants, are also more likely to work in low-wage jobs.
- Labour market attachment for women has continued to see significant improvement. The share of women involuntarily working part-time because full-time employment could not be secured has continued to decline, although there remains a 9-percentage point gap in full-time employment rates between women and men.
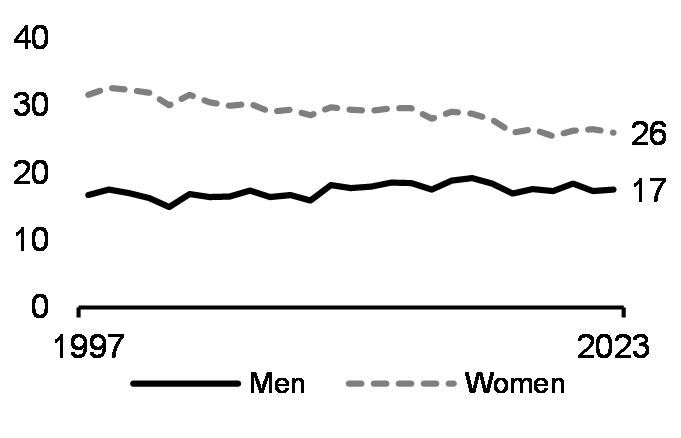
- Women continue to shoulder a greater share of unpaid household responsibilities, dedicating 70 per cent more hours per week than men to child care duties or duties related to the care of seniors. This division of household responsibilities may contribute to women participating less in the labour force on a full-time basis.
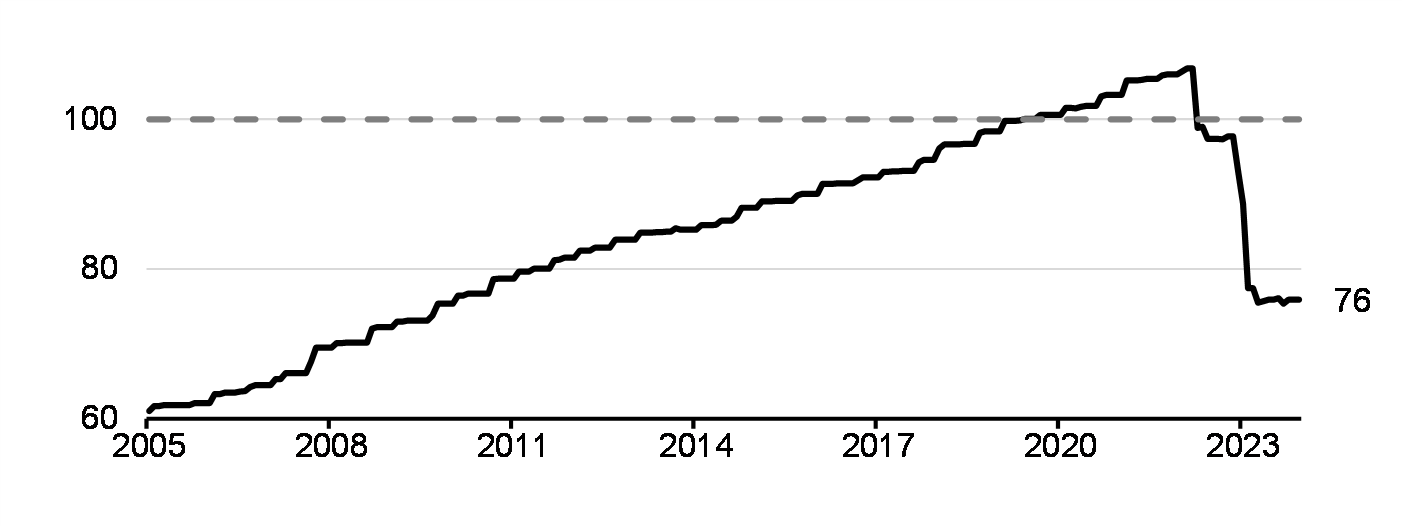
- Child care is becoming more affordable, with the average cost now 76 per cent of the 2019 level. This trend is expected to continue as provinces work towards fulfilling commitments to achieve $10-per-day child care by the end of 2025-26. Reflecting, in part, recent government investments in early learning and child care, since the summer of 2020, the participation rate for women with children under the age of six has increased by three percentage points – a pace more than double that of the prior three years.
In this context, the government continues to make concerted efforts to ensure that every Canadian family has access to affordable, high-quality child care so that women can fully participate in the economy and to support economic activity in Indigenous communities.
Ensuring that every person has the opportunity and support to fully participate in the economy will not only raise the incomes of Canadian families but also contribute to the overall prosperity of the country. This means enabling opportunities for women in particular to pursue their careers at the same time as raising their families and supporting enterprising young Canadians from marginalized backgrounds to realize their dreams.
Actions to Support Economic Participation and Prosperity
Previous Budget Actions
- As of April 1, 2024, eight provinces and territories will be providing regulated child care for an average of just $10-a-day or less, and all other provinces remain on track to deliver $10-a-day child care by March 2026.
- In the 2023 Fall Economic Statement, the government proposed An Act to amend the Criminal Code and the Canada Labour Code, to create a new paid leave for workers in federally regulated sectors who experience a pregnancy loss.
- From fiscal years 2018-19 to 2022-23, the Regional Economic Growth through Innovation program supported a total of 1,016 projects undertaken by organizations that are led, owned, or majority-owned by a representative of an underrepresented group.
- In February 2023, Palette Skills was announced as the national lead recipient for the Upskilling for Industry Initiative following an open call for applications. The organization has since launched its "Upskill Canada" Project with partners located across the country. In November 2023, Palette Skills launched its first wave of 17 industry-driven programs totaling $71 million to upskill more than 5,500 mid-career workers.
Budget 2024 Actions*
- Boosting Indigenous Economic Opportunity will enable Indigenous entrepreneurs and businesses to access the capital they need to start and expand their businesses. As well, the Indigenous Tourism Association of Canada and the Strategic Partnerships Initiative's Clean Energy programs will promote the Indigenous tourism industry and help ensure that Indigenous communities are able advance green energy projects.
- The Indigenous Loan Guarantee Program will support Indigenous communities of any distinction (First Nation, Inuit, Métis) looking to acquire equity in major natural resources and energy projects in their territories, thereby sustaining sources of revenue and creating jobs in Indigenous communities.
- More Affordable Child Care will increase the number of child care spaces across Canada, by offering low-cost loans and non-repayable contributions to not-for-profit and public child care providers for the construction and renovation of child care centres.
- Empowering Young Entrepreneurs will help young entrepreneurs and aspiring business owners aged 18-39, including those from various equity-deserving groups, launch and grow their business.

Gender Results Framework
Pillar: Leadership and Democratic Participation
Goal: Gender equality in leadership roles and at all levels of
decision-making
Ensuring representation and inclusivity is not just a matter of equity; it is a cornerstone for fostering innovation, cooperation, and improved outcomes for all Canadians.
Economic leadership
Political leadership
Judicial representation
Law enforcement
Note: * As the non-binary population is small, data aggregation to a two-category gender protects confidentiality. People in the category "non-binary persons" are distributed into the other two-gender categories and denoted by the "+" symbol. ** As of October 1, 2021, and October 1, 2023. *** Data is not available for 2020.
Sources: Census of Population, Library of Parliament, Police Administration Survey, Office of the Commissioner for Federal Judicial Affairs Canada, Policy Options, Department of Finance Canada internal analysis.
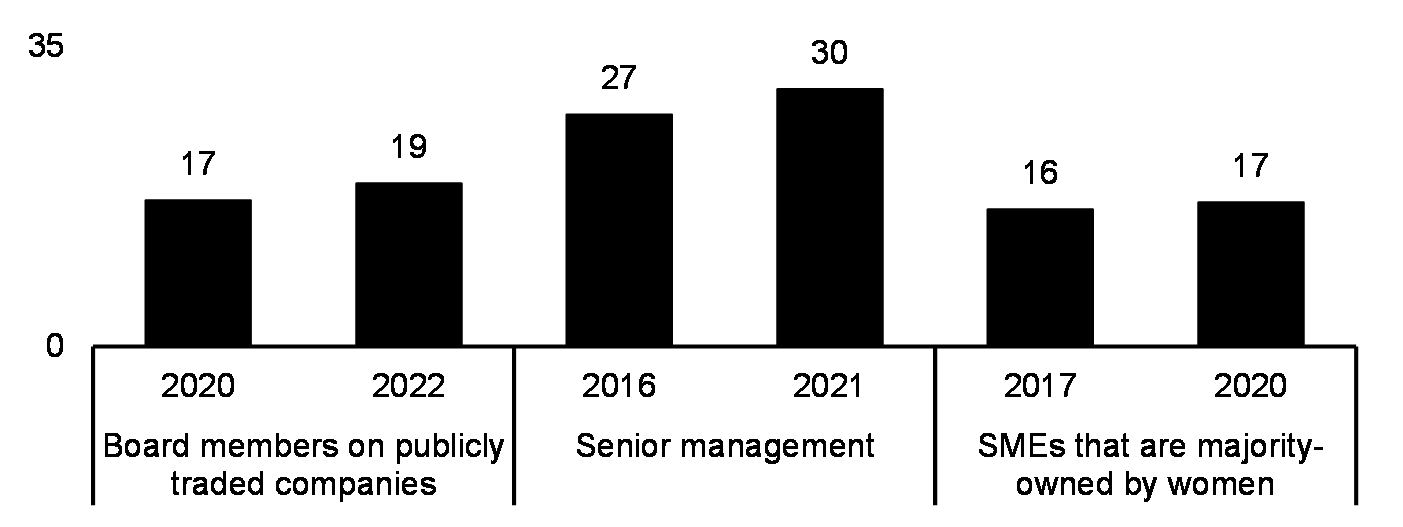
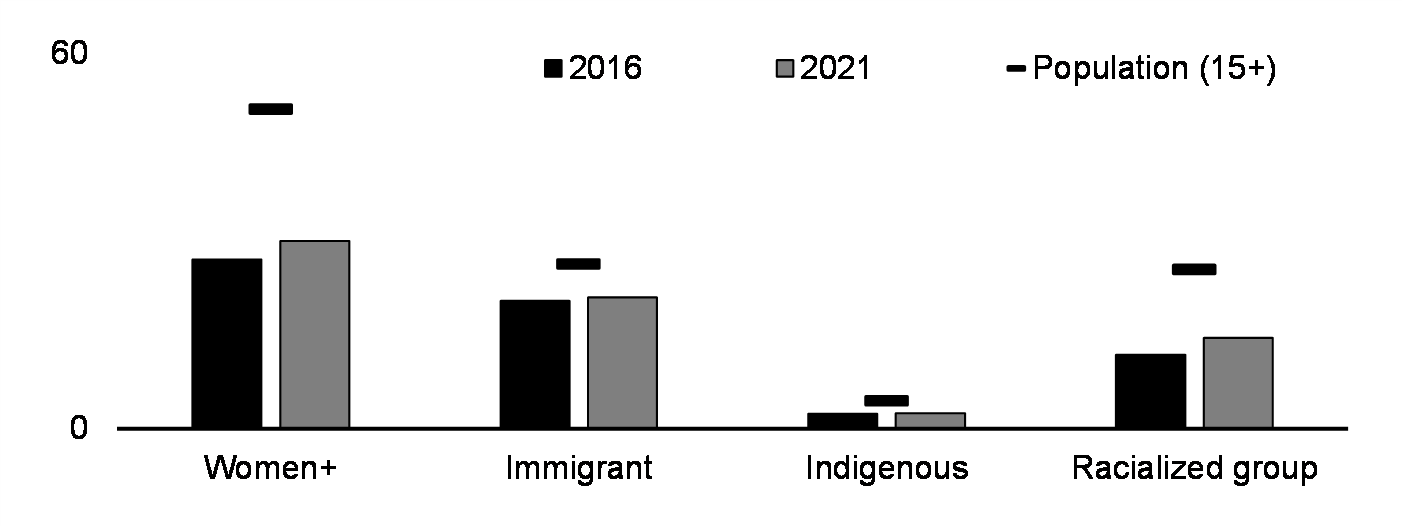
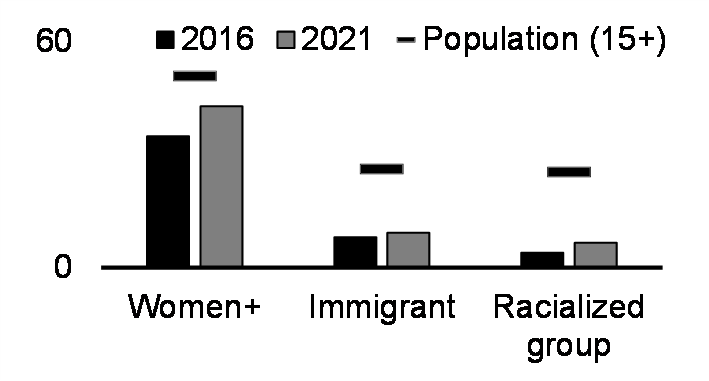
Over time, women have made notable progress in securing leadership positions across various sectors such as the justice system, law enforcement, government, and senior management. Despite these advances, there is still work to be done to create a system that truly reflects our societal makeup, ensuring that women and equity-deserving groups have a seat at the table at all levels of decision-making.
- The power gap continues to exist in business sector leadership. While there has been an increase in the representation of women on boards at publicly traded companies, in senior management positions, and in entrepreneurship, these shares all remain below one-third.
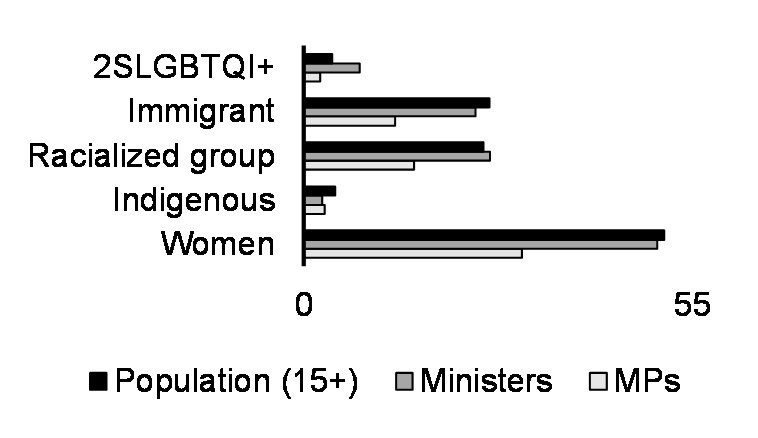
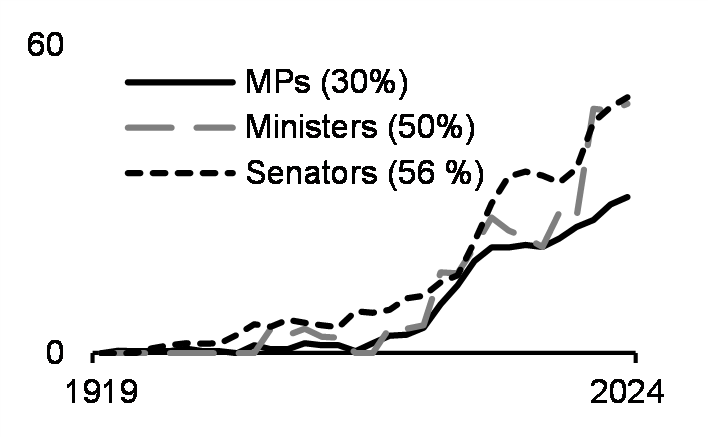
- Appointed Members of the Cabinet and Senators have achieved and maintained gender parity. Despite women's representation in the House of Commons rising to 30 per cent in 2024, the persistent gap highlights potential systemic barriers that may deter women from engaging in federal politics. At 43 per cent as of 2021, this gap is much smaller for all legislators in Canada. Likewise, immigrants and Black and racialized people continue to be underrepresented in politics, signaling a broader need for inclusivity and diversity in our political institutions.
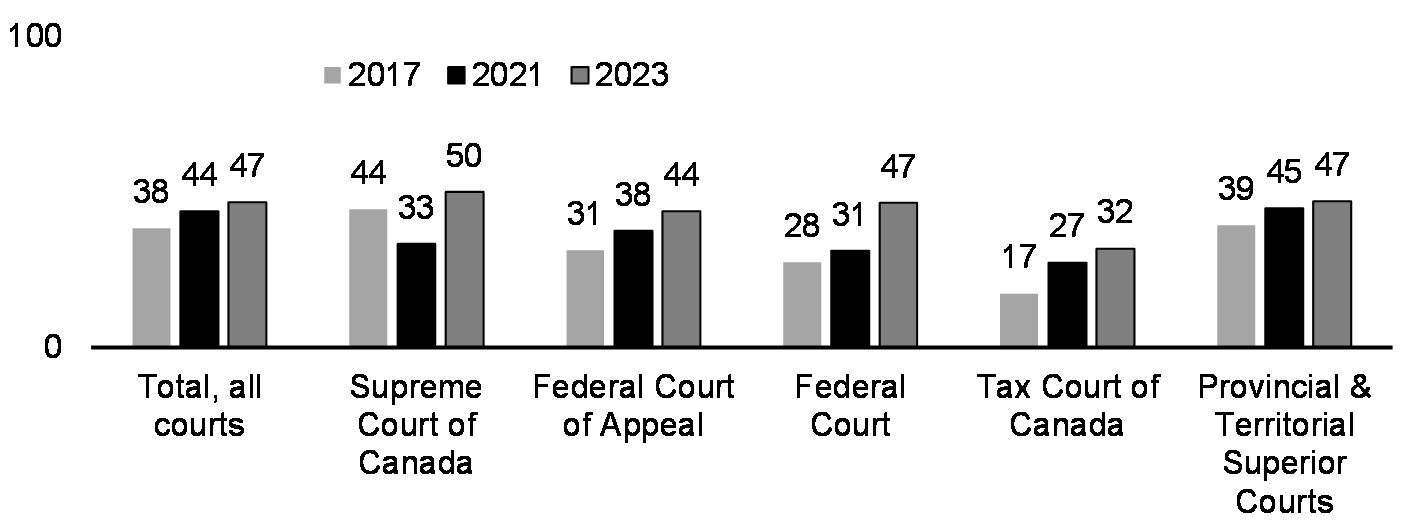
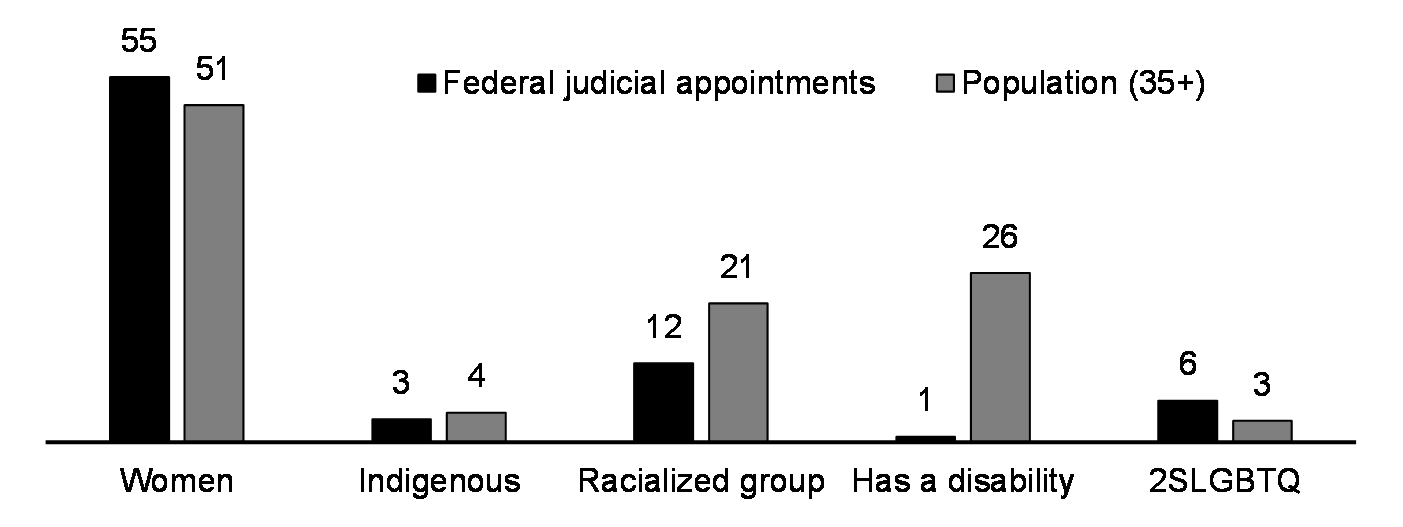
- Following its most recent appointments in 2022 and 2023, Canada reached a significant milestone with its first majority-women Supreme Court, consisting of five judges who are women and four who are men. Across all federal courts, the representation of women judges stood at 47 per cent in 2024.
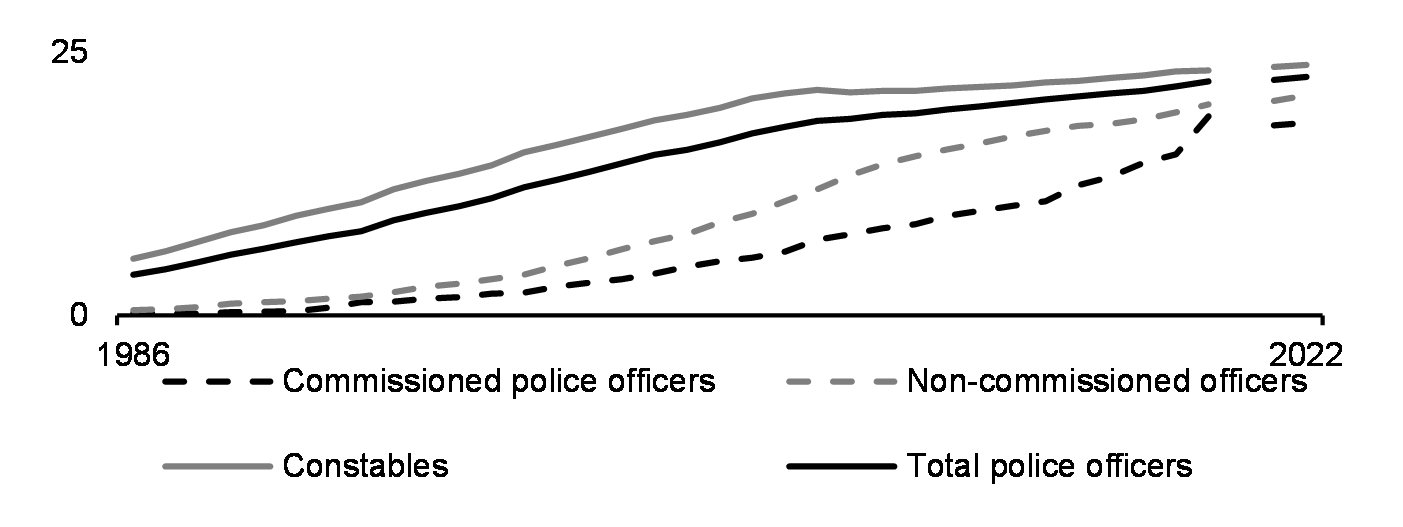
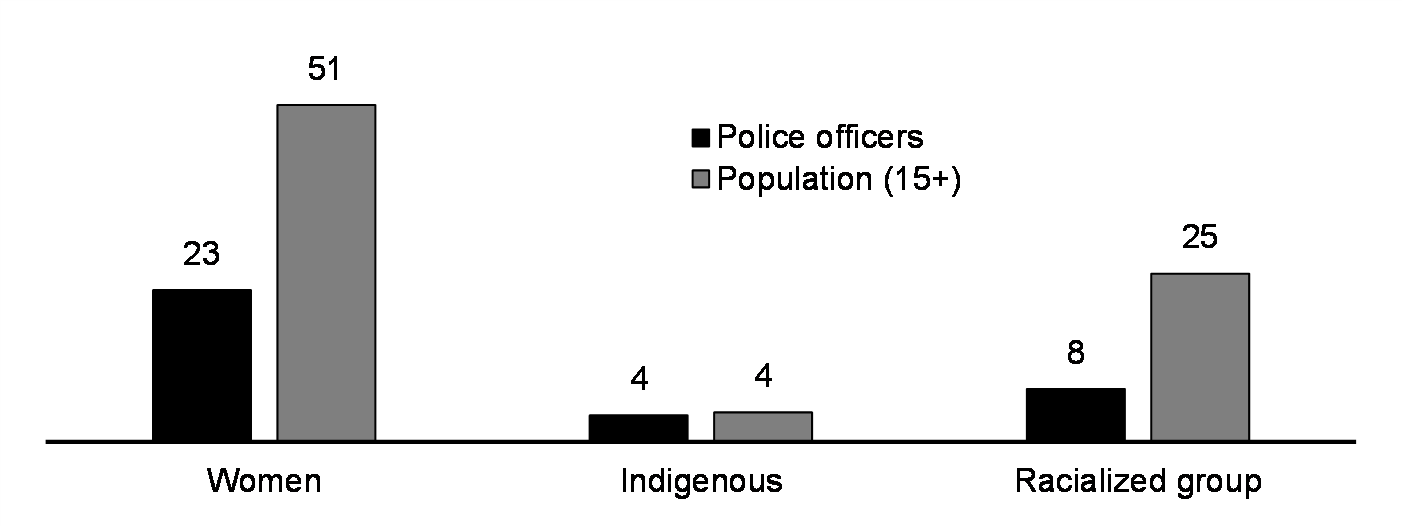
- There are significant diversity gaps in policing. While Black and racialized people account for 25 per cent of the population, they account for only 8 per cent of police officers. Similarly, women accounted for only 23 per cent of police officers in 2022, only a slight increase compared to recent years. Ensuring greater diversity and police services that reflect the demographics of the communities they serve helps to improve communication, cultural understanding, and the delivery of equitable justice.
The government remains committed to promoting diversity in leadership positions by taking such actions as establishing Canada's first gender-balanced cabinet, increasing the representation of women in the federal judiciary, and expanding the application of diversity disclosures.
The government acknowledges the crucial role of women in leadership for advancing gender justice in Canada, with the goal of creating a more inclusive and equitable society. Likewise, active involvement of equity-deserving groups in economic, political, and judicial spheres is vital to ensure that the diverse perspectives and experiences of all Canadians are considered at every stage of the decision-making process.
Actions to Support Leadership and Democratic Participation
Previous Budget Actions
- As of July 4, 2023, the remaining two amendments of the Public Service Employment Act came into force, which require departments and agencies subject to the Act to evaluate assessment methods used in hiring processes for biases and barriers that disadvantage people belonging to equity-seeking groups, and to take steps to remove or mitigate these.
- On February 21, 2024, the government announced its first initiatives as part of the Action Plan for Black Public Servants, including enhancement to mental health supports for Black public servants, and dedicated programming to support the career development and advancement of Black public servants.
- As of February 2024, the government's investment of nearly $100 million for the Black Entrepreneurship Program Ecosystem Fund (a part of the Black Entrepreneurship Program) has supported 43 Black-led not-for-profit organizations to develop new services or expand those already offered, such as mentorship, networking, financial planning, and business training for Black entrepreneurs.
- As of February 2024, the government has committed $140 million of its Budget 2021 allocation to support women entrepreneurs as part of Women Entrepreneurship Strategy (WES). This includes $55 million to five loan administrators for the Women Entrepreneurship Loan Fund; $15 million to five not-for-profits delivering the WES Inclusive Women Venture Capital Initiative; $65 million to 24 not-for-profits delivering projects through the WES Ecosystem Fund; and $5 million to Toronto Metropolitan University for the Women Entrepreneurship Knowledge Hub.
Budget 2024 Actions*
- Renewed investments in Indigenous Governance and Capacity programs will support First Nation governments and tribal councils in designing and delivering critical programs and services to their members. As well, continued support to advance the new fiscal relationship will help First Nation communities to tailor programs and services to the needs of specific groups.
- More Judges for Faster Access to Justice helps improve access to justice for all Canadians and strengthens the public's confidence in the judicial system. New judges are selected through a superior courts judicial appointment process that aims to achieve a gender-balanced bench, reflecting the diversity of Canadian society.
- Financial Sector Statutes Review would benefit underrepresented communities, including women, Indigenous people, persons with disabilities, and Black and racialized people, by encouraging diversity amongst executives in these institutions.

Gender Results Framework
Pillar: Gender-Based Violence and Access to Justice
Goal: Eliminating gender-based violence and harassment, and promoting
security of the person and access to justice
Every Canadian deserves a life free from violence, regardless of their identity or circumstances.
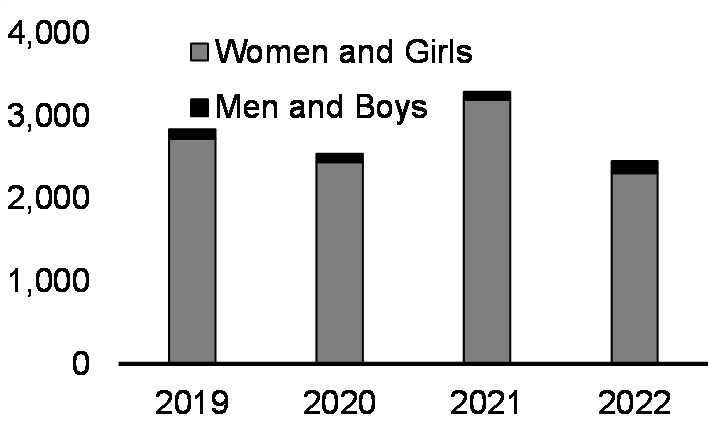
Workplace harassment
Self-reported sexual assault (since age 15, %, 2018)
Reported sexual assaults deemed unfounded (%, 2017-2022)
Intimate partner violence (IPV)
Homicide
Note: * Because of a small sample size, the estimate of the share of Indigenous men experiencing discriminatory behaviour in the workplace is considered too unreliable to publish.
Sources: Survey on Sexual Misconduct at Work, Survey of Safety in Public and Private Spaces, Incident-based Uniform Crime Reporting Survey, Homicide Survey.
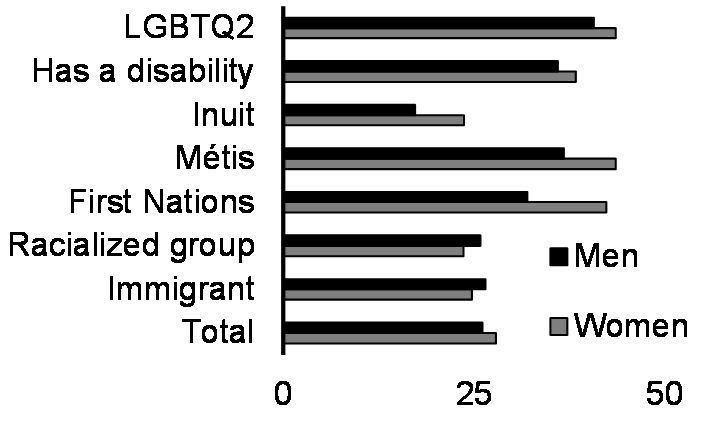
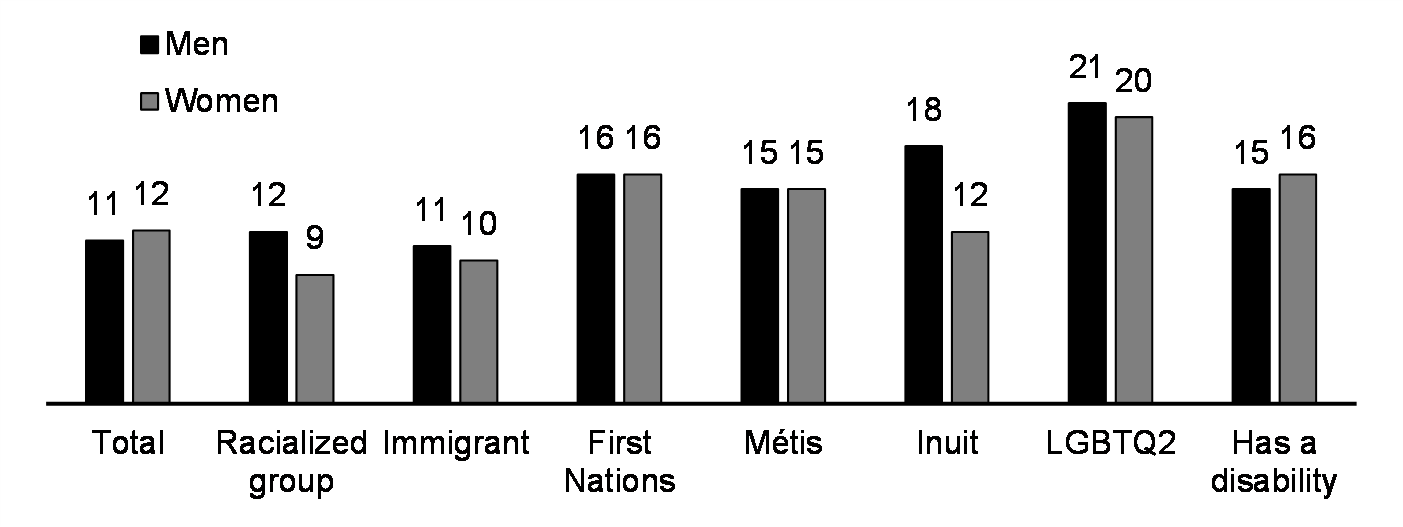
Incidents of gender-based violence, encompassing acts ranging from harassment to homicide rooted in gender identity, gender expression, or perceived gender, persist in Canada. Disparities in violence rates are particularly evident among minority groups.
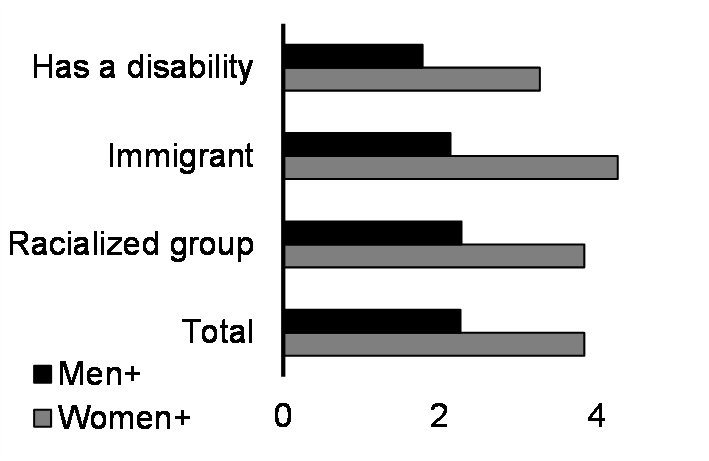
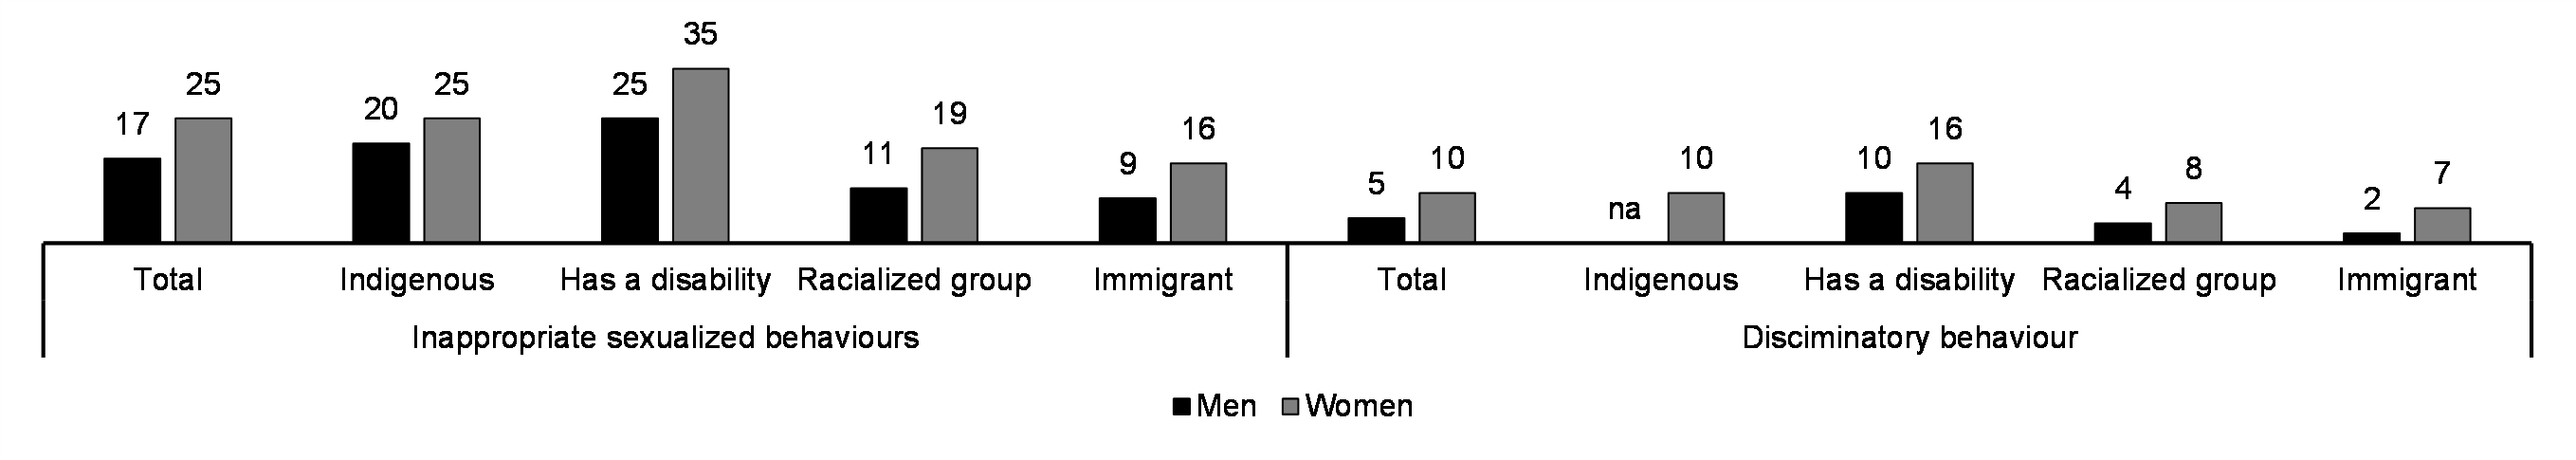
- In 2020, women were twice as likely as men to encounter discriminatory behaviour in the workplace. Inappropriate sexualized behaviour in the workplace remains common with 25 per cent of women experiencing inappropriate sexualized behaviour and 17 per cent of men. Notably, both men and women with disabilities reported rates that well exceeded these averages.
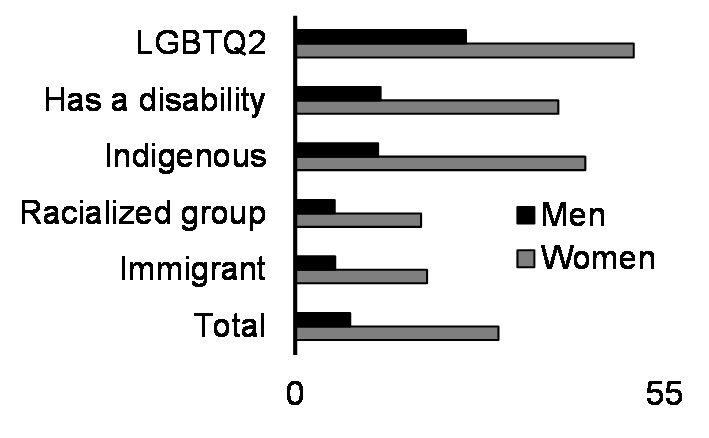
- In the Canadian Armed Forces, this trend is reflected at higher rates with 34 per cent of women experiencing sexualized or discriminatory behavior in the past twelve months in 2022, compared to 16 per cent of men.
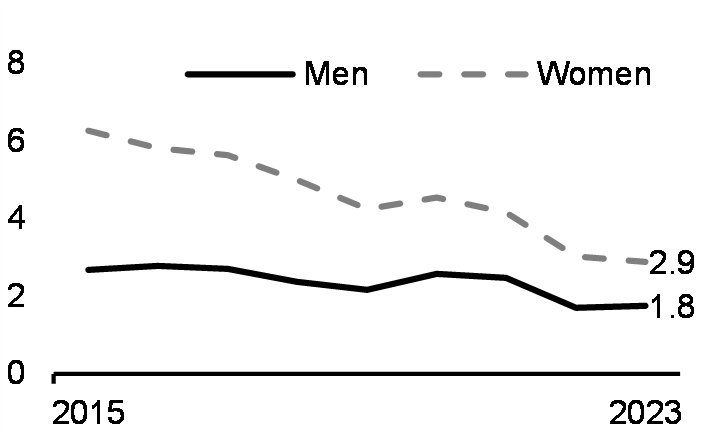
- In 2018, women were almost four times more likely than men to report experiencing sexual assault since the age of 15. The incidence of sexual assault was higher than average among LGB women, Indigenous women, and women with disabilities.
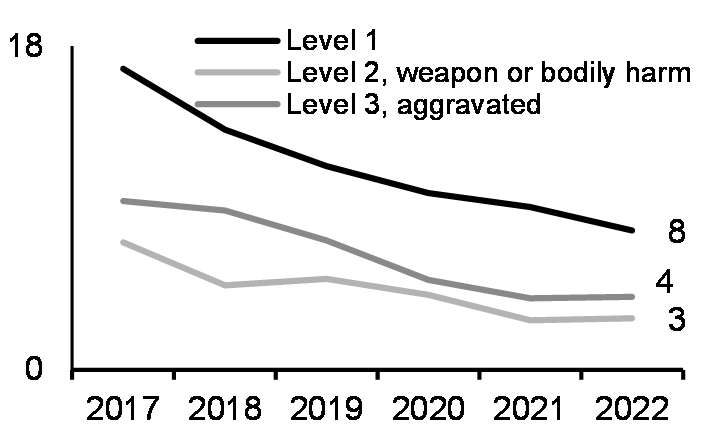
- The adoption of policies, including trauma-informed training, civilian oversight of investigative procedures, and revised protocols concerning the determination of unfounded accusations, has proven effective. This is evidenced by the decline in the share of reported sexual assaults deemed unfounded by the police between 2017 and 2020.
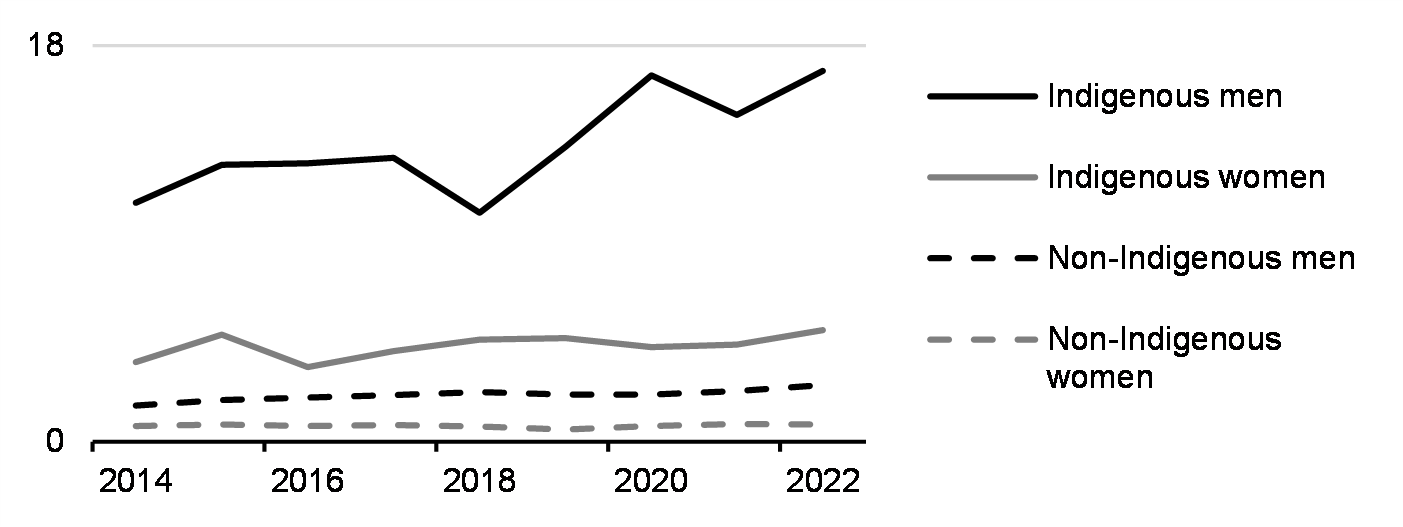
- In 2022, Indigenous men and women were almost seven times more likely to be victims of homicide than their non-Indigenous counterparts.
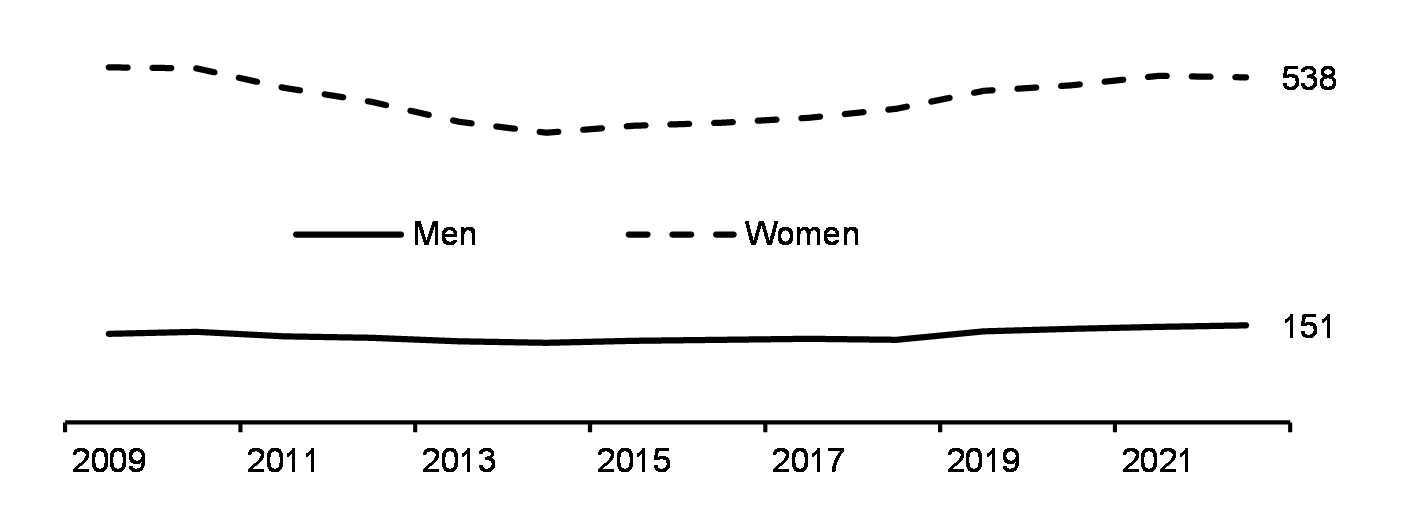
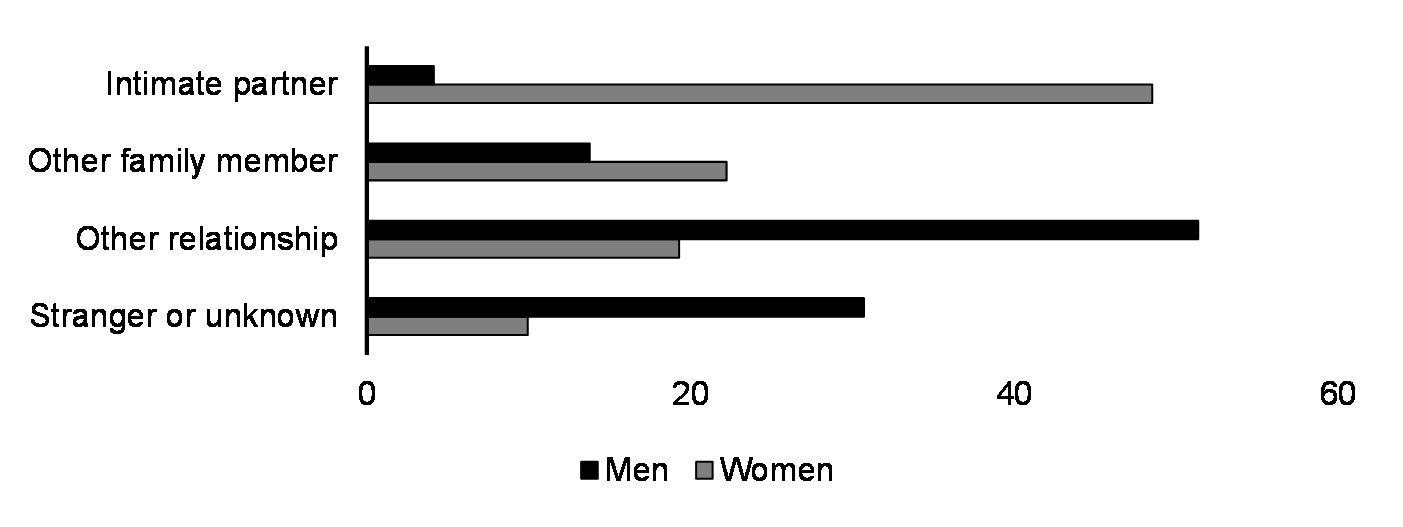
- Women victims of homicide were 12 times more likely than men to have been killed by an intimate partner. In contrast, men were more likely to be murdered by an acquaintance, a stranger, or someone of criminal relation.
- In 2019, one in four teens aged 12 to 17 reported experiencing cyberbullying in the previous year. Some young people are more vulnerable to cybervictimization, including Indigenous youth, sexually diverse and non-binary youth, youth with a disability, and girls and women.
Systemic inequalities and discrimination enable acts of gender-based violence and violence against other vulnerable individuals. In violating the dignity of the victim, gender-based violence creates barriers to full and equal participation and reinforces discriminatory norms that hinder the overall well-being of marginalized groups in society.
The government remains committed to ensuring the safety and dignity of all individuals, regardless of their identity or background, by taking action to improve equity in the justice system, prevent family violence and combat workplace sexual harassment.
Actions to End Gender-Based Violence and Support Access to Justice
Previous Budget Actions
- By December 2023, 13 bilateral agreements were signed and announced with the provinces and territories to support the implementation of the National Action Plan to End Gender-Based Violence.
- To Address Workplace Harassment, Discrimination, and Violence in the federal public service, in October 2023, the government announced the members of a panel of experts that will provide recommendations to the government on the design and creation of a new restorative engagement program for employees.
- To support work to Address Systemic Racism in Public Safety Institutions, the RCMP launched the Race-Based Data Collection pilot on January 8, 2024, in three sites (Thompson, Manitoba; Whitehorse, Yukon; and Wood Buffalo, Alberta), with two sites in British Columbia and Nova Scotia to follow in spring 2024.
- In 2023, it was announced that $25 million was allocated to support new projects to Fight Radicalization to Violence through the Community Resilience Fund. This is in addition to the more than $35 million the Fund has provided to 48 projects since 2017.
- To Maintain Effective Oversight of Canada's Correctional System, the Office of the Correctional Investigator conducted investigations into issues impacting federally incarcerated women and gender diverse individuals.
Budget 2024 Actions*
- Support for Indigenous Justice Programming aims to contribute to reducing the overrepresentation of Indigenous people in the criminal justice system.
- First Nations and Inuit-led Policing will support culturally responsive policing in Indigenous communities.
- Continued funding for immigration and refugee legal aid will support access to justice for vulnerable asylum seekers who cannot afford legal services.
- The recommendations of the Future of Sport in Canada Commission will help ensure that all sport participants have a safe and positive experience in sport.
- Taking Assault Weapons Off Our Streets will contribute to reducing firearms-related intimate partner violence.

Gender Results Framework
Pillar: Poverty Reduction, Health, and Well-Being
Goal: Reduced poverty and improved health outcomes
Every Canadian should be free from poverty, with ensured access to essential services and social protections for a high quality of life.
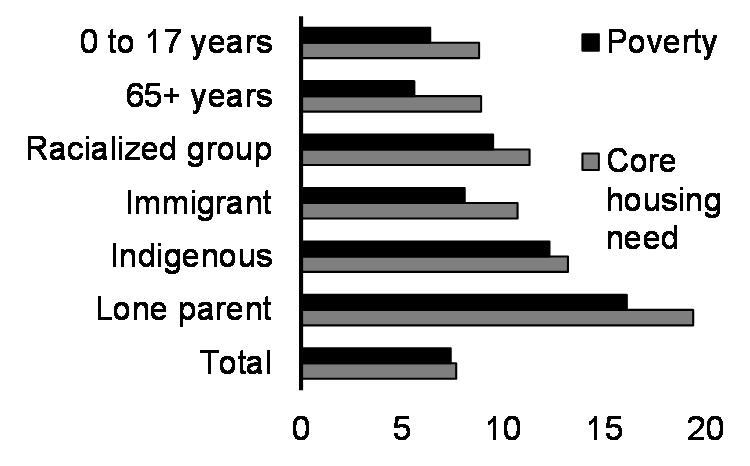
Poverty and core housing need
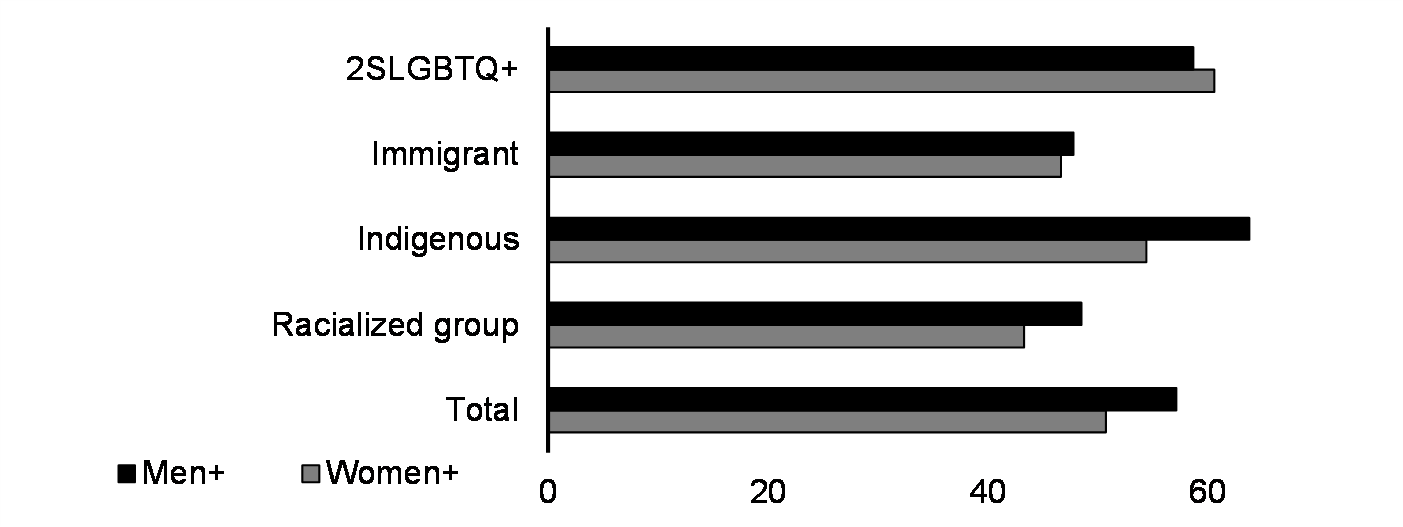
Moderate or severe food insecurity (15+ years, %, 2021-2022)
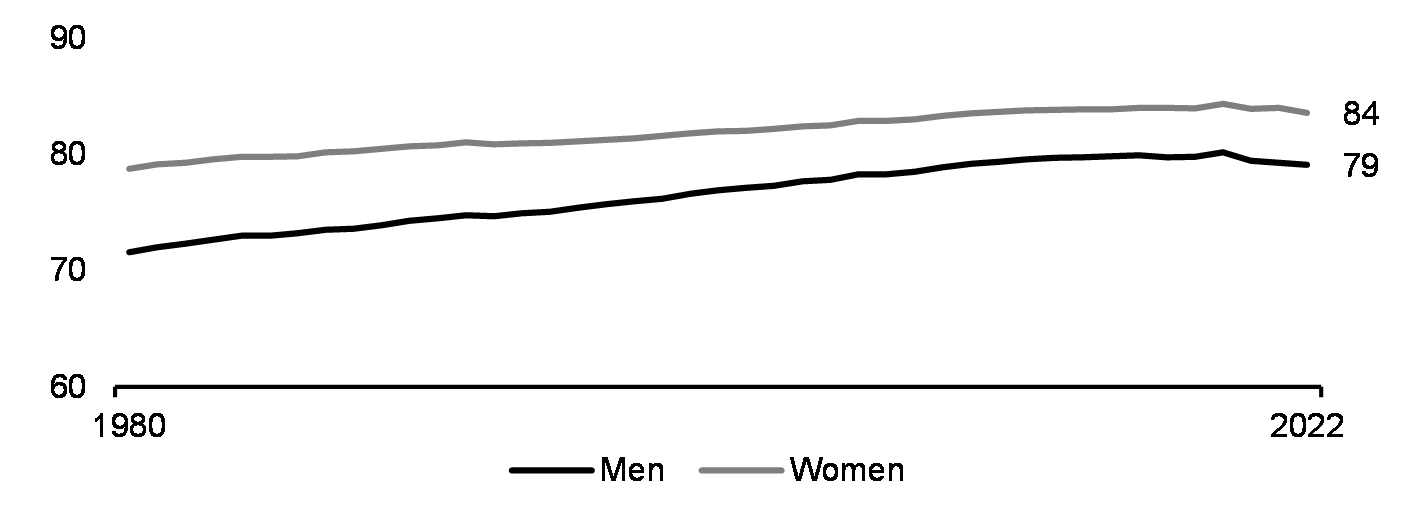
Life expectancy at birth (years, 1980-2022)
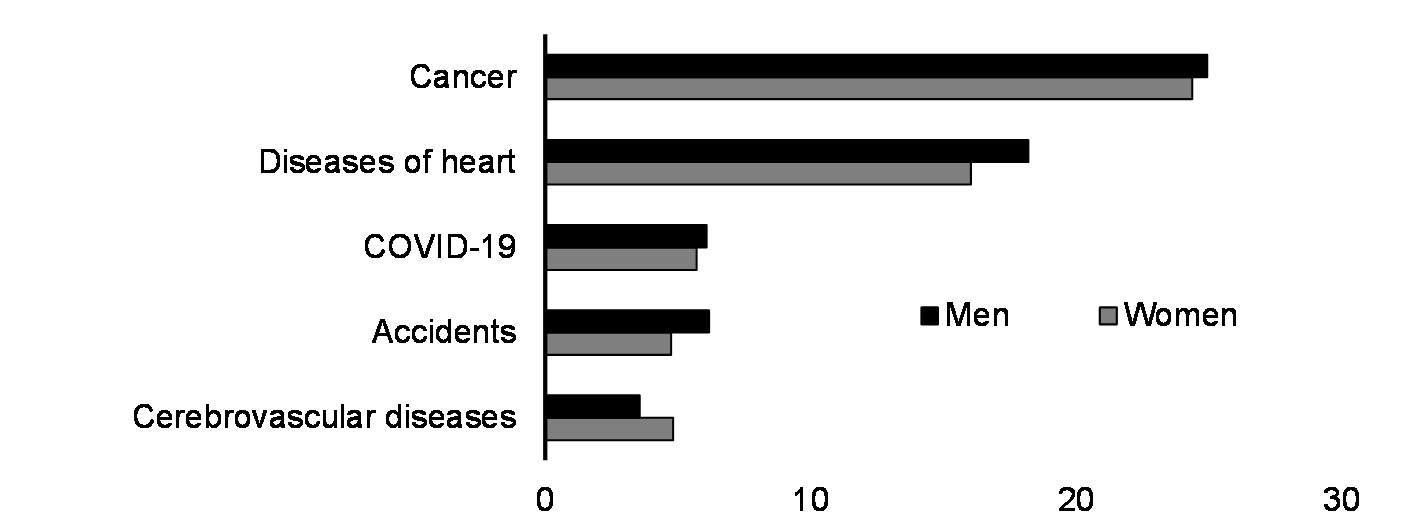
Distribution of leading causes of death (%, 2022)
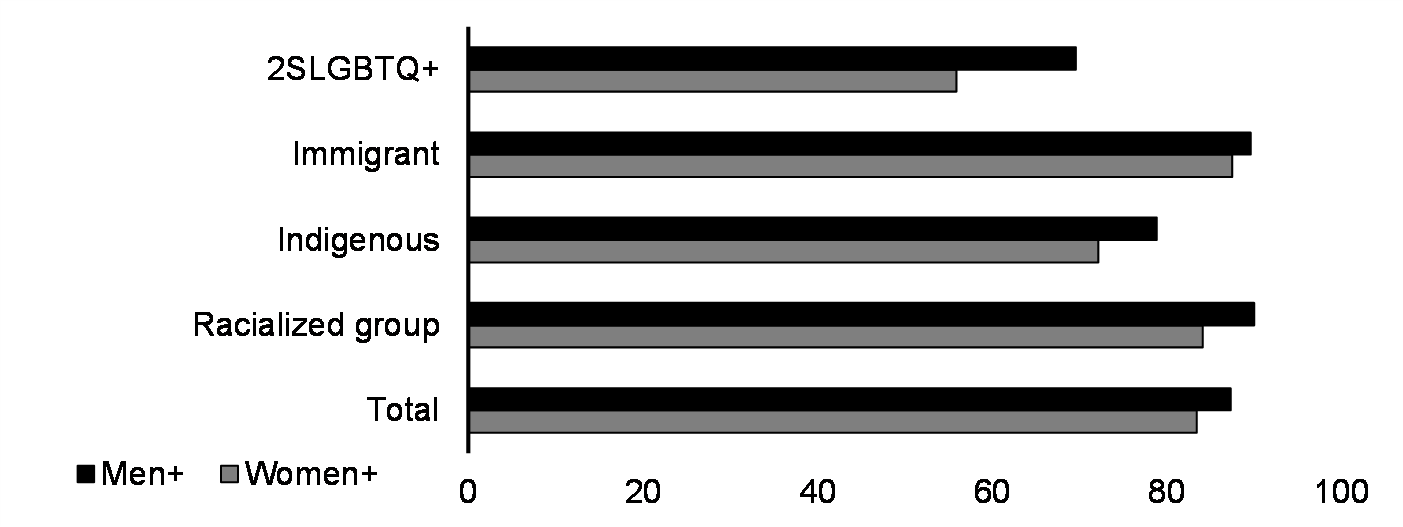
Percentage of persons meeting physical activity guidelines (12+ years, %, 2021)*
Percentage of persons reporting good, very good or excellent mental health (15+ years, %, 2022)*
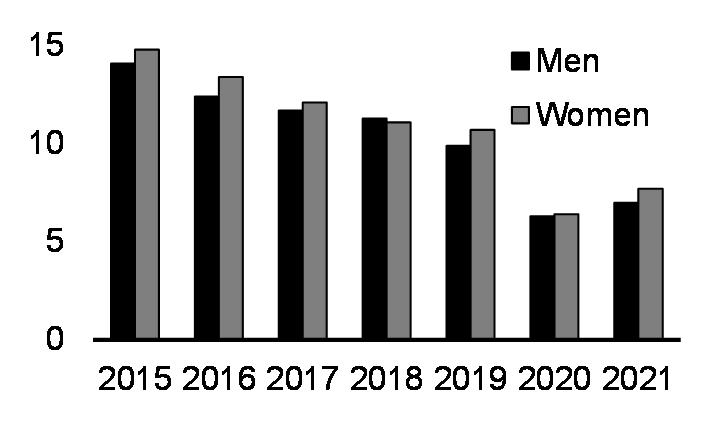
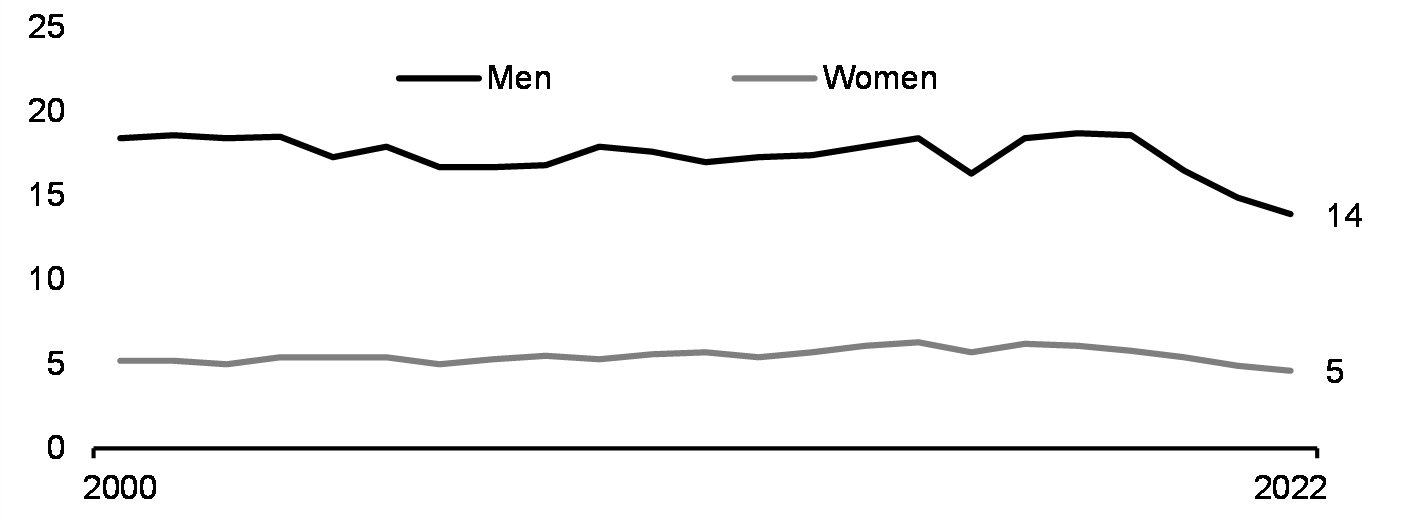
Deaths by suicide (rate per 100,000, 2000-2022)
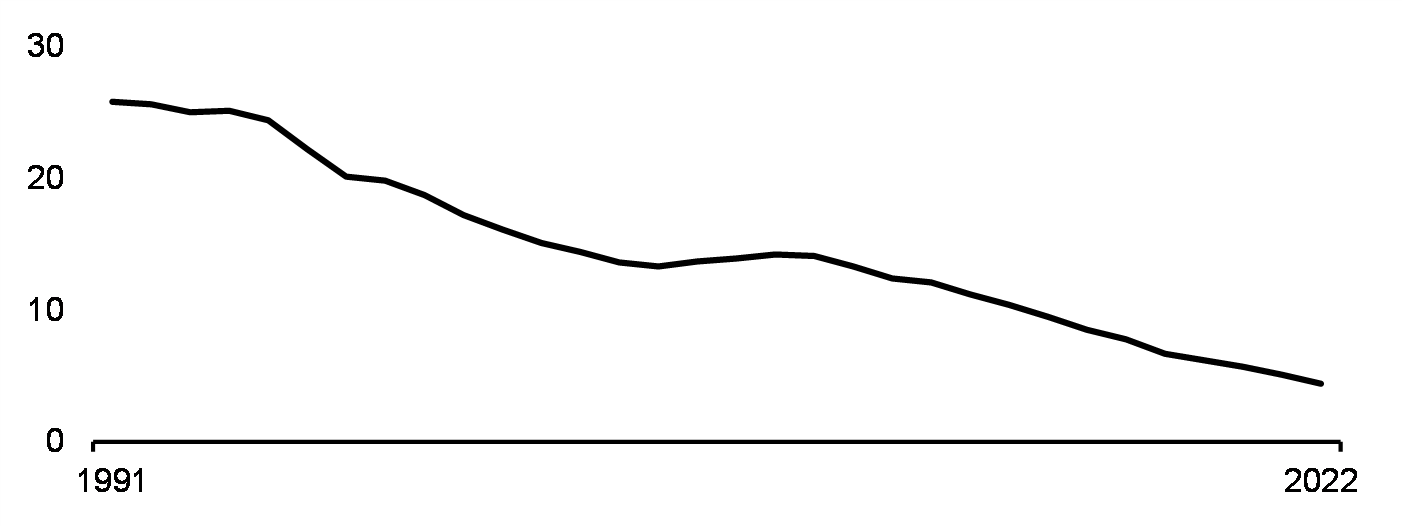
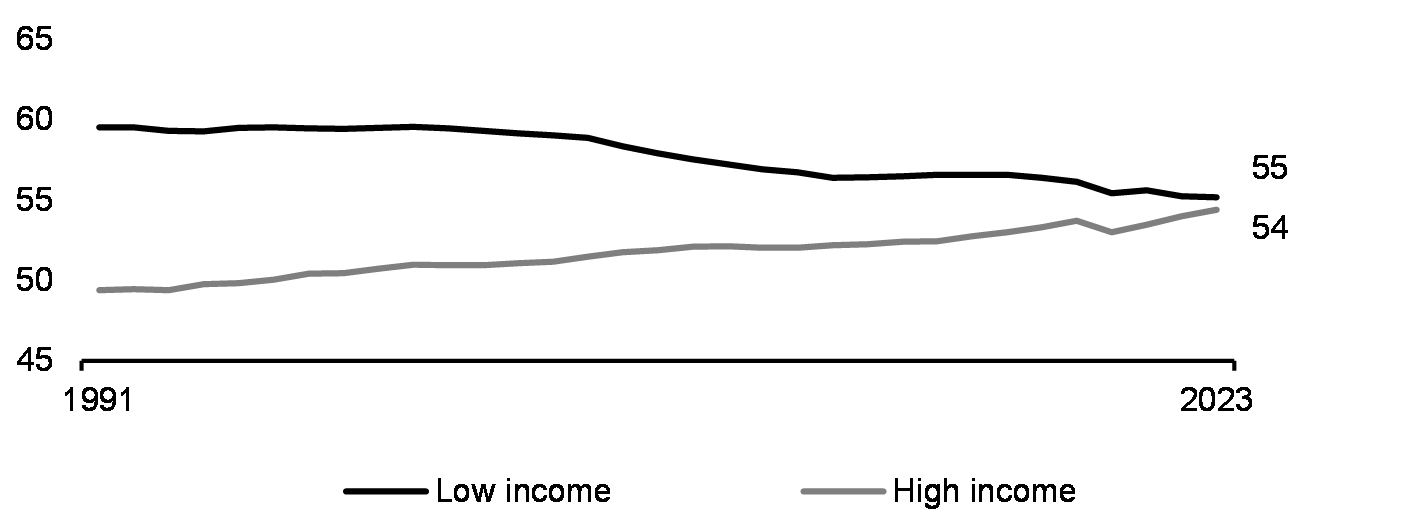
Early motherhood: live births (rate per 1,000, women, 15-19 years, 1991-2022)
Note: * As the non-binary population is small, data aggregation to a two-category gender protects confidentiality. People in the category "non-binary persons" are distributed into the other two-gender categories and denoted by the "+" symbol.
Sources: Census of population, Canadian Income Survey, Vital Statistics Birth Database, Vital Statistics Death Database, Centre for Demography, Canadian Community Health Survey, Aboriginal Peoples Survey, General Social Survey.
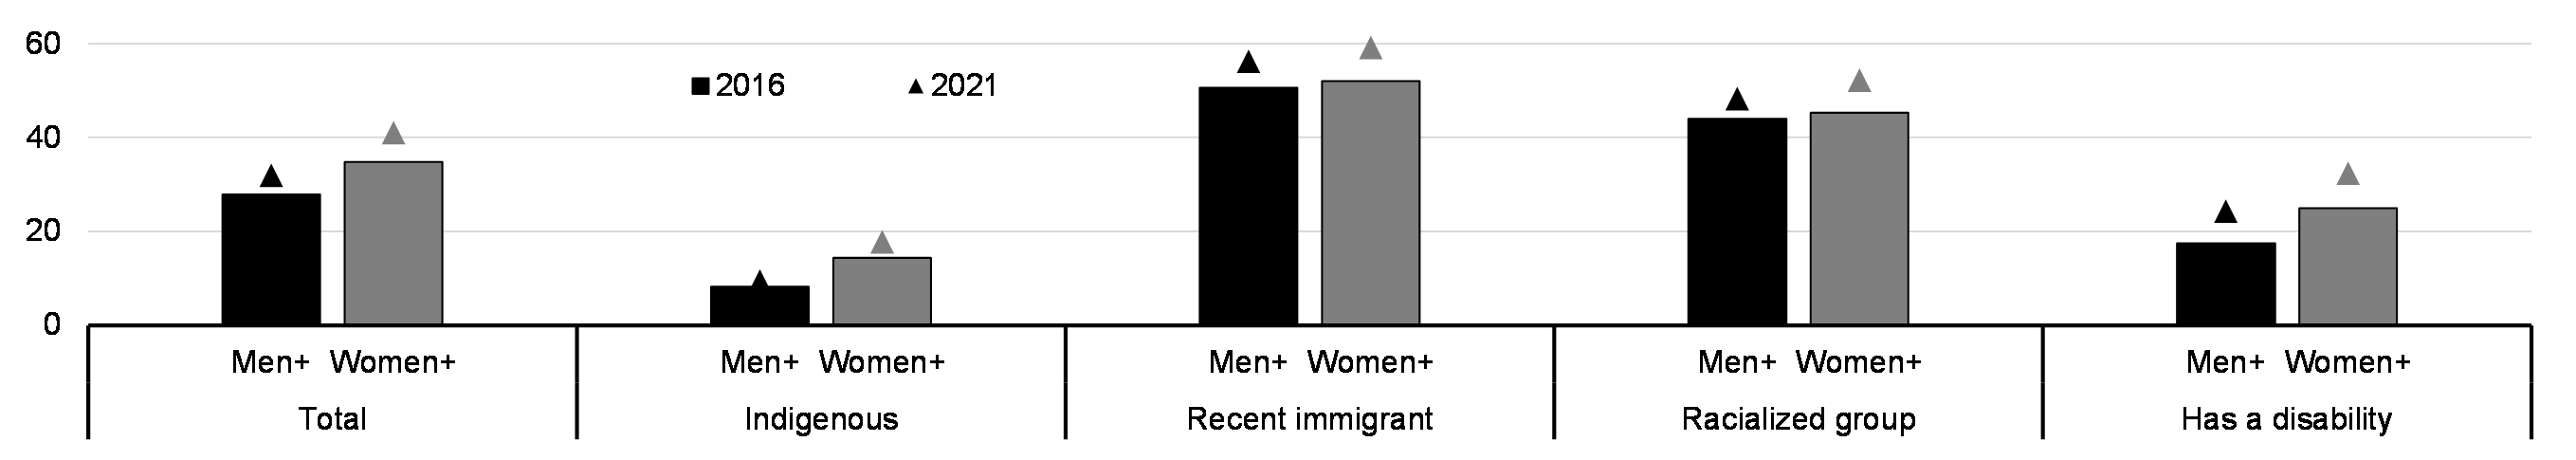
In recent years, substantial progress has been made to reduce poverty overall and for vulnerable sub-populations. Furthermore, Canadians are living longer, healthier lives than ever before. Continued progress is still needed, especially on food insecurity, adequate affordable housing, and mental health.
- In the years leading up to the pandemic, the poverty rate in Canada consistently decreased for the overall population, and among groups more susceptible to poverty, including Indigenous people, immigrants, and those in lone-parent families. Temporary COVID-related income supports further contributed to a decline in the poverty rate in 2020 and 2021. In spite of this progress, core housing need is elevated for lone-parent, Indigenous, immigrant and racialized households.
- Elevated inflation contributed to an increase in 2022 in the proportion of Canadians experiencing food insecurity. Persons in lone-parent families, which are 77 per cent led by women, are the most vulnerable to food insecurity. Indigenous and racialized persons are also more likely to experience food insecurity.
- Life expectancy of Canadians has steadily increased over time, particularly for men, but has started to stabilize. A woman born today can expect to live until age 84 on average, a five-year advantage over a man. Cancer and heart disease continue to be the leading causes of death among Canadian men and women.
- Canadian women are generally less likely than men to meet physical activity guidelines, with a lower proportion of immigrants and racialized persons meeting these recommendations. Women are also more likely to describe themselves as being in poor or fair mental health. This trend is more pronounced among Indigenous and 2SLGBTQI+ people. Conversely, men are almost three times as likely as women to die from suicide.
The government continues to make targeted investments to support Canadians who need it most, including by delivering unprecedented support for Canadians with disabilities through the Canada Disability Benefit, introducing a Canadian Dental Care Plan, and making progress on addressing the high cost of living.
Poverty is a multidimensional issue, with causes and effects that interact to produce cycles of poverty, impede intergenerational mobility, and erode the foundations for long-term well-being. It is a fundamental right of individuals to live their lives in dignity and free of severe material deprivation.
Actions to Support Poverty Reduction, Health, and Well-Being
Previous Budget Actions
- Since the launch of Reaching Home: Canada's Homelessness Strategy in 2019, 71,580 people were placed into more stable housing through the program and 125,154 people received prevention or shelter diversion services. Results are cumulative (for 2019-2023) and as of December 2023.
- Funding provided through the Sexual and Reproductive Health Fund has enabled a three-fold increase in the number of people receiving travel and logistical support to access abortion services.
- Through Food Banks Canada, 392 pilot locations for the Menstrual Equity Fund Pilot, reaching 570,000 low-income individuals each month.
- The Canadian Institutes of Health Research launched the National Women's Health Research Initiative in fall 2022, in partnership with Women and Gender Equality Canada. The high-priority areas were defined in consultation with over 160 community experts across Canada through an Ideas and Learning Fair.
- To date, over 406,000 children under 12 have received the interim Canada Dental Benefit, helping ensure they can access the dental care they need.
- The Canada Child Benefit, introduced in 2016, has helped lift 650,000 children out of poverty between 2015 and 2021.
Budget 2024 Actions*
- Investments in the Strengthening Local Food Security and the Strengthening Access to Culturally Important Foods will help increase the availability and accessibility of nutritious and culturally appropriate food for equity-deserving groups, improving health and well-being.
- Investments in First Nations and Inuit Health, Supporting Indigenous Mental Health, and Addressing Anti-Indigenous Racism in Health Care will advance health outcomes of First Nations, Inuit, and Métis people. This includes maintaining access to essential, high-quality, and culturally safe health services to improve the health and well-being of Indigenous populations.
- Once established in partnership with willing provinces and territories, the new National Pharmacare Plan will improve health care for Canadians by improving access to contraceptives and diabetes medications.
- The new Canada Disability Benefit would increase the financial well-being of low-income persons with disabilities by providing an income-tested benefit for those with a Disability Tax Credit certificate.
- New funding for Addressing Homelessness and Encampments will help prevent and reduce homelessness for those with the highest housing needs, including those experiencing unsheltered homelessness or living in encampments.
- Enhancing Enhancing Low- and No-Cost Bank Accounts will benefit low-income and moderate-income Canadians by enhancing affordable access to basic banking account services. Additionally, capping Non-Sufficient Funds (NSF) fees at $10 will reduce financial burdens on Canadians who find themselves in an NSF situation, by reducing the financial burden of missing a payment.
- Once established, the new Youth Mental Health Fund will support community health organizations provide more mental health care for younger Canadians, and better equip these organizations to refer youth to other mental health services within their networks and partnerships.

Gender Results Framework
Pillar: Gender Equality Around the World
Goal: Promoting gender equality to build a more peaceful, inclusive,
rules-based, and prosperous world
Canada is a leader and champion for gender equality, and will continue to advance efforts that empower women, girls, and gender-diverse people both domestically and abroad.
Education and skills
Economic participation and prosperity
Women's participation in select public sector leadership positions – globally (%)*
Gender-based violence
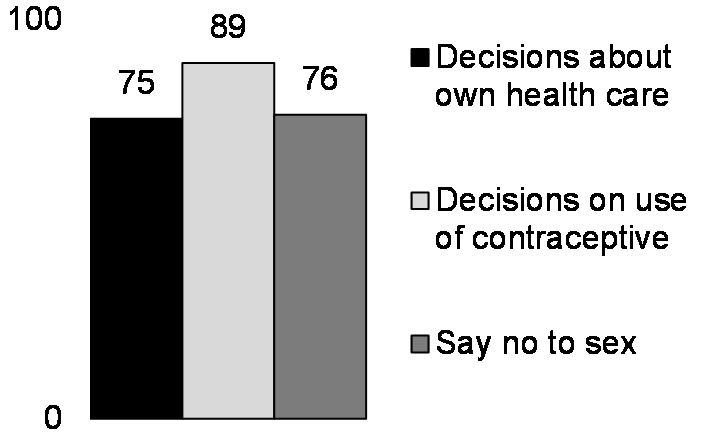
Can make decisions about sex and reproduction (%, married women aged 15-49, 2023)
Note: * Data as of January 1, 2023, with exception of parliamentarians (January 1, 2024) and judiciary (2017).
Sources: World Bank, World Economic Forum, Inter-Parliamentary Women, United Nations (UNICEF, UN Women).
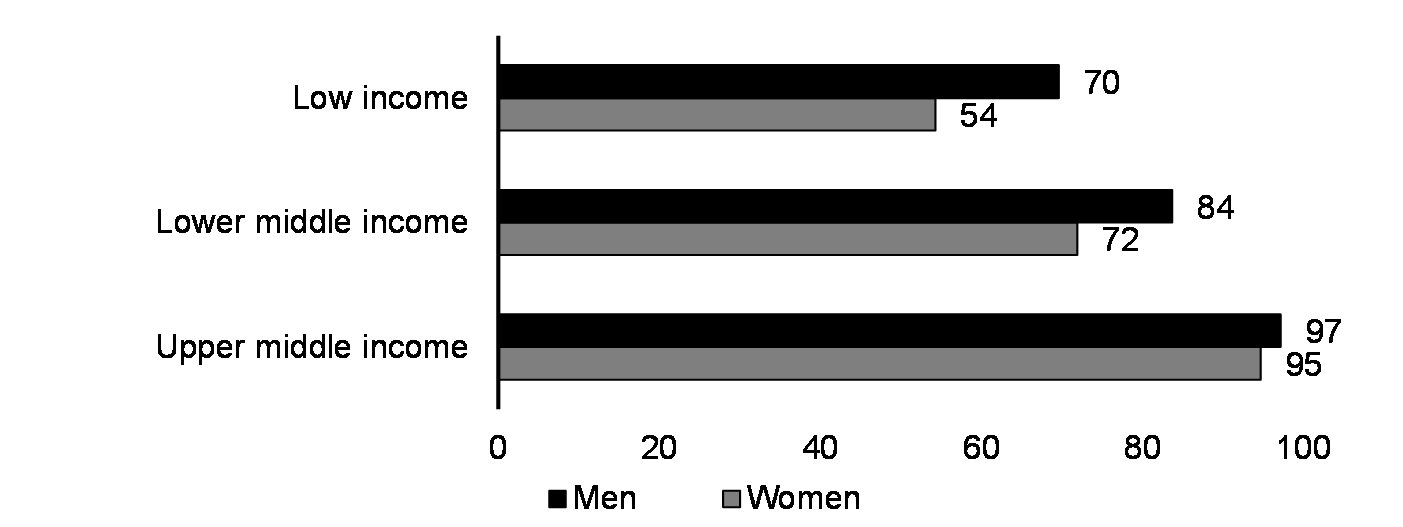
International gender equality metrics have improved in key areas such as labour force participation and literacy rates. However, significant gaps persist between women of different income cohorts, and women continue to be underrepresented in STEM fields in post-secondary educational attainment as well as industry leadership.
- Significant progress has been made in raising women's literacy rates and women in high-income countries are now participating in the labour force more than ever before. Nevertheless, women continue to exhibit lower literacy rates than men and are less likely than men to participate in the labour market, particularly at lower income levels.
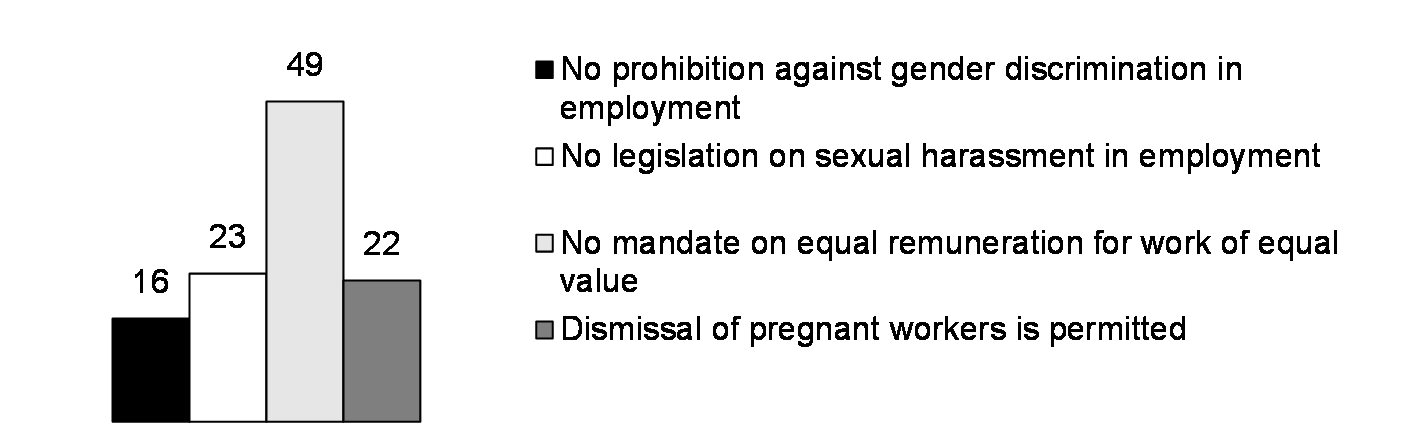
- Women continue to face barriers in acquiring or maintaining employment. In numerous countries, the absence of legislation and criminal penalties for sexual harassment in the workplace, along with unresolved disparities in job prospects between women and men, exacerbates these challenges.
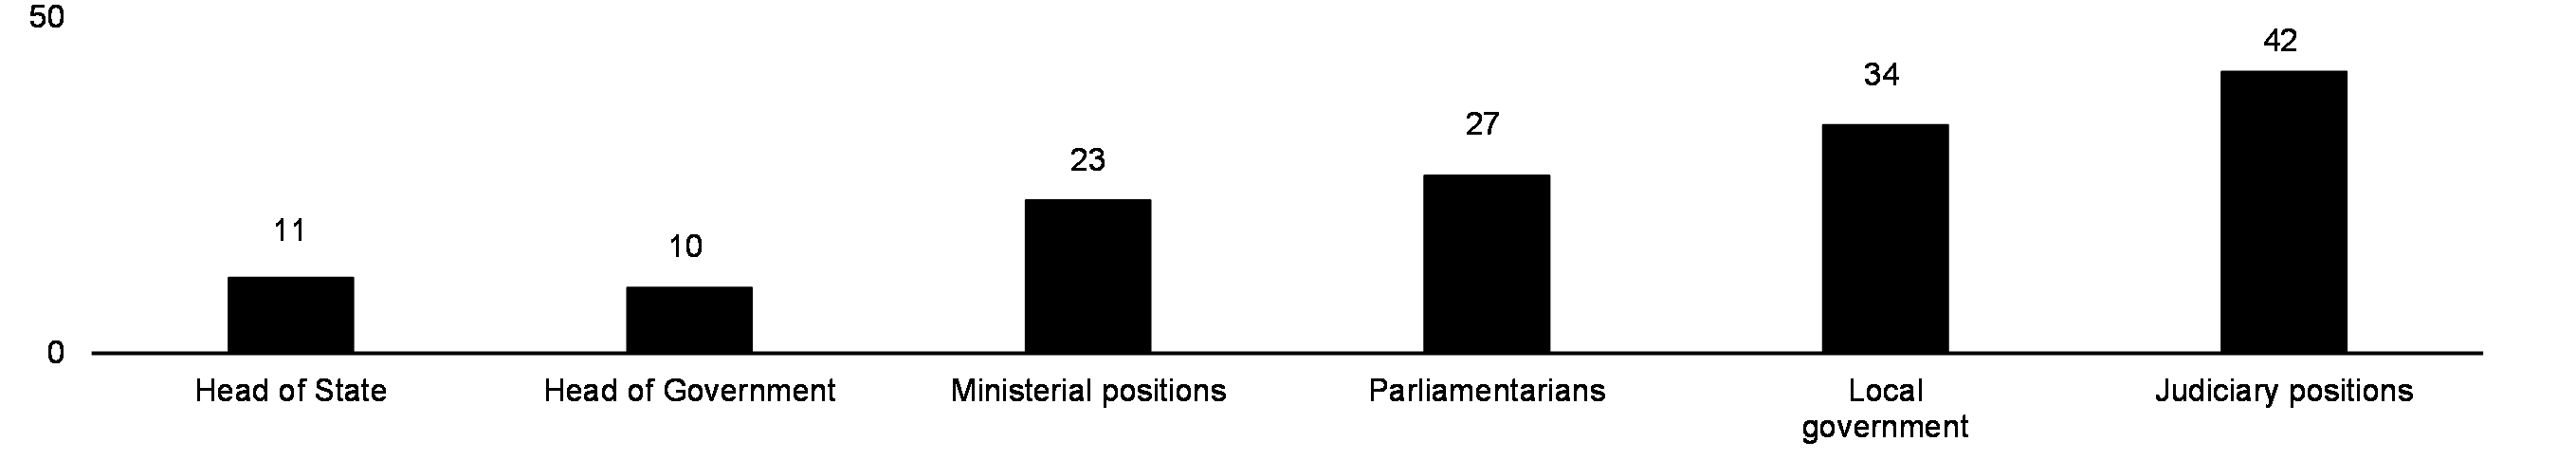
- Women continue to be underrepresented in public leadership positions, albeit less so at the local level, and therefore unable to reap the corresponding opportunities to actively participate in informing policies and promote a sense of belonging within society.
- The occurrence of child-brides continues to be an issue, as well as the use of sexual violence against women in conflict regions.
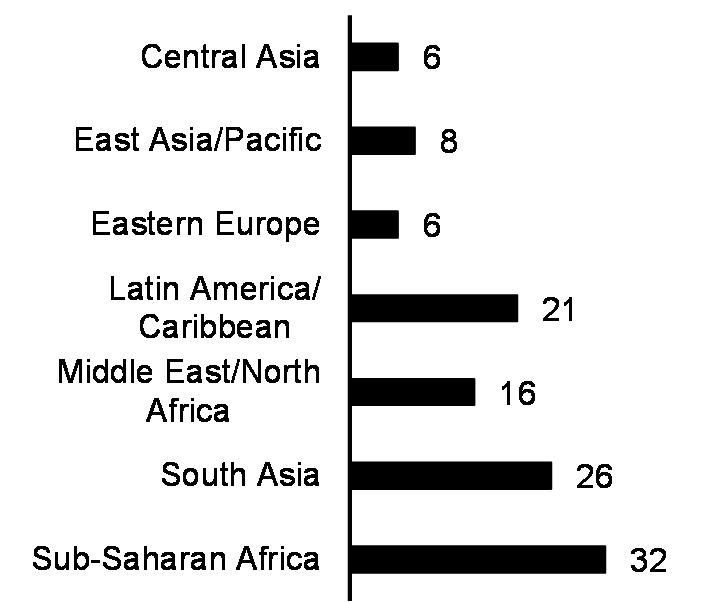
- Globally, almost one-half of women who are married or in a union do not have full control with regard to their sexual and reproductive health and rights, with substantial discrepancies between regions.
Gender equality is a fundamental human right and is at the core of a more peaceful world. Women and girls often act as agents of peace by addressing root causes of conflicts. Yet, conflict resolution processes frequently exclude women. In this context, Canada recently released Foundations for Peace, its third national action plan on the Women, Peace and Security agenda. Through this plan, the government commits to supporting gender equality and to promoting and protecting the rights and agency of women, girls and gender-diverse people. These commitments guide Canada's international assistance to combat gender inequality abroad.
In recognition of the disproportionate impact suffered by women and girls in conflict regions, including in Ukraine and the Middle East, the government continues to prioritize humanitarian assistance efforts. Further, Canada made a bold commitment to raise its global health spending to $1.4 billion per year, starting in 2023, half of which is dedicated to sexual and reproductive health and rights. As a world leader in gender budgeting and the promotion of women's rights, Canada stands at the forefront of efforts to empower and advance opportunities of women and girls around the world.
Actions to Support Gender Equality Around the World
Previous Budget Actions
- In 2019, Canada launched a ten-year commitment to advance the health and rights of women and girls around the world (2020-2030). As part of this effort, Canada committed to increasing its global health funding to reach an average of $1.4 billion each year, starting in 2023, of which $700 million will be dedicated to sexual and reproductive health and rights.
- In 2021, Canada provided $165 million in humanitarian assistance to address the life-saving needs of those affected by conflict and natural disasters around the world. Canada's gender-responsive approach to humanitarian action aims to address the specific needs and priorities of people in vulnerable situations, particularly women and girls. For example, Canada supported 51.5 million people, 28 million of which were women and girls, in 40 countries and territories through the Central Emergency Response Fund.
- Since the start of Russia's war in Ukraine, Canada has provided over $352.5 million in humanitarian assistance funding to help Ukrainians access primary health care; water, sanitation; multipurpose cash assistance and non-food items; child protection and sexual and gender-based violence services; and women and girls' safe spaces.
- Canada has adopted a feminist approach to environment and climate action, including in the delivery of the $5.3 billion international climate finance commitment from 2021‑22 to 2025-26. For example, Canada's climate finance is helping smallholder farmers in Latin America and the Caribbean—including thousands of women—to adopt practices and technologies that enable them to adapt to climate change and reduce their greenhouse gas emissions.
Budget 2024 Actions*
- Reconstruction and Development Support for Ukraine will benefit the people of Ukraine and other EBRD countries of operations in Eastern Europe, Central Asia, and the Southern and Eastern Mediterranean region, by supporting inclusive economic growth, with strong gender equality considerations integrated into EBRD projects.
- Sustainable Growth in Latin America and the Caribbean will generate financing for private sector-led efforts to advance gender equality, inclusivity, and diversity across IDB Invest's 25 borrowing member countries in Latin America and the Caribbean. IDB Invest operations are expected to prioritize improving economic opportunities for women, as well as Indigenous People, Afro-descendants, and LGBTQ+ persons.
- Increasing Canada's International Humanitarian Assistance in 2024-25 and 2025-26 will help address growing needs globally. This measure will directly benefit vulnerable people affected by humanitarian crises in low-income countries. Funding provided will be guided by Canada's Feminist International Assistance Policy, which supports well-designed programming that responds to the specific needs of women and girls.
Summary of Budget 2024's Gender and Diversity Impacts
This summary provides a statistical analysis of the gender and diversity impacts for the new investments presented in Budget 2024. It leverages key information provided in the Gender-based Analysis Plus (GBA Plus) Departmental Summary Template to illustrate how gender and diversity considerations are central to budgetary decisions. By leveraging gender and diversity analysis, the government is better able to understand who is impacted by its policies and identify where transformative supports are most needed.
Timing of GBA Plus
Timing of GBA Plus
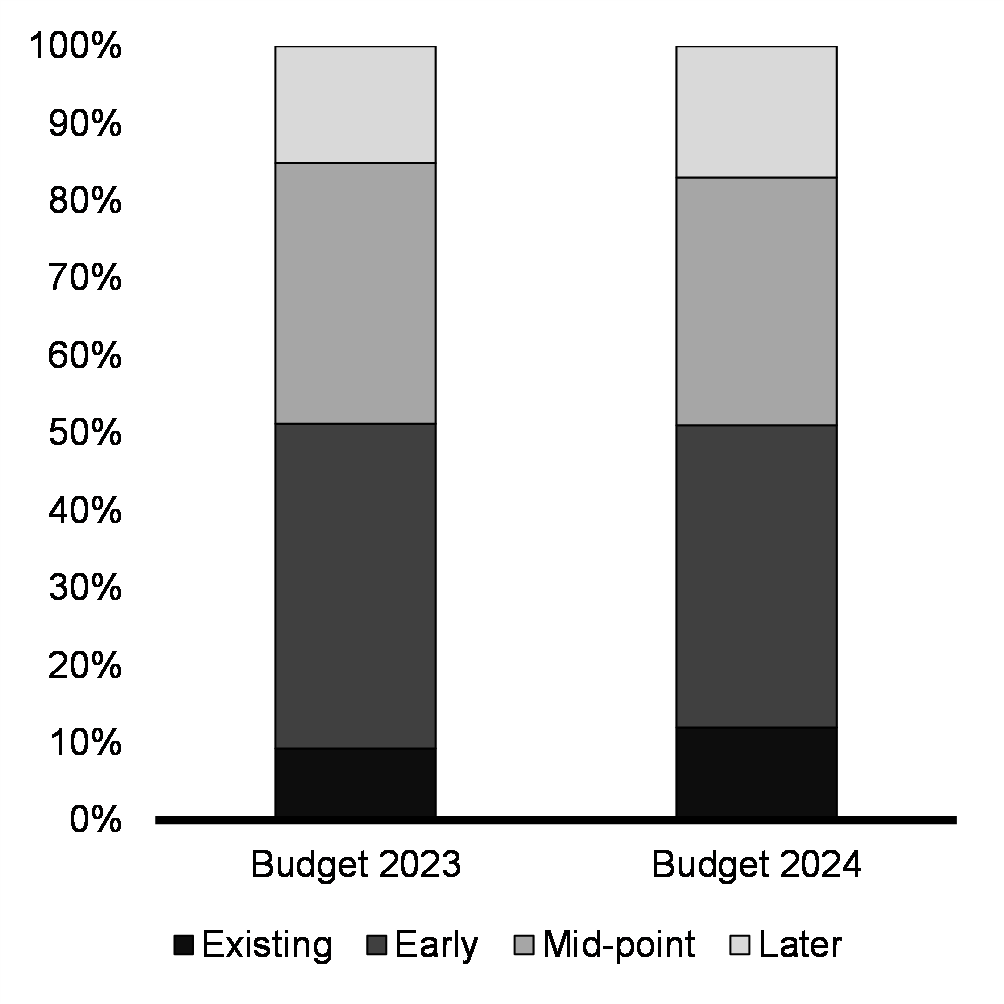
Budget 2024 continues to demonstrate the timeliness of GBA Plus considerations in informing budgetary measures, with over 70 per cent of measures having completed GBA Plus at the early and mid-stages. At least 12 per cent of measures relied on existing GBA Plus analysis, which is mainly attributable to the extension of existing government programs and improvements in the availability of disaggregated data. An interesting finding is that for some of these measures that used existing GBA Plus, an iterative policy lens was applied to identify any barriers or negative impacts that may have emerged since the initiative came into effect. As an example Boosting Regional Economic Growth also identified specific barriers for specific subgroups such as women, Indigenous people, and persons with disabilities in accessing this program and proposes a responsive approach. This includes Regional Development Agencies adopting best practices to improve inclusivity, sharing of tools, strategies, and training. The number of budget measures that considered GBA Plus at a later stage (17 per cent) is marginally higher than previously reported trends.
Timing of GBA Plus matters, as attested by the recent findings and recommendations in the 2022 Office of the Auditor General and 2023 Senate Committee on Social Affairs, Science and Technology Reports on GBA Plus, which emphasized the importance of conducting GBA Plus early in the policy development process. Such a consistent and timely approach helps ensure that all funding decisions are made with an understanding of how diverse groups of Canadians will be affected.
In addition to helping fill gaps in analysis, WAGE provides support to the broader gender budgeting process through capacity building and supporting GBA Plus Focal Points, who in turn contribute their expertise to their home organizations. Budget 2024 benefited from WAGE expertise and that of the broader GBA Plus community of practice, helping to ensure that government departments leveraged disaggregated data, relevant research, and the insights of diverse people who are experts through experience, as part of the development of budget proposals.
GBA Plus Responsive Approaches
Responsive Approaches
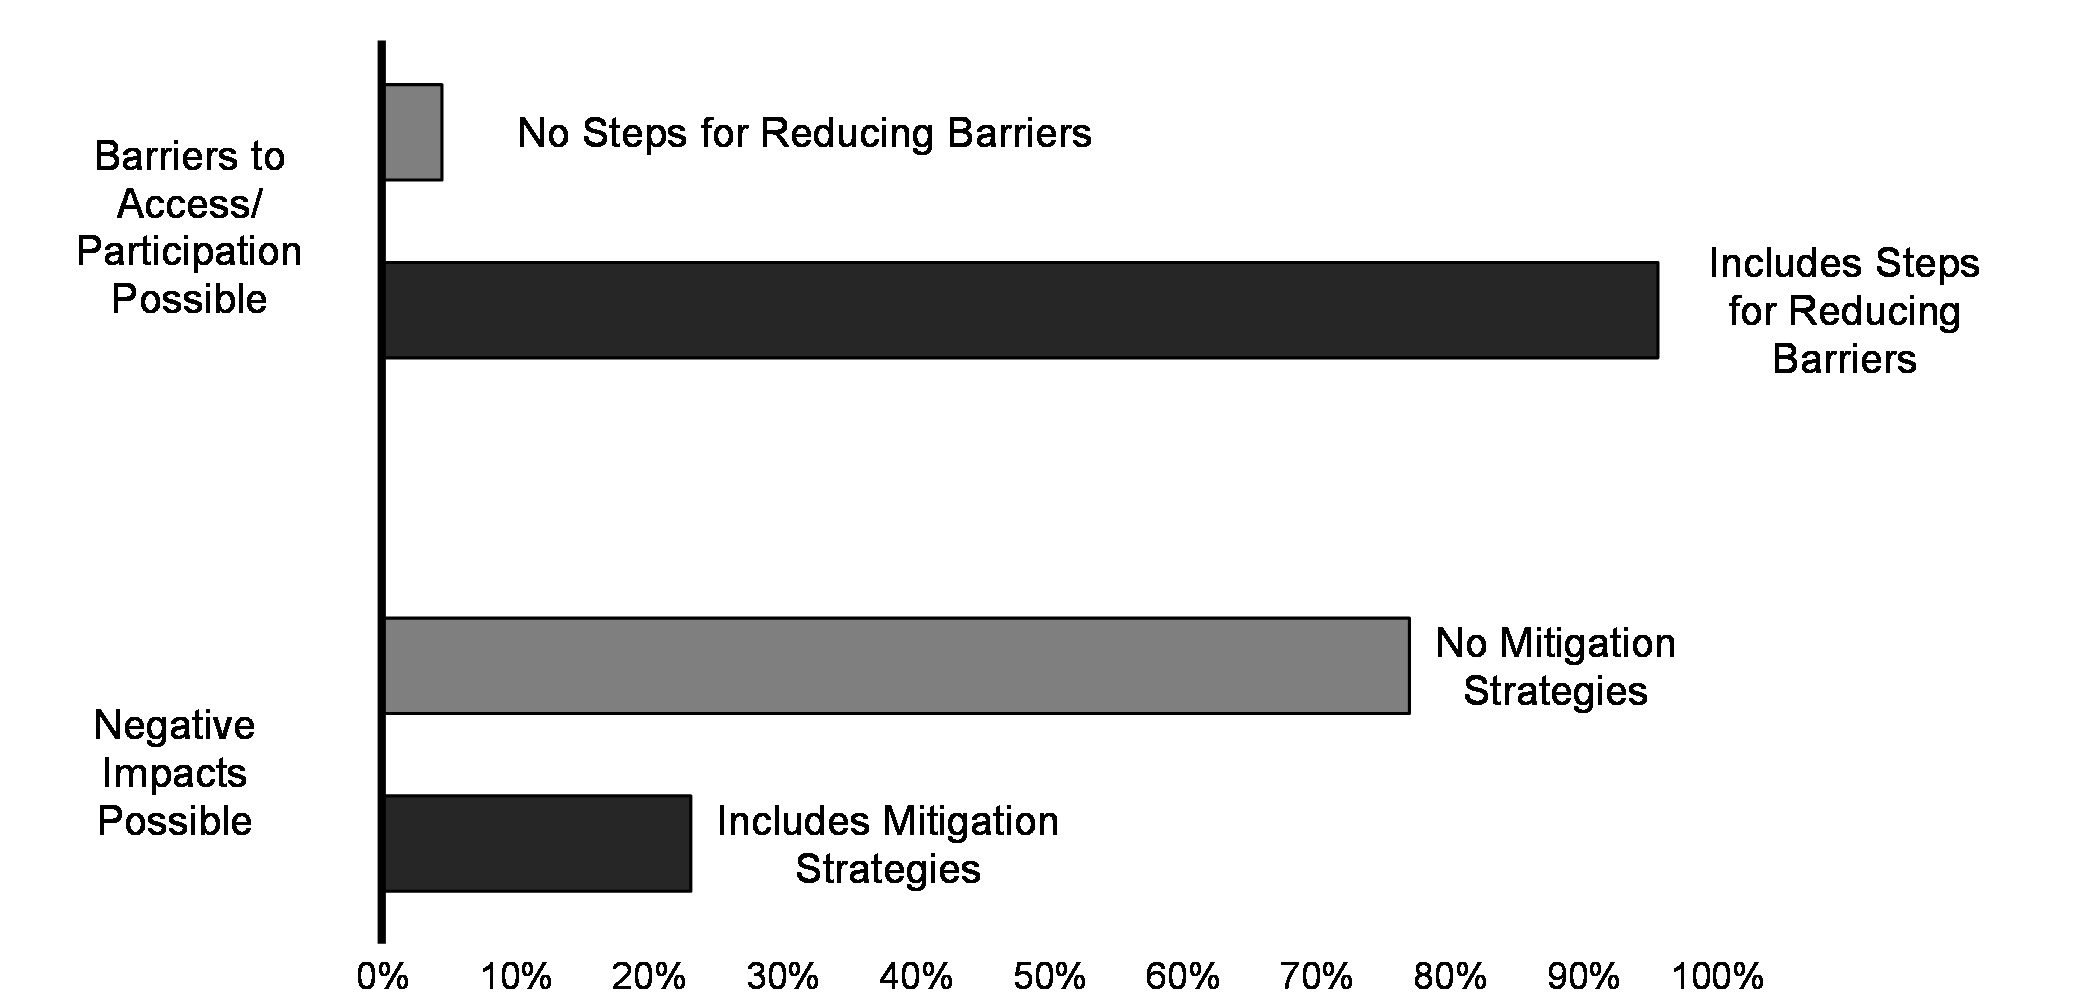
In Budget 2024, 16 per cent of measures identified a potential barrier to access or participation for a specific demographic group. For most measures that identified a barrier (96 per cent), a responsive approach was developed to improve access or help remove the barrier. Like previous budgets, barriers tend to emerge around thematic areas such as geography, access to technology, and participation of underrepresented groups in sectors that have been traditionally dominated by men. Examples of barriers and responsive actions in Budget 2024 include:
- Funding for Addressing Homelessness and Encampments may be difficult to access for people in rural or remote areas, who experience or are at risk of homelessness, as they may not live in communities that would be pre-selected based on population data. To mitigate this, Reaching Home provides funding through a Rural and Remote Homelessness funding stream. In addition, funding to address encampments will be available on an application basis, for communities or organizations that demonstrate an existing need in the area that they serve.
- Maintaining a Robust Arctic Presence will take specific actions to increase the participation of women and Indigenous people in the program. These include the implementation of equity, diversity, and inclusion criteria for project vetting, and funding that would be set aside for Indigenous Knowledge projects, led by local communities.
- While A Single Sign-In Portal for Government Services aims to reduce burdens on various Canadians in accessing government services, there may still be some Canadians who are unable to use digital services for a variety of reasons. This includes people who cannot afford to use personal computing devices, have limited technological knowledge, seniors who have lower reported usage of the internet, or people living in rural and remote areas where there is either a lack of access to reliable internet or poor connectivity. To respond to these diverse circumstances, Canadians would still have access to existing service delivery approaches such as in-person service and service by mail.
Budget 2024 also includes measures that proactively included a GBA Plus responsive approach, in anticipation of barriers/negative impacts emerging. As an example, to further strengthen Further Actions on Predatory Lending, the government will be implementing measures to enhance enforcement, to provide additional protection for borrowers under the Criminal Code. Additionally, the government would also work closely with provinces and territories to explore best practices on measures that reduce financial stress for low-income Canadians. First Nations Emergency Management and Preparedness would ensure that programming is flexible, culturally sensitive, responsive to the unique strengths and customs of First Nations communities, and adaptive to the evolving challenges resulting from emergency events. In a similar vein, the Family Violence Prevention Program would also include actions to help ensure that when Indigenous women, girls and 2SLGBTQQIA people access shelters or transitional housing, that these supports are without cultural barriers.
Target Population
Share of Budget 2024 Investments by Target Population
($ value of measures*)
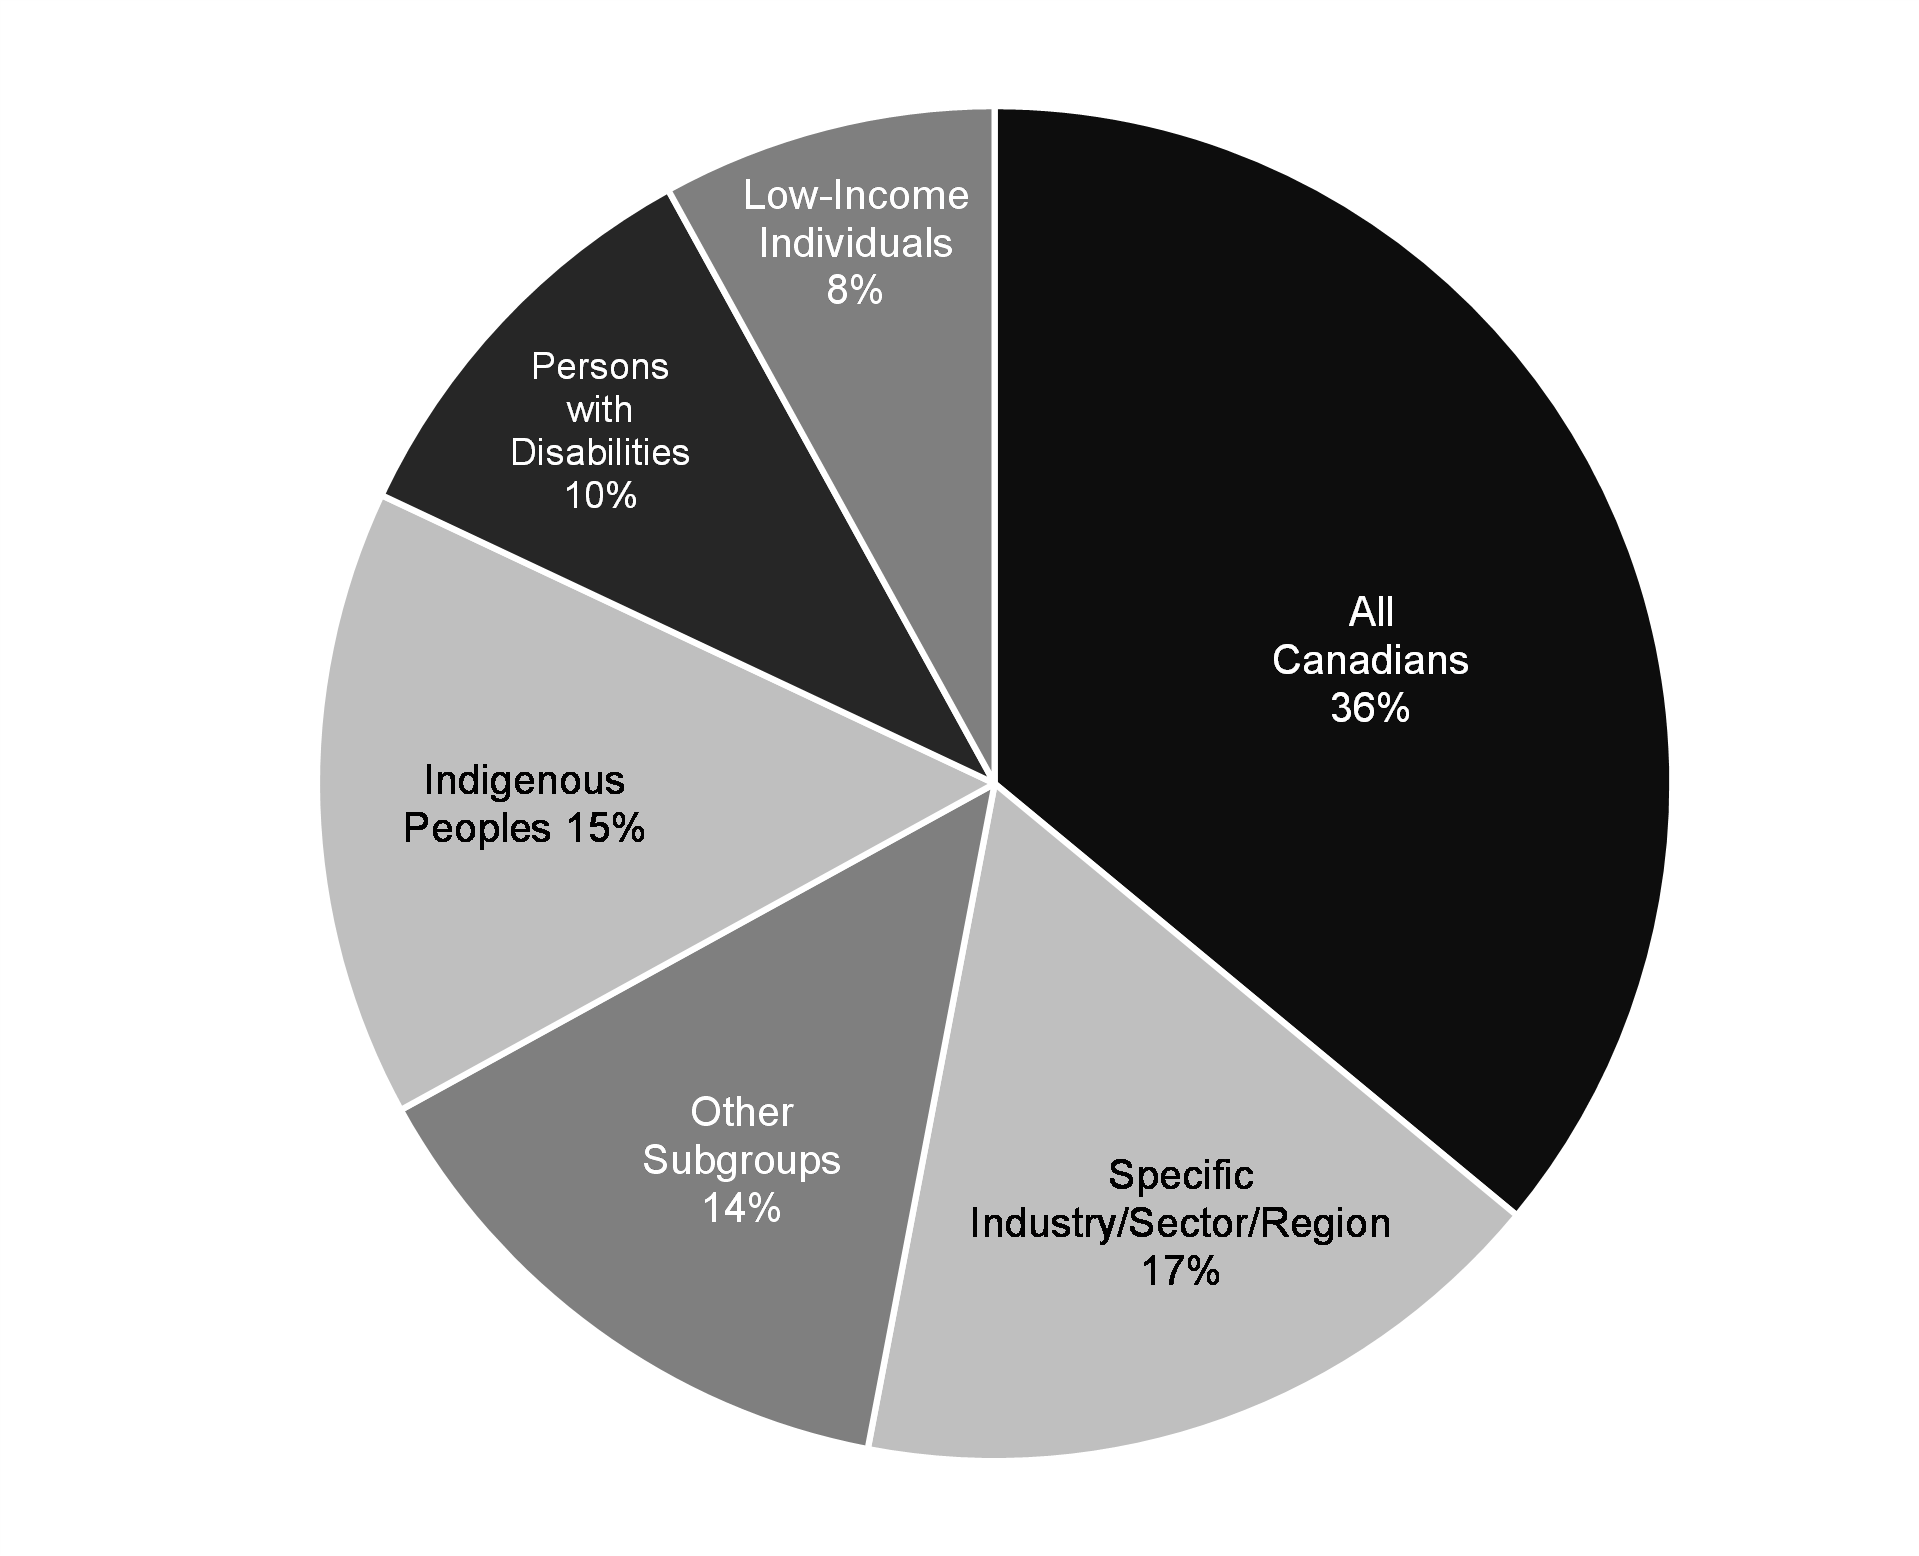
Budget 2024 considers the needs of the diverse Canadian population, to ensure that budgetary decisions are underpinned with an equity focus. Over a third (36 per cent) of the Budget 2024 measures are targeted at all Canadians, while the remaining share is targeted at specific groups.
Indigenous measures account for 15 per cent of targeted Budget 2024 investments. This is largely driven by the On-Reserve Income Assistance , which would help cover daily living costs and provides access to employment supports, for primarily low-income people and persons with disabilities living on-reserve, who are predominantly First Nations. As well, there are also targeted investments in First Nation K-12 Education and First Nation Post-Secondary Education, to provide high-quality and culturally appropriate education for First Nations students, including students with disabilities. For working-age (18 to 64) persons with disabilities, the Canada Disability Benefit will help remove financial barriers facing this group. As an example, working-age persons with disabilities experience poverty at about twice the rate as working-age persons without disabilities. The share of Budget 2024 investments targeted at persons with disabilities is about 10 per cent.
The Low-Income Individuals and Other Subgroups category, which account for 8 per cent and 14 per cent of Budget 2024 investments respectively, includes groups such as low-income people, single-parent households, Black and racialized people, and newcomers. These groups are overrepresented amongst those facing core housing need, which is targeted through measures such as the Canada Rental Protection Fund, Federal Community Housing Initiative, Apartment Construction Loan Program, and Affordable Housing Fund Program. As well since low-income groups are more likely to experience food insecurity, measures like A National School Food Program and Strengthening Local Food Security are expected to benefit these groups proportionally more than others.
The share of investments that targets Specific Industries, Sectors and Regions accounts for 17 per cent of investments in Budget 2024. These include sectors such as construction, and industries related to arts and culture, and media.
Expected Benefits: Gender
Share of Budget 2024 Investments by Gender
($ value of measures*)
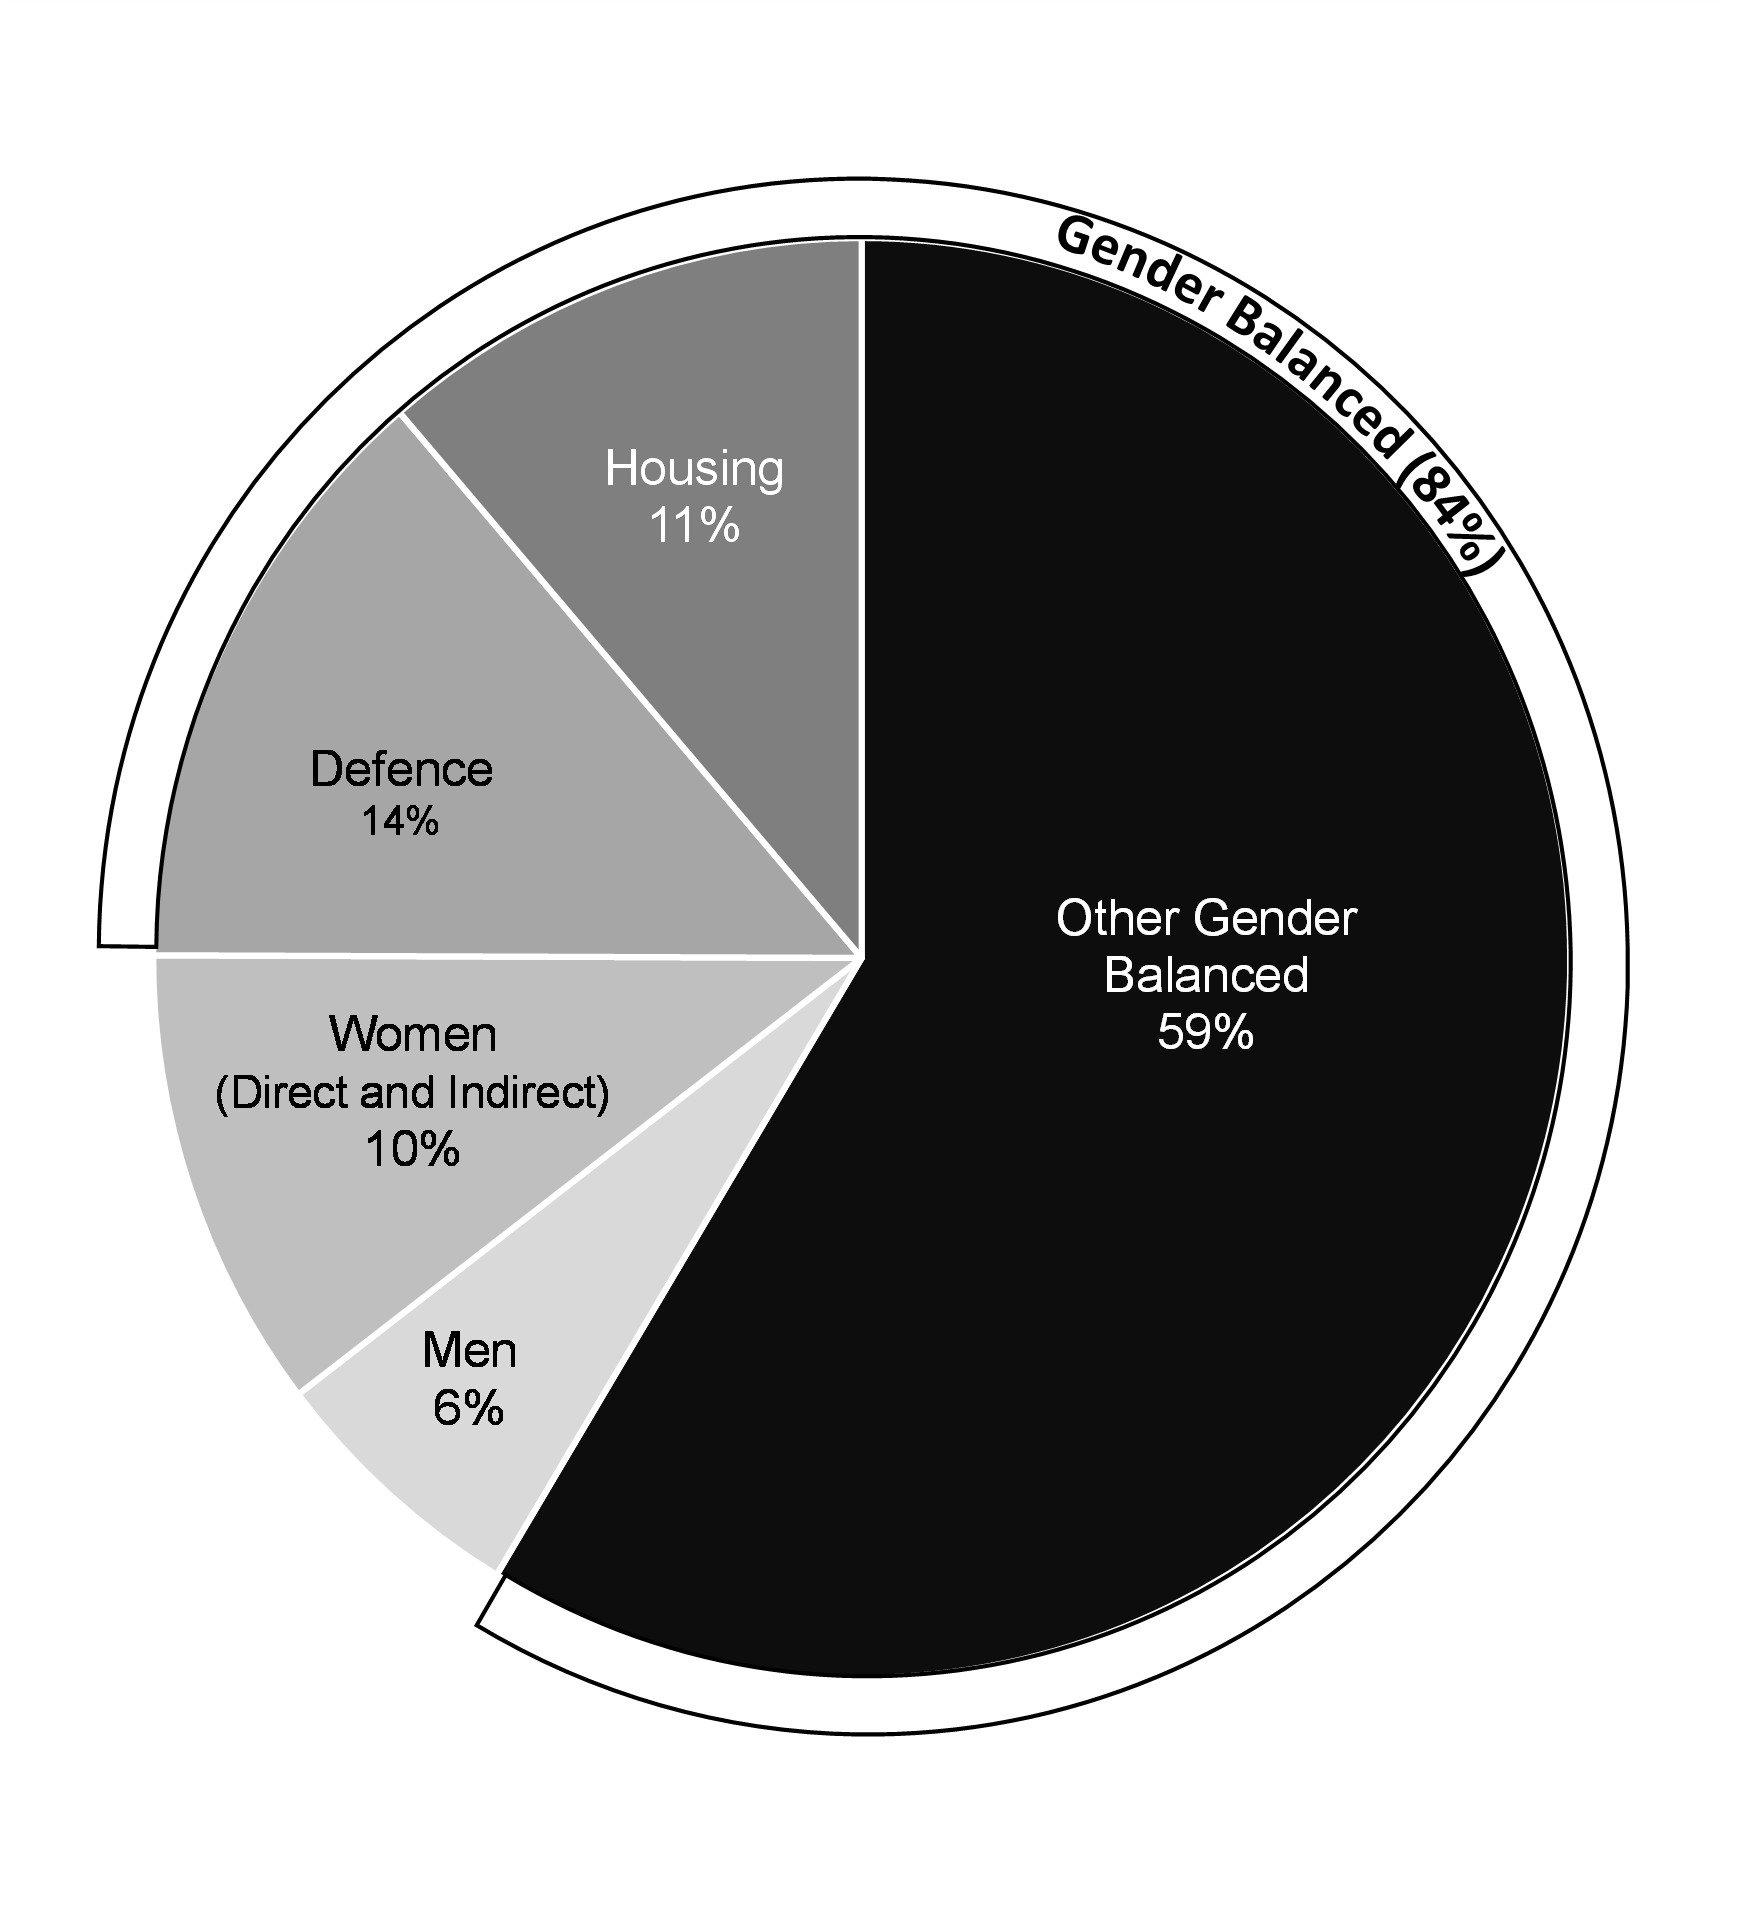
A significant share of measures (84 per cent) in Budget 2024 are considered "gender balanced"—that is, they are not expected to disproportionately benefit either men or women. As an example, the new Canada Disability Benefit would equally benefit women and men, as well as gender-diverse people with disabilities. Similarly, Indigenous-focused investments such as On-Reserve Income Assistance and Maintaining Non-Insured Health Benefits do not have differentiated impacts for different genders. The share of investments that are gender balanced is also largely driven by support for defence-related and housing measures. All men, women, and other gender-diverse people stand to benefit from a safe and secure Canada. Similarly, men, women, and gender-diverse people all stand to benefit from a safe and affordable place to call home.
The share of Budget 2024 measures that directly and indirectly benefit women is about 10 per cent. As an example, launching a National Pharmacare Plan expected to disproportionately benefit women through improved access to contraception, which has been attributed to higher educational attainment, narrowing the gender pay gap, and lowering the poverty rate among women. Young women account for 60 per cent of financial aid recipients and would therefore receive disproportionate benefits from Increasing Student Grants and Loans. For women who are older, but still aspire to upskill, Helping People Return to School would provide them with the supports that they need. Indigenous women tend to face higher levels of vulnerability compared to non-Indigenous women. As an example, Indigenous women, children, and 2SLGBTQQIA people are more likely to face barriers when accessing health programs and services. Women would therefore disproportionately benefit from investments in Supporting Indigenous Mental Health and Addressing Anti-Indigenous Racism in Health Care.
Women also indirectly benefit from measures such as Addressing Homelessness and Encampments, as homeless support workers are needed, and these workers are predominantly women. As another example, Indigenous women would indirectly benefit from investments in Renewing First Nations Core Governance and New Fiscal Relationship Funding, as the programming for this measure will include a responsive approach to help ensure that women and other underrepresented groups achieve higher levels of representation across Indigenous governments. In other occupations where women are underrepresented such as Red Seals trades, there is evidence that gender imbalances could be gradually improving over time. As an example, the share of newly certified women in some Red Seal trades traditionally dominated by men (e.g., carpentry, electrical) has grown significantly since 2015. The share of newly certified women in the carpentry and electrical trades has increased from 1.6 per cent to 3.5 per cent and from 2.5 per cent to 3.9 per cent, respectively, since 2015.
The share of measures that directly benefit men 6 per cent reflects their overrepresentation in incidences of homelessness, the criminal justice system, and immigration detention. When unpacked from an intersectional lens, the data shows that these are men who are most likely to suffer economic disadvantage, and are more likely to be Indigenous, Black and racialized, newcomers, and increasingly have mental health disabilities. Some of the Budget 2024 measures that directly benefit men include Addressing Homelessness and Encampments and Criminal Justice Legal Aid.
Expected Benefits: Additional Characteristics
Direct and Indirect Benefits by Subgroup, Number of Measures
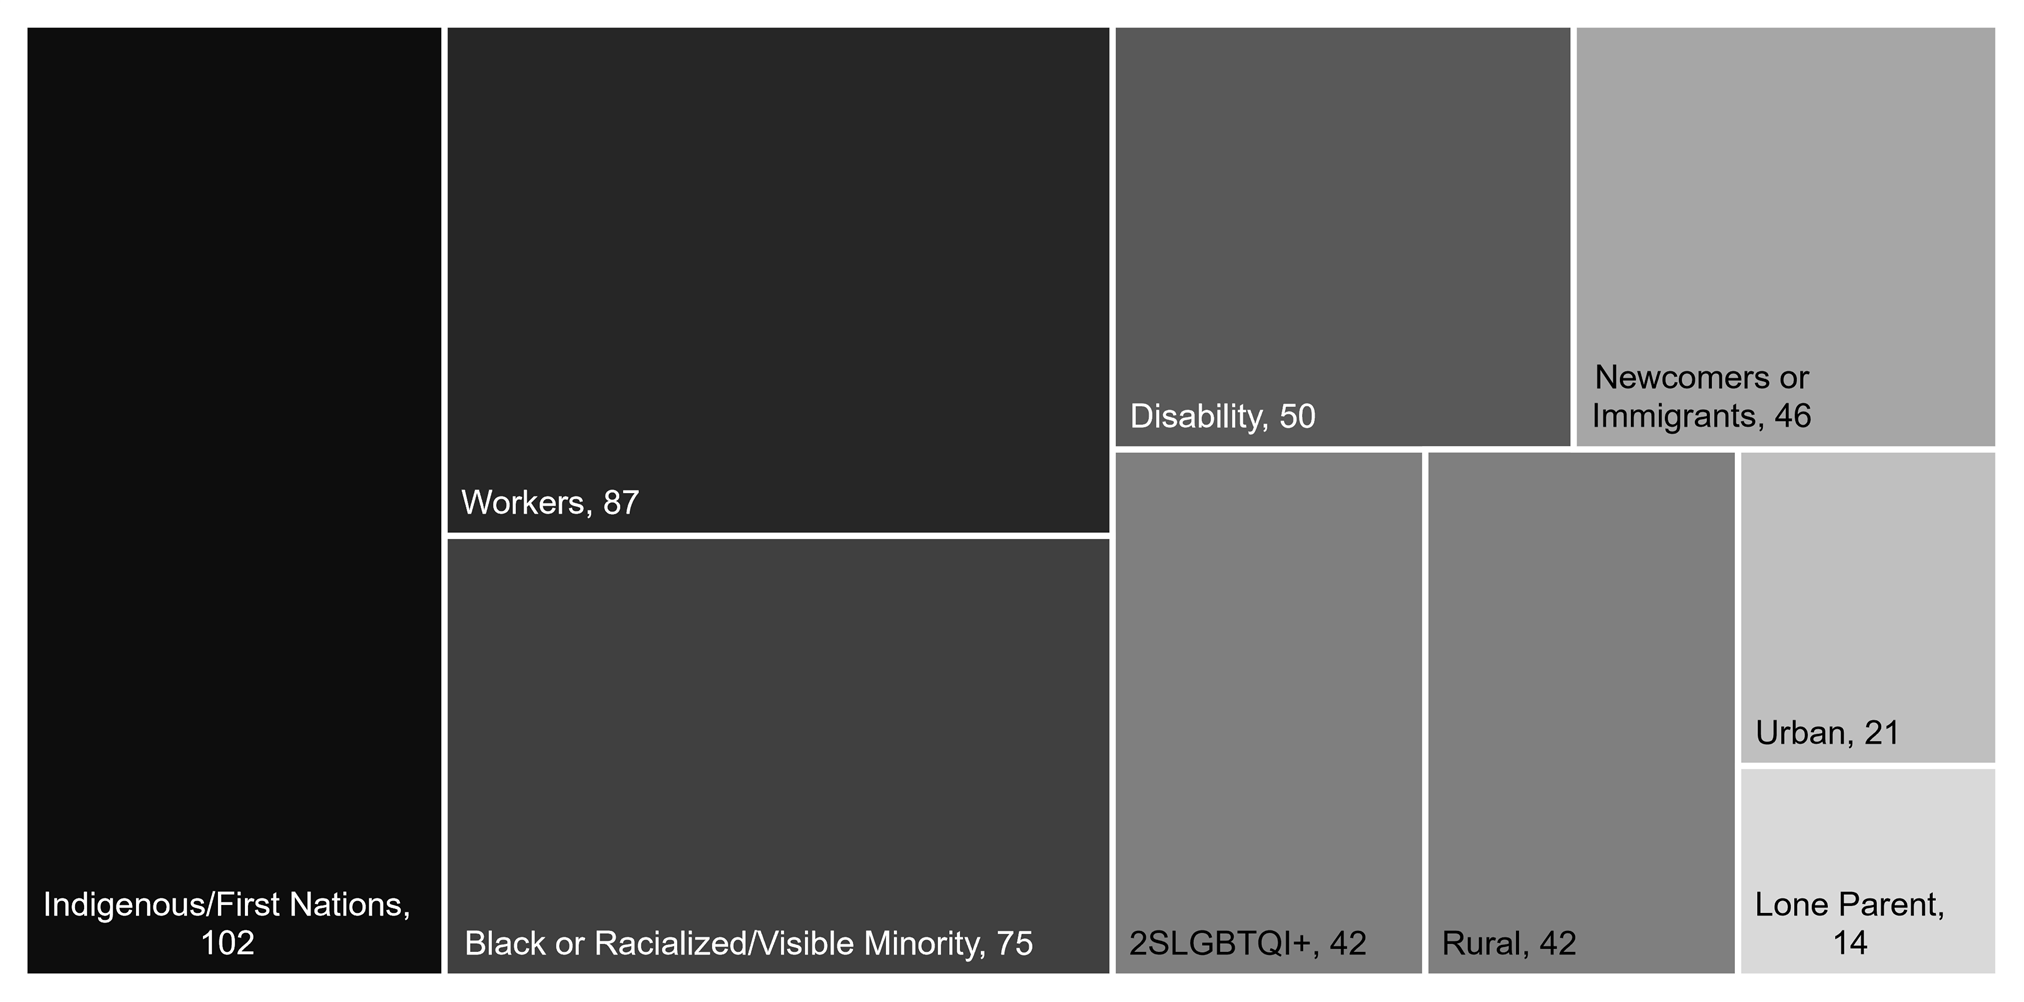
An assessment of direct and indirect impacts indicates that Budget 2024 measures would benefit diverse Canadians and address a range of needs.
Housing measures are targeted at those populations that are overrepresented in the statistics related to core housing need. Measures such as the Protecting and Expanding Affordable Housing, Keeping Non-Profit and Co-op Homes Affordable, Building Apartments, Bringing Rents Down, and Enhancing the Affordable Housing Fund would therefore benefit a range of populations, with intersecting identity factors such as single-parent households, urban dwellers, Black and racialized people, and newcomers.
Rurality can often act as an invisible barrier. Budget 2024 makes strategic investments in helping ensure that rural and remote populations are not negatively impacted by economic, social, or even environmental harms. Indigenous people are also more likely to be located in rural and remote areas. Measures such as enhanced funding for First Nations and Inuit-Led Policing will help ensure that Indigenous communities, including remote and rural communities, receive policing services that meet their unique needs.
Budget 2024 also benefits a diverse profile of workers, across a range of sectors, who are needed to support the prosperity of the Canadian economy. As an example, investments in the More Affordable Child Care would benefit workers who are predominantly women, as this group makes up approximately 96 per cent of people employed in the child care sector. Workers who are younger would benefit from the Jobs and Skills Training for Gen Z and Helping Students Gain Work Experience , giving them the opportunity to gain meaningful work experience, which is important during early career development. High-skilled workers would benefit from Securing the Canadian Biofuels Industry , which spans clean technology development, manufacturing, fuel transportation, construction, utilities, and feedstock production. Workers in transportation-related industries would also benefit from Reliable Transportation in Atlantic Canada, Small Craft Harbours , and the Transportation Security Clearance Program , which are important investments to support the movement of people and goods in Canada. For the federal public service, An Accessible, Diverse, Equitable, and Inclusive Federal Public Service would continue work to address barriers in federal public service workplaces, particularly for persons with disabilities. Cumulatively, the measures that benefit workers either directly or indirectly ensure that the diversity of talent and skills in Canada is adequately supported.
Income Distribution Impacts
Expected Income Distribution Benefits
($ value of measures*)
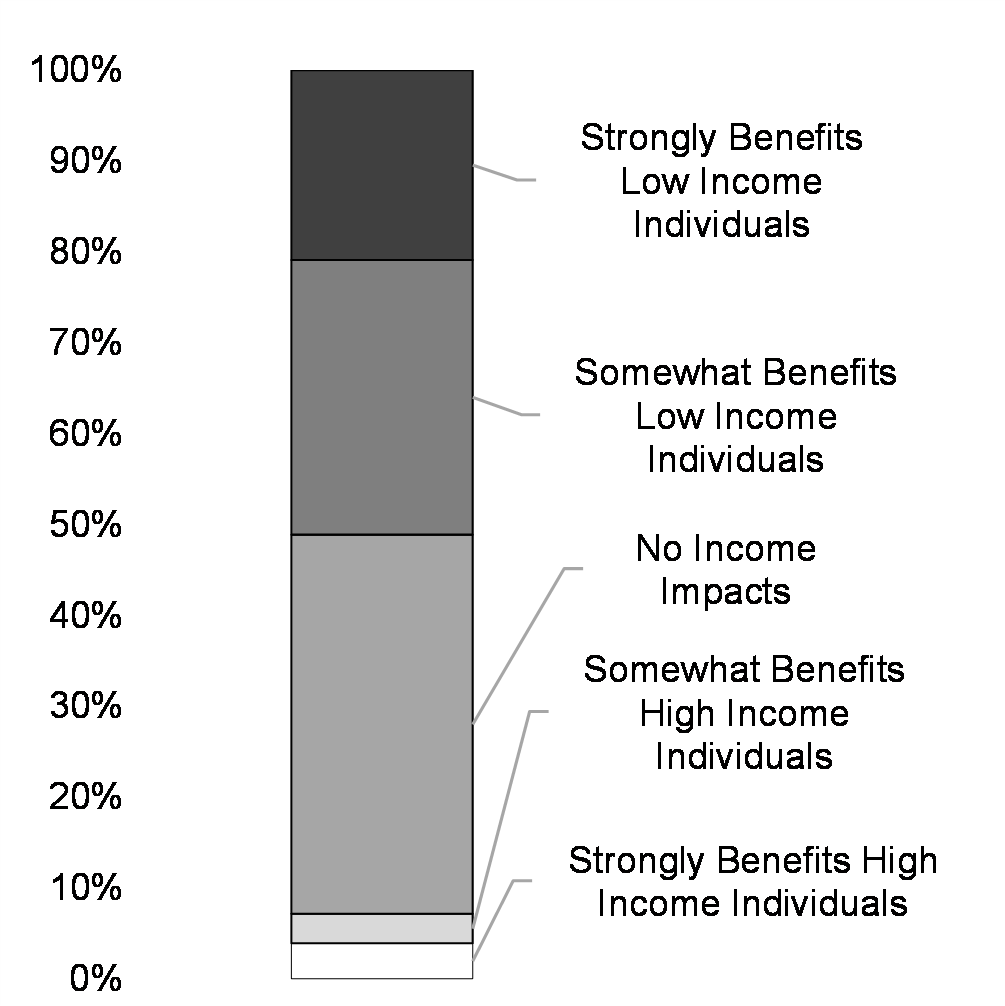
A substantial proportion of measures in Budget 2024 (about 50 per cent) will benefit lower-income Canadians.
Vulnerable groups that would disproportionately benefit from Budget 2024 investments include Indigenous people, newcomers, and persons with disabilities. For example, the Canada Disability Benefit would benefit working-age (18-64) persons with disabilities, and particularly those living in deep poverty.
As another example, measures such as First Nations and Inuit Health would benefit First Nations and Inuit populations, especially those who are lower-income, as they tend to face higher barriers in accessing health programming and services, while On-Reserve Income Assistance would also primarily benefit low-income Indigenous people , living on-reserve.
Newcomers, specifically those who are asylum claimants, would benefit from Sheltering Asylum Claimants which would help asylum claimants in need of safe and stable transitional housing support.
Intergenerational Impacts
Expected Intergenerational Impacts
($ value of measures*)
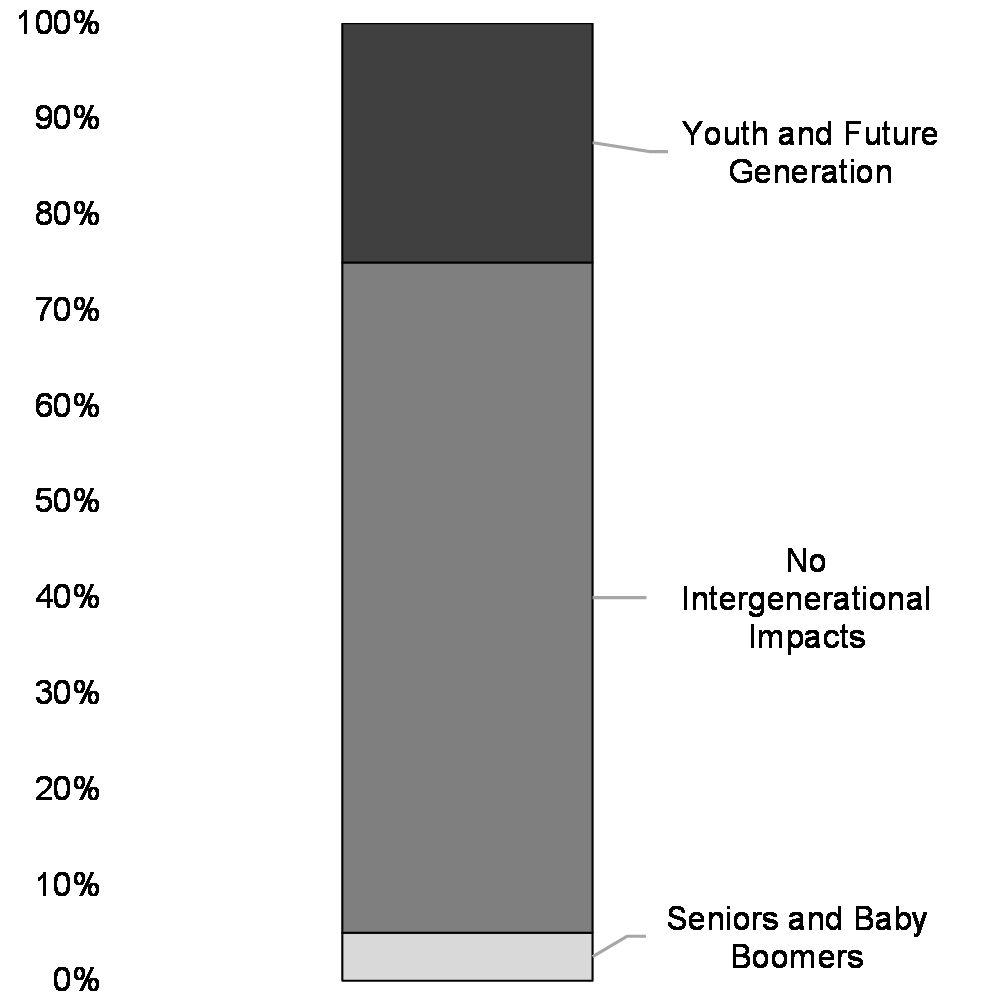
While the majority of new Budget 2024 measures are expected to carry benefits for Canadians across all generations, a sizeable share of investments responds to a changing Canadian population—baby boomers are getting older, and immigration is boosting numbers amongst younger generations—by making key investments to help ensure a good quality of life for all Canadians, particularly young people.
At least a quarter of new investments in Budget 2024 are expected to benefit youth and future generations. Key drivers include wide-ranging supports for schooling, entrepreneurial activities, development of digital skills, and reduction of barriers for workplace skills and training. Several measures also provide targeted supports for Indigenous youth. Most of the investments in youth and future generations have implications for the Gender Results Framework—which means that they are sizeable in both scope and reach, to move the needle on gender equality outcomes. The investments in young people in this budget reflect an awareness of targeted supports for diverse young people, and those at different stages in their transition to early adulthood.
Millennials and Gen Z, who are particularly affected by housing issues, such as renting at higher rates than older generations, stand to benefit the most from increased investments in housing. While these measures will take some time to see results materialize, young people will in particular reap these benefits in their lifetimes.
As an example, First Nations K-12 Education and First Nations Post-Secondary Education is targeted at First Nations' children, youth, and communities, to help ensure that Indigenous students have more opportunities to access post-secondary education, given that they experience significantly lower levels of educational attainment relative to the non-Indigenous youth population. Indigenous children and youth also benefit from supports for Indigenous culture and language, which are central to identity, belonging, and cultural preservation for future generations.
Considering that improved access to nutrition is also associated with improved learning outcomes, this budget is making investments in A National School Food Program, to help ensure that Canadian children are given more opportunities to succeed in the classroom.
Budget 2024 also prioritizes giving young people the skills and opportunities needed to thrive in the labour market. Increasingly, digital skills can unlock further economic and educational opportunities for young people—as an example, the ability to engage in online learning, develop the necessary skills for new jobs in emerging industries, or even work remotely. The government's previous investments in Coding Skills for Kids have to date helped reach 4.5 million young people, and Budget 2024 will advance the next stage of the program to reach even more young people in Canada. Budget investments also support helping young people develop the skills and experiences needed to successfully transition into the labour market. As an example, programs such as the Helping Students Gain Work Experience would provide post-secondary students with work experience related to their field of study, while the Jobs and Skills Training for Gen Z also emphasizes specific programming for young people facing multiple barriers to employment, including persons with disabilities. In addition, Empowering Young Entrepreneurs would empower young people, including Indigenous entrepreneurs.
Among measures that predominantly benefit seniors, the Old Age Security (OAS) remains the government's largest program. OAS payments are indexed to inflation, and the program is projected to deliver $80.6 billion to more than seven million seniors this year. There would also be disproportionate benefits for seniors through Expanding the Disability Supports Deduction, as those over the age of 60 accounted for more than 30 per cent of claimants in 2021.
Budget 2024 recognizes the complexity of challenges facing Canadians in their various life stages, as well the hopes people may have, whether that is a safe, secure retirement, or the opportunity to learn new skills, land that dream job or even start a business. In this regard, Budget 2024 offers strategic investments to help ensure that no generation is left behind.
Page details
- Date modified: