
Archived - Annex 1:
Details of Economic and Fiscal Projections
Economic Projections
The average of private sector forecasts has been used as the basis for economic and fiscal planning since 1994. This helps ensure objectivity and transparency, and introduces an element of independence into the government’s economic and fiscal forecast. The economic forecast presented in this section is based on a survey conducted in March 2021.
The March survey includes the views of 13 private sector economists:
- BMO Capital Markets,
- Caisse de dépôt et placement du Québec,
- CIBC World Markets,
- The Conference Board of Canada,
- Desjardins,
- IHS Markit,
- Industrial Alliance Insurance and Financial Services Inc.,
- Laurentian Bank Securities,
- National Bank Financial Markets,
- Royal Bank of Canada,
- Scotiabank,
- TD Bank Financial Group, and
- The University of Toronto (Policy and Economic Analysis Program).
Private sector economists expect real gross domestic product (GDP) to rebound from a contraction of 5.4 per cent in 2020 to growth of 5.8 per cent in 2021 and 4 per cent in 2022, a faster recovery than the growth rates of, respectively, 4.8 per cent and 3.2 per cent projected in the November 2020 Fall Economic Statement (FES 2020). This improved outlook reflects stronger-than-expected results in the last quarter of 2020, and higher projected growth starting in the second quarter of this year due to a faster anticipated rollout of vaccines (Table A1.1 below). Real GDP growth is expected to moderate to about 2 per cent on average per year over the remaining years of the forecast horizon, reflecting a return to trend long-run growth rates.
Along with the faster recovery in economic activity, the unemployment rate is expected to decline from its peak of 9.6 per cent in 2020 to 8 per cent in 2021 and 6.5 per cent in 2022, a faster projected decline than in FES 2020. The unemployment rate is expected to reach 5.9 per cent by 2025.
The outlook for GDP inflation (the broadest measure of economy-wide price inflation) in the March 2021 survey has also been revised up for 2021 compared to FES 2020 forecast (from 2.2 per cent to 3.3 per cent) reflecting better-than-expected results in the second half of 2020 and upward forecast revisions in the first quarter of 2021, in part attributable to higher oil prices. Going forward, GDP inflation is expected to stand at about 2 per cent per year.
As a result of these developments, the level of nominal GDP (the broadest measure of the tax base) is projected at $2,408 billion for 2021, $68 billion higher than projected in FES 2020 (but still $75 billion lower than projected in the Economic and Fiscal Update 2019). The nominal GDP level difference with FES 2020 is expected to average about $70 billion per year over the 2020-2025 period.
While the outlook for the short-term interest rate is broadly similar to FES 2020 projection, forecasts for the long-term interest rate have been revised up in the March 2021 survey by about 40 basis points over the 2020-2025 period compared to FES 2020 forecast.
| 2020 | 2021 | 2022 | 2023 | 2024 | 2025 | 2020- 2025 | |
|---|---|---|---|---|---|---|---|
| Real GDP growth1 | |||||||
Fall Economic Statement 2020 |
-5.5 | 4.8 | 3.2 | 2.3 | 2.1 | 1.9 | 1.5 |
Budget 2021 |
-5.4 | 5.8 | 4.0 | 2.1 | 1.9 | 1.8 | 1.7 |
| GDP inflation1 | |||||||
Fall Economic Statement 2020 |
0.1 | 2.2 | 2.0 | 2.0 | 2.1 | 2.1 | 1.7 |
Budget 2021 |
0.8 | 3.3 | 2.0 | 2.0 | 2.1 | 2.0 | 2.0 |
| Nominal GDP growth1 | |||||||
Fall Economic Statement 2020 |
-5.4 | 7.0 | 5.3 | 4.4 | 4.3 | 4.0 | 3.3 |
Budget 2021 |
-4.6 | 9.3 | 6.0 | 4.0 | 4.0 | 3.8 | 3.8 |
| Nominal GDP level (billions of dollars)1 | |||||||
Fall Economic Statement 2020 |
2,186 | 2,340 | 2,465 | 2,572 | 2,682 | 2,789 | |
Budget 2021 |
2,204 | 2,408 | 2,553 | 2,657 | 2,763 | 2,869 | |
Difference between Fall Economic Statement 2020 and Budget 2021 |
18 | 68 | 89 | 84 | 81 | 79 | 70 |
| 3-month treasury bill rate | |||||||
Fall Economic Statement 2020 |
0.4 | 0.2 | 0.3 | 0.5 | 1.1 | 1.5 | 0.7 |
Budget 2021 |
0.4 | 0.1 | 0.2 | 0.5 | 1.1 | 1.6 | 0.7 |
| 10-year government bond rate | |||||||
Fall Economic Statement 2020 |
0.7 | 0.9 | 1.2 | 1.6 | 2.0 | 2.4 | 1.5 |
Budget 2021 |
0.7 | 1.5 | 1.8 | 2.1 | 2.5 | 2.7 | 1.9 |
| Exchange rate (US cents/C$) | |||||||
Fall Economic Statement 2020 |
74.2 | 76.1 | 76.6 | 77.9 | 78.9 | 79.2 | 77.2 |
Budget 2021 |
76.6 | 79.4 | 79.8 | 80.8 | 81.0 | 81.0 | 79.4 |
| Unemployment rate1 | |||||||
Fall Economic Statement 2020 |
9.8 | 8.2 | 7.1 | 6.4 | 6.1 | 6.1 | 7.3 |
Budget 2021 |
9.6 | 8.0 | 6.5 | 6.2 | 6.0 | 5.9 | 7.0 |
| Consumer Price Index inflation | |||||||
Fall Economic Statement 2020 |
0.7 | 1.7 | 1.9 | 2.0 | 2.1 | 2.1 | 1.7 |
Budget 2021 |
0.7 | 2.2 | 2.0 | 2.1 | 2.1 | 2.1 | 1.9 |
| U.S. real GDP growth | |||||||
Fall Economic Statement 2020 |
-4.3 | 3.7 | 3.3 | 2.6 | 2.2 | 2.0 | 1.6 |
Budget 2021 |
-3.5 | 6.0 | 4.3 | 2.2 | 1.9 | 1.8 | 2.1 |
| West Texas Intermediate crude oil price ($US per barrel) | |||||||
Fall Economic Statement 2020 |
39 | 46 | 52 | 54 | 58 | 59 | 51 |
Budget 2021 |
39 | 60 | 61 | 60 | 60 | 60 | 57 |
| Note: Forecast averages may not equal average of years due to rounding. Numbers may not add due to rounding. 1 Figures have been restated to reflect the historical revisions in the Canadian System of National Accounts and in the Labour Force Survey. Sources: Statistics Canada; for the Fall Economic Statement 2020, Department of Finance Canada September 2020 survey of private sector economists; for the Budget 2021, Department of Finance Canada March 2021 survey of private sector economists. |
|||||||
Fiscal Projections
Changes to the Fiscal Outlook since the 2020 Fall Economic Statement (FES 2020)
| Projection | |||||||||
|---|---|---|---|---|---|---|---|---|---|
| 2020-2021 | 2021-2022 | 2022-2023 | 2023-2024 | 2024-2025 | 2025-2026 | ||||
| Budgetary balance – FES 2020 (before stimulus) | -381.6 | -121.2 | -50.7 | -43.3 | -30.9 | -24.9 | |||
Economic and fiscal developments since FES2020 (Table A1.3) |
35.2 | 15.8 | 19.3 | 16.0 | 12.8 | 10.3 | |||
| Budgetary balance before policy actions and investments | -346.4 | -105.4 | -31.4 | -27.3 | -18.1 | -14.6 | |||
Policy actions since FES 2020 |
0.2 | 0.3 | 0.9 | -1.1 | -0.7 | -0.3 | |||
| Investments in Budget 2021 (by chapter) | |||||||||
1. Keeping Canadians Healthy and Safe |
-5.0 | -1.2 | -1.0 | -0.9 | -0.8 | -0.7 | |||
2. Seeing Canadians and Businesses Through to Recovery |
-0.2 | -27.0 | -4.2 | -1.0 | -0.7 | 0.7 | |||
3. New Opportunities for Canadians |
-0.5 | -3.9 | -9.0 | -7.5 | -7.6 | -8.8 | |||
4. Helping Canadian Businesses Grow and Succeed |
0.0 | -3.7 | -4.5 | -5.0 | -2.4 | -0.8 | |||
5. A Healthy Environment for a Healthy Economy |
0.0 | -1.2 | -1.9 | -2.0 | -1.8 | -1.9 | |||
6. Strengthening the Cities and Communities We Call Home |
-2.2 | -4.6 | -3.3 | -2.3 | -2.0 | -3.1 | |||
7. A More Equal Canada |
0.0 | -1.8 | -1.6 | -2.1 | -2.2 | -2.4 | |||
8. Strong Indigenous Communities |
0.0 | -4.3 | -3.5 | -3.0 | -1.3 | -1.0 | |||
9. Protecting Our Shared Values |
-0.1 | -1.9 | -1.1 | -0.7 | -0.5 | -0.4 | |||
10. Responsible Government |
0.0 | -0.2 | 0.7 | 1.8 | 2.4 | 2.5 | |||
| Total – Actions since FES 2020 and Budget 2021 Investments | -7.7 | -49.3 | -28.3 | -23.8 | -17.7 | -16.1 | |||
| Budgetary balance | -354.2 | -154.7 | -59.7 | -51.0 | -35.8 | -30.7 | |||
Budgetary balance (%GDP) |
-16.1 | -6.4 | -2.3 | -1.9 | -1.3 | -1.1 | |||
Federal Debt (%GDP) |
49.0 | 51.2 | 50.7 | 50.6 | 50.0 | 49.2 | |||
| Note: FES 2020 Escalated Restrictions Scenario and $100 billion stimulus | |||||||||
Budgetary balance |
-398.7 | -166.7 | -109.6 | -71.7 | -39.4 | -33.4 | |||
Budgetary balance (%GDP) |
-18.2 | -7.3 | -4.5 | -2.9 | -1.5 | -1.2 | |||
Federal Debt (%GDP) |
51.4 | 56.4 | 58.1 | 58.5 | 57.6 | 56.6 | |||
Economic and Fiscal Developments since FES 2020
| Projection | ||||||||
|---|---|---|---|---|---|---|---|---|
| 2020-2021 | 2021-2022 | 2022-2023 | 2023-2024 | 2024-2025 | 2025-2026 | |||
| Economic and fiscal developments by component1: | ||||||||
Change in budgetary revenues |
||||||||
(1.1) Income taxes |
11.8 | 14.5 | 13.5 | 11.9 | 11.9 | 11.9 | ||
(1.2) Excise taxes/duties |
0.2 | 1.5 | 1.8 | 1.5 | 1.3 | 1.0 | ||
(1.3) Proceeds from the pollution pricing framework |
0.3 | 0.4 | 0.3 | 0.4 | 0.3 | 0.3 | ||
(1.4) Employment Insurance premiums |
0.7 | 0.7 | 1.1 | 0.9 | 0.5 | -0.5 | ||
(1.5) Other revenues |
7.9 | 2.2 | 2.8 | 2.6 | 1.9 | 2.4 | ||
(1) Total budgetary revenues |
20.8 | 19.2 | 19.6 | 17.3 | 15.9 | 15.1 | ||
Change in program expenses |
||||||||
(2.1) Major transfers to persons |
6.3 | 2.1 | 0.0 | -0.7 | -0.9 | -1.2 | ||
(2.2) Major transfers to other levels of government |
0.1 | -4.4 | -0.4 | -1.1 | -1.2 | -1.1 | ||
(2.3) Direct program expenses |
8.2 | -2.7 | 0.2 | 2.4 | 1.8 | 1.0 | ||
(2) Total program expenses, excluding net actuarial losses |
14.6 | -5.0 | -0.2 | 0.6 | -0.3 | -1.3 | ||
(3) Net actuarial losses |
0.0 | 3.4 | 3.3 | 2.9 | 2.1 | 1.5 | ||
(4) Public debt charges |
-0.1 | -1.8 | -3.3 | -4.8 | -4.9 | -5.0 | ||
(5) Total economic and fiscal developments |
35.2 | 15.8 | 19.3 | 16.0 | 12.8 | 10.3 | ||
| 1 A negative number implies a deterioration in the budgetary balance (lower revenues or higher expenses). A positive number implies an improvement in the budgetary balance (higher revenues or lower expenses). | ||||||||
Budgetary revenues, particularly income tax revenues, have been revised up relative to FES 2020. In the near-term, this is driven by the faster-than-expected economic recovery in the second half of 2020. Over the longer-term, an improvement in the outlook for the labour market, personal income and corporate profitability drive revisions to personal and corporate income tax revenues.
- Because more people will be working, and earning more, income tax revenues are projected to be $11.8 billion higher in 2020-21 due to strong year-to-date results, and up on average by more than $12 billion per year over the forecast horizon.
- Excise taxes and import duty revenues have been revised upwards in large part due to an upward revision to Goods and Services Tax (GST) revenues, reflecting a stronger outlook for consumption.
- Proceeds from the federal pollution pricing framework that arise from the provinces and territories that are a part of the federal backstop are projected to be marginally higher reflecting an improved economic outlook. These proceeds will continue to be fully returned: primarily through Climate Action Incentive payments to eligible individuals and families in Alberta, Manitoba, Ontario and Saskatchewan and through a transfer to the governments of Yukon and Nunavut.
- Employment Insurance (EI) premium revenues have been revised up due to better-than-expected labour force participation and an improved outlook for economy-wide wage growth.
- Other revenues, such as those resulting from sales of goods and services, investments and loans, interest and penalties, and Crown corporations’ net profits, are projected to be much higher in 2020-21 than expected at the time of FES 2020. This improvement is primarily due to better-than-expected financial performance by enterprise Crown corporations, and lower-than-expected premiums paid by the Bank of Canada in the course of its secondary market purchases of Government of Canada securities to support liquidity in financial markets. Upward revisions in future years largely reflect an improved outlook for enterprise Crown corporations profits, including income on increased asset balances held by the Bank of Canada.
Program expenses, particularly major transfers to persons and direct program expenses, are projected to be significantly lower in 2020-21 relative to FES 2020, largely reflecting the revised timing and re-estimation of the cost of COVID-response programs, such as the Canada Emergency Response Benefit.
- Over the remainder of the forecast horizon, adjustments to major transfers to persons reflect the impact of higher expected inflation, to which children’s and elderly benefits rates are indexed.
- Major transfers to other levels of government are higher in 2021-22, reflecting a revised preliminary estimate of potential Fiscal Stabilization payments. In the outer years of the forecast, expenses have been revised upwards, as a result of the stronger economic outlook as the Canada Health Transfer and Equalization payments are indexed to growth in nominal GDP.
- Direct program expenses, which include pollution pricing proceeds returned, other transfer payments administered by departments, and departmental operating expenses, have been adjusted downward in 2020-21 and upward in 2021-22, largely due to the revised timing of COVID program expenses. Over the horizon, direct program expenses are revised downward, driven by lower anticipated pension and benefits current service costs, and slightly lower departmental spending projections.
Net actuarial losses, which represent changes in the measurement of the government’s obligations for pensions and other employee future benefits accrued in previous fiscal years, are expected to be lower relative to FES 2020, reflecting upward revisions to projected long term interest rates used to value the obligations.
Public debt charges have increased to reflect higher expected interest costs on interest-bearing debt due to higher interest rates, and a revised financial requirement. Despite these developments, public debt charges remain on a sustainable long-term path and are $1.6 billion lower in 2022-23 than was forecast in the 2019 Economic and Fiscal Update (forecast of $27.3 billion at that time), before the onset of COVID. This is in spite of the substantial increase in federal debt as a result of the pandemic.
Summary Statement of Transactions
| Projection | |||||||
|---|---|---|---|---|---|---|---|
| 2019–2020 | 2020–2021 | 2021–2022 | 2022–2023 | 2023–2024 | 2024–2025 | 2025–2026 | |
| Budgetary revenues | 334.1 | 296.2 | 355.1 | 377.9 | 396.4 | 417.9 | 437.7 |
Program expenses, excluding net actuarial losses |
338.5 | 614.5 | 475.6 | 403.0 | 409.2 | 414.4 | 426.7 |
Public debt charges |
24.4 | 20.4 | 22.1 | 25.7 | 30.5 | 35.4 | 39.3 |
| Total expenses, excluding net actuarial losses | 362.9 | 634.9 | 497.6 | 428.7 | 439.7 | 449.8 | 466.0 |
| Budgetary balance before net actuarial losses | -28.8 | -338.8 | -142.5 | -50.9 | -43.4 | -31.9 | -28.3 |
Net actuarial losses |
-10.6 | -15.4 | -12.2 | -8.9 | -7.7 | -3.9 | -2.4 |
| Budgetary balance | -39.4 | -354.2 | -154.7 | -59.7 | -51.0 | -35.8 | -30.7 |
| Financial Position | |||||||
Total liabilities |
1,248.6 | 1,648.4 | 1,799.7 | 1,858.3 | 1,928.0 | 1,983.1 | 2,025.3 |
Financial assets1 |
435.7 | 472.4 | 466.2 | 459.6 | 473.6 | 488.8 | 496.8 |
Net debt |
812.9 | 1,176.0 | 1,333.6 | 1,398.8 | 1,454.4 | 1,494.3 | 1,528.6 |
Non-financial assets |
91.5 | 96.9 | 99.8 | 105.3 | 109.9 | 114.0 | 117.6 |
| Federal debt | 721.4 | 1,079.0 | 1,233.8 | 1,293.5 | 1,344.5 | 1,380.3 | 1,411.0 |
| Per cent of GDP | |||||||
Budgetary revenues |
14.5 | 13.4 | 14.7 | 14.8 | 14.9 | 15.1 | 15.3 |
Program expenses, excluding Net Actuarial losses |
14.6 | 27.9 | 19.7 | 15.8 | 15.4 | 15.0 | 14.9 |
Public debt charges |
1.1 | 0.9 | 0.9 | 1.0 | 1.1 | 1.3 | 1.4 |
Budgetary balance |
-1.7 | -16.1 | -6.4 | -2.3 | -1.9 | -1.3 | -1.1 |
Federal debt |
31.2 | 49.0 | 51.2 | 50.7 | 50.6 | 50.0 | 49.2 |
| Note: Totals may not add due to rounding.
1 The projected level of financial assets for 2020-21 includes an estimate of other comprehensive income. |
|||||||
Outlook for Budgetary Revenues
| Projection | |||||||
|---|---|---|---|---|---|---|---|
| 2019– 2020 |
2020– 2021 |
2021– 2022 |
2022– 2023 |
2023– 2024 |
2024– 2025 |
2025– 2026 |
|
| Income taxes | |||||||
Personal income tax |
167.6 | 168.2 | 180.4 | 187.5 | 195.5 | 204.0 | 213.5 |
Corporate income tax |
50.1 | 46.2 | 50.3 | 52.8 | 56.7 | 62.9 | 66.8 |
Non-resident income tax |
9.5 | 8.5 | 9.9 | 10.6 | 11.0 | 11.3 | 11.7 |
Total income tax |
227.1 | 222.9 | 240.5 | 251.0 | 263.2 | 278.1 | 291.9 |
| Excise taxes/duties | |||||||
Goods and Services Tax |
37.4 | 29.8 | 41.0 | 43.6 | 45.2 | 46.7 | 48.2 |
Customs import duties |
4.9 | 3.7 | 4.5 | 4.9 | 5.1 | 5.4 | 5.8 |
Other excise taxes/duties |
11.6 | 10.5 | 11.7 | 12.4 | 12.7 | 12.8 | 12.9 |
Total excise taxes/duties |
53.9 | 44.0 | 57.1 | 60.9 | 63.0 | 64.9 | 66.9 |
Digital Services Tax |
0.0 | 0.2 | 0.7 | 0.8 | 0.8 | 0.9 | |
| Total tax revenues | 281.0 | 266.9 | 297.8 | 312.5 | 326.9 | 343.8 | 359.7 |
Proceeds from the pollution pricing framework1 |
2.7 | 4.5 | 6.4 | 7.9 | 8.0 | 7.9 | 7.9 |
Employment Insurance premium revenues |
22.2 | 22.2 | 23.7 | 25.4 | 27.3 | 29.2 | 31.2 |
| Other revenues | |||||||
Enterprise Crown corporations |
5.1 | -13.9 | 7.1 | 10.2 | 10.7 | 11.7 | 12.5 |
Other programs |
20.8 | 14.2 | 18.5 | 19.9 | 21.2 | 22.6 | 23.4 |
Net foreign exchange |
2.4 | 2.2 | 1.7 | 1.9 | 2.2 | 2.6 | 3.0 |
Total other revenues |
28.3 | 2.6 | 27.3 | 32.0 | 34.2 | 36.9 | 38.9 |
| Total budgetary revenues | 334.1 | 296.2 | 355.1 | 377.9 | 396.4 | 417.9 | 437.7 |
| Per cent of GDP | |||||||
Total tax revenues |
12.2 | 12.1 | 12.4 | 12.2 | 12.3 | 12.4 | 12.5 |
Proceeds from the pollution pricing framework |
0.1 | 0.2 | 0.3 | 0.3 | 0.3 | 0.3 | 0.3 |
Employment Insurance premium revenues |
1.0 | 1.0 | 1.0 | 1.0 | 1.0 | 1.1 | 1.1 |
Other revenues |
1.2 | 0.1 | 1.1 | 1.3 | 1.3 | 1.3 | 1.4 |
Total budgetary revenues |
14.5 | 13.4 | 14.7 | 14.8 | 14.9 | 15.1 | 15.3 |
| Note: Totals may not add due to rounding. 1 This represents those charges applied through the federal backstop, excluding the Output Based Pricing System. All these proceeds will be returned to their province/territory of origin through Climate Action Incentive payments and other climate supports. |
|||||||
Table A1.5 sets out the government’s projection for budgetary revenues.
Personal income tax (PIT) revenues – the largest component of budgetary revenues – are projected to increase to $168.2 billion in 2020-21, or 0.4 per cent. This limited growth reflects the negative impact of the COVID-19 crisis on household incomes, partly compensated by measures put in place by the government to support income. PIT revenues are expected to rebound to $180.4 billion in 2021-22 as employment levels recover. For the remainder of the forecast, PIT revenue growth is expected to return to an average of 4.3 per cent, in line with projected nominal GDP growth.
Corporate income tax (CIT) revenues are projected to decrease by 7.6 per cent, to $46.2 billion in 2020-21. The decline is driven by lower corporate profitability and general economic weakness due to the impact of COVID-19. Starting 2021-22, CIT is expected to rebound and grow at an average rate of 7.6 per cent per year through to the end of the forecast horizon, reflecting the outlook for corporate profitability.
Non-resident income tax revenues are income taxes paid by non-residents on Canadian-sourced income, notably dividends and interest payments. These revenues are expected to decrease to $8.5 billion in 2020-21, or 10.7 per cent, as corporate profits and investment income were hit by the economic impacts of the crisis, before rebounding to $9.9 billion in 2021-22. From 2022-23 on, growth is expected to return to an average of 4.3 per cent.
GST revenues are forecast to fall to $29.8 billion in 2020-21, or 20.3 per cent, reflecting the temporary shutdown of large portions of the retail sector and the introduction of the one-time enhanced GST credit payment, before increasing to $41 billion in 2021-22, or 37.4 per cent. Over the remainder of the projection period, GST revenues are forecast to grow by 4.1 per cent per year, on average, reflecting the outlook for taxable consumption.
Customs import duties are projected to fall from $4.9 billion in 2019-20 to $3.7 billion in 2020-21, or 22.8 per cent, due to lower imports and the government’s waiver of customs duties on medical goods in order to better combat the spread of COVID-19, before rebounding to $4.5 billion in 2021-22, or 19.8 per cent. Over the remainder of the horizon, customs import duties are projected to grow at an average annual rate of 6.4 per cent due to expected growth in imports.
Other excise taxes and duties (OETD) are projected to decline to $10.5 billion in 2020-21, or 10.2 per cent, primarily reflecting lower air travel security surcharge and excise tax revenue from motive fuels as a result of decreased demand since the onset of the pandemic. OETD revenues are expected to increase to $11.7 billion in 2021-22, or 11.4 per cent, as demand recovers, and over the remainder of the projection period, are expected to grow at an average annual rate of 2.7 per cent, reflecting projected underlying consumption growth.
The new digital services tax (DST) is expected to be in effect as of January 1, 2022. DST revenues are projected to be $0.2 billion in 2021-22, and rise to $0.9 billion by 2025-26.
In 2020-21, EI premium revenues are projected to remain unchanged at $22.2 billion. Over the remainder of the projection horizon, premium revenues are anticipated to grow at an average annual rate of 7.1 per cent, largely due to the current outlook for the labour market, the end of the currently planned two-year freeze in premium rates as of 2023, and the return to a premium rate structure under current legislation that balances accumulated spending in the account over seven years. The current forecast anticipates a gradual increase in premium rates, beginning in 2023, from $1.58 to $1.83 per $100 insurable earnings by the end of the horizon. This would result in a premium rate that is still lower than the peak level of rates at $1.88 following the 2008-09 recession. The government will continue to review premium rates following the results of its consultations on future EI reforms over the course of the next year and where the labour market stands further on in the recovery.
Other revenues consist of three broad components: net income from enterprise Crown corporations; other program revenues from returns on investments, proceeds from the sales of goods and services, and other miscellaneous revenues; and revenues in the Exchange Fund Account.
Enterprise Crown corporation revenues are projected to decrease by $18.9 billion in 2020-21 and increase by $21 billion in 2021-22, before growing thereafter at an average annual rate of 15.2 per cent. These projections reflect the outlooks presented in corporate plans of respective enterprise Crown corporations, including the impact of COVID-19 on profits, and the impact of Bank of Canada programs introduced during COVID-19, including purchases of Government of Canada securities on the secondary market to support liquidity in financial markets.
Other program revenues are affected by consolidated Crown corporation revenues, interest rates, inflation and exchange rate movements (which affect the Canadian-dollar value of foreign-denominated assets). These revenues are projected to decline by 31.5 per cent or $6.6 billion in 2020-21, primarily due to a decline in interest and penalty revenue of $2.7 billion and return on investments of $1.3 billion as a result of lower interest rates and interest and penalty waivers provided as part of the government’s COVID-19 response, along with a $1.6 billion projected decline in revenue from sales of goods and services. Over the remainder of the forecast horizon, these revenues are projected to grow at an average annual rate of 10.4 per cent, largely as a result of growth in revenue from return on investments and interest and penalty revenue.
Net foreign exchange revenues, which consist mainly of returns on investments held in the Exchange Fund Account, are volatile and sensitive to fluctuations in foreign exchange rates and foreign interest rates. These revenues are projected to decrease in 2020-21 due mainly to lower interest rates.
Employment Insurance Operating Account
| 2019- 2020 |
2020- 2021 |
2021- 2022 |
2022- 2023 |
2023- 2024 |
2024- 2025 |
2025- 2026 |
|||
|---|---|---|---|---|---|---|---|---|---|
EI premium revenues |
22.2 | 22.2 | 23.7 | 25.4 | 27.3 | 29.2 | 31.2 | ||
EI benefits1 |
21.8 | 33.5 | 41.2 | 28.1 | 24.5 | 24.9 | 25.6 | ||
EI administration and other expenses2 |
2.0 | 2.1 | 2.1 | 2.2 | 2.0 | 1.9 | 1.9 | ||
| 20193 | 2020 | 2021 | 2022 | 2023 | 2024 | 2025 | (…) | 2028 | |
EI Operating Account annual balance |
2.1 | -6.3 | -21.9 | -6.1 | -0.7 | 2.2 | 3.8 | 6.5 | |
EI Operating Account cumulative balance |
5.9 | -0.3 | -22.2 | -28.3 | -29.0 | -26.8 | -22.9 | -4.44 | |
Projected premium rate (per $100 of insurable earnings) |
1.62 | 1.58 | 1.58 | 1.58 | 1.63 | 1.68 | 1.73 | 1.83 | |
| 1 EI benefits include regular EI benefits, sickness, maternity, parental, compassionate care, fishing and work sharing benefits, and employment benefits and support measures. EI benefits exclude EI-Emergency Response Benefit costs as these will not be recovered via EI premiums in line with the Government’s commitment to credit the EI Operating Account.
2 The remaining EI costs relate mainly to administration and are included in direct program expenses. 3 Values for 2019 are actual data. Values for 2020 and future years are a projection. 4 The EI Operating Account cumulative balance does not reach exactly zero at the end of the seven-year period as projected EI rates are rounded to the nearest whole cent per $100 of insurable earnings, in accordance with the Employment Insurance Act. In addition, the positive deficit amount in 2028 reflects the cost of new support measures that are not fully recovered due to the 5-cent limit on premium rate increases. |
|||||||||
The Employment Insurance Operating Account operates within the Consolidated Revenue Fund. As such, EI-related revenues and expenses that are credited and charged to the Account, respectively, in accordance with the Employment Insurance Act, are consolidated with those of the government, and impact the budgetary balance. For consistency with the EI premium rate, which is set on a calendar-year basis with the objective of having the Account break even over time, the annual and cumulative balances of the Account are also presented on a calendar-year basis.
The EI Operating Account is expected to record annual deficits from 2020 to 2023 as a result of the increase in EI benefits (excluding the Emergency Response Benefit) and the temporary freeze on EI premiums through 2022. The Account is then projected to record annual surpluses starting in 2024 due to projected increases in the premium rate until reaching $1.83. The increases reflect the practice of the rate-setting mechanism that started with the setting of the 2017 premium rate.
Outlook for Program Expenses
| Projection | |||||||
|---|---|---|---|---|---|---|---|
| 2019– 2020 |
2020– 2021 |
2021– 2022 |
2022– 2023 |
2023– 2024 |
2024– 2025 |
2025– 2026 |
|
| Major transfers to persons | |||||||
Elderly benefits |
56.2 | 58.8 | 62.5 | 68.0 | 72.5 | 76.7 | 81.0 |
Employment Insurance benefits1 |
21.8 | 59.8 | 41.2 | 28.1 | 24.5 | 24.9 | 25.6 |
Canada Emergency Response Benefit and Canada Recovery Benefits |
4.7 | 57.3 | 13.9 | 0.0 | 0.0 | 0.0 | 0.0 |
Canada Child Benefit2 |
24.3 | 27.6 | 27.2 | 26.3 | 26.6 | 27.2 | 27.9 |
Total |
107.1 | 203.5 | 144.8 | 122.3 | 123.7 | 128.7 | 134.4 |
| Major transfers to other levels of government | |||||||
Canada Health Transfer |
40.9 | 45.9 | 43.1 | 44.7 | 47.5 | 49.8 | 51.7 |
Canada Social Transfer |
14.6 | 15.0 | 15.5 | 15.9 | 16.4 | 16.9 | 17.4 |
Equalization |
19.8 | 20.6 | 20.9 | 21.7 | 23.1 | 24.1 | 25.1 |
Territorial Formula Financing |
3.9 | 4.2 | 4.4 | 4.6 | 4.8 | 4.9 | 5.1 |
Canada Community-Building Fund |
2.2 | 4.3 | 2.3 | 2.3 | 2.4 | 2.4 | 2.5 |
Home care and mental health |
1.1 | 1.3 | 1.5 | 1.2 | 1.2 | 1.2 | 1.2 |
Other fiscal arrangements3 |
-3.3 | 15.5 | -1.2 | -6.0 | -6.3 | -6.6 | -6.9 |
Total |
79.2 | 106.7 | 86.6 | 84.3 | 89.1 | 92.7 | 96.1 |
| Direct program expenses | |||||||
Proceeds from the pollution pricing framework returned4 |
2.6 | 4.8 | 6.9 | 8.1 | 8.3 | 7.9 | 7.9 |
Canada Emergency Wage Subsidy |
0.0 | 84.6 | 26.0 | 0.0 | 0.0 | 0.0 | 0.0 |
Canada-Wide Early Learning and Child Care5 |
0.0 | 0.0 | 3.0 | 4.5 | 5.5 | 6.5 | 7.7 |
Other transfer payments |
54.4 | 103.3 | 85.9 | 76.1 | 74.0 | 70.1 | 70.5 |
Operating expenses6 |
95.2 | 111.6 | 122.5 | 107.7 | 108.6 | 108.4 | 110.1 |
Total |
152.2 | 304.3 | 244.3 | 196.4 | 196.5 | 193.0 | 196.2 |
| Total program expenses, excluding net actuarial losses | 338.5 | 614.5 | 475.6 | 403.0 | 409.2 | 414.4 | 426.7 |
Net actuarial losses7 |
10.6 | 15.4 | 12.2 | 8.9 | 7.7 | 3.9 | 2.4 |
| Per cent of GDP | |||||||
Major transfers to persons |
4.6 | 9.2 | 6.0 | 4.8 | 4.7 | 4.7 | 4.7 |
Major transfers to other levels of government |
3.4 | 4.8 | 3.6 | 3.3 | 3.4 | 3.4 | 3.3 |
Direct program expenses |
6.6 | 13.8 | 10.1 | 7.7 | 7.4 | 7.0 | 6.8 |
Total program expenses |
14.6 | 27.9 | 19.7 | 15.8 | 15.4 | 15.0 | 14.9 |
| Note: Totals may not add due to rounding.
1 EI benefits include regular EI benefits, sickness, maternity, parental, compassionate care, fishing and work-sharing benefits, and employment benefits and support measures. Remaining EI costs relate mainly to administration and are part of operating expenses. As in FES 2020, this includes the portion of payments for the Emergency Response Benefit charged to the EI Operating Account, totalling $1.8 billion in 2019-20, and an estimated $26.3 billion in 2020-21. These costs are not projected to be recovered with higher EI premiums given the government’s commitment to credit the EI Operating account for the costs associated with the Emergency Response Benefit program. 2 Includes the Children’s disability benefits and residual payments for the Universal Child Care Benefit (UCCB), now replaced by the Canada Child Benefit. 3 Other fiscal arrangements includes the Quebec Abatement (Youth Allowances Recovery and Alternative Payments for Standing Programs); payments under the Canada-Nova Scotia Arrangement on Offshore Revenues; Fiscal Stabilization payments; and established terms for repayable floor loans. In 2020-21 this also includes COVID-19 response measures. 4 This includes the return of charges applied through the federal backstop, excluding those through the Output Based Pricing System, which are returned to their province/territory of origin through Climate Action Incentive payments and other climate supports. 5 Amounts exclude funding for Indigenous Early learning and Child Care which are included in the other transfer payments line. 6 This includes capital amortization expenses. 7 Actuarial gains and losses were previously reported as “Losses (gains) from employee future benefit plans” and as a part of Direct program expenses, but are now presented in a new line item titled Net actuarial losses since FES 2020. |
|||||||
Table A1.6 provides an overview of the projection for program expenses by major component. Program expenses consist of three main categories: major transfers to persons, major transfers to other levels of government, and direct program expenses.
Major transfers to persons consist of elderly, Employment Insurance (EI) and children’s benefits, as well as the Canada Emergency Response Benefit and Recovery Benefits.
Elderly benefits are projected to reach $58.8 billion in 2020-21, up 4.6 per cent, due to an increase in the population of seniors. Over the remainder of the horizon, elderly benefits are forecast to grow by $4.4 billion per year, on average, reflecting the ongoing demographic change, and projected consumer price inflation, to which benefits are fully indexed, as well as the planned 10 per cent increase to regular Old Age Security payments for pensioners 75 and over on an ongoing basis as of July 2022 announced in this budget.
EI benefits are projected to increase to $59.8 billion in 2020-21, largely reflecting the cost of Emergency Response Benefits ($26.3 billion) and higher unemployment resulting from the crisis. The government has committed to crediting the EI Operating Account for costs resulting from the Emergency Response Benefit, which means that they will not result in higher future EI premiums. EI benefits are expected to fall to $24.5 billion by 2023-24 as a result of the projected improvement in the labour market. After which, EI benefits are forecast to grow at an average of 2.3 per cent annually, as the unemployment rate is projected to stabilize at around 6 per cent after 2023.
The Canada Emergency Response Benefit (CERB) was introduced as part of Canada’s COVID-19 Economic Response Plan to provide immediate assistance to Canadians not eligible for EI benefits. The government is committed to continuing to support all Canadians and has introduced the Canada Recovery Benefit (CRB), the Canada Recovery Sickness Benefit (CRSB) and the Canada Recovery Caregiving Benefit (CRCB). The CERB and the Canada Recovery Benefits (CRB, CRSB and CRCB) are expected to cost $57.3 billion in 2020-21, decreasing to $13.9 billion in 2021-22 as the economy recovers and temporary programs end.
Canada Child Benefit (CCB) payments are projected to increase 13.3 per cent to $27.6 billion in 2020-21, largely reflecting temporary top up transfers. These benefits will stay close to this level for 2021-22, mainly due to the temporary support for families with young children introduced in the 2020 Fall Economic Statement, before decreasing to $26.3 billion in 2022-23 as temporary supports expire. For the period 2022‑23 to 2025-26, CCB payments are expected to grow at an average annual rate of 2 per cent, reflecting forecasted consumer price inflation to which the benefits are indexed.
Major transfers to other levels of government, which include the Canada Health Transfer (CHT), the Canada Social Transfer (CST), Equalization, Territorial Formula Financing and the Canada Community-Building Fund (formerly known as the Gas Tax Fund), among others, are expected to increase by 34.8 per cent to $106.7 billion in 2020-21, reflecting the unprecedented level of support provided to provinces and territories during the pandemic. The increase in 2020-21 is driven by previously announced COVID-19 response measures, including $4 billion for a one-time increase to the Canada Health Transfer, the $2.2 billion top-up to the Canada Community-Building Fund, and $1 billion that is being provided to assist provinces and territories with immunization campaigns.
As a result of the one-time, $4 billion increase to the CHT in 2020-21, total CHT support is $5 billion higher than in 2019-20. Beginning in 2021-22, the CHT is projected to grow from $43.1 billion to $51.7 billion in 2025-26, as it grows in line with a three-year moving average of nominal GDP growth, with funding guaranteed to increase by at least 3 per cent per year. The CST is legislated to grow at 3 per cent per year. Canada Community-Building Fund payments are indexed at 2 per cent per year, with increases applied in $100 million increments. Home care and mental health transfers are projected to be $1.3 billion in 2020‑21, stabilizing at $1.2 billion starting in 2022-23.
Direct program expenses, which include proceeds from the pollution pricing framework returned, the Canada Emergency Wage Subsidy, the Canada-Wide Early Learning and Child Care plan, other transfer payments administered by departments, and operating expenses, are expected to increase about 100 per cent to $304.3 billion in 2020‑21. The projected increase in direct program expenses is largely driven by COVID-19 response measures, including the wage subsidy, with an estimated cost of $84.6 billion in 2020-21. Direct program expenses are projected to fall to $193 billion in 2024-25. This fall is partially offset in the outer years by the new Canada-Wide Early Learning and Child Care System, which is expected to cost $3 billion in 2021-22 growing to $7.7 billion by 2025-26.
Other transfer payments administered by departments are projected to increase about 90 per cent to $103.3 billion in 2020-21, reflecting investments made to help Canadian families and businesses through the crisis. This includes the expected cost of the loan repayment incentive for the Canada Emergency Business Account $12.6 billion, and $3 billion for the Canada Emergency Student Benefit. Also contributing to the increased costs are supports for seniors through a one-time payment ($2.5 billion) provided in July 2020, and to small businesses through the Canada Emergency Commercial Rent Assistance ($1.9 billion), and through the Canada Emergency Rent Subsidy ($4.1 billion). Other transfer payments are projected to fall to $76.1 billion by 2022-23, as the economy recovers and support measures are lifted, after which they are projected to stabilize around $71.5 billion per year, on average.
Operating expenses reflect the broad range of day-to-day costs of government operations for more than 100 government departments, agencies and Crown corporations. Operating expenses are projected to increase to $111.6 billion in 2020-21, and to $122.5 billion in 2021-22. This includes spending related to the procurement of vaccines and personal protective equipment in response to the crisis. Operating expenses are projected to decrease to $107.7 billion by 2022-23, after which they are projected to grow at an average of 0.7 per cent, annually.
Net actuarial losses, which represent changes in the measurement of the government’s obligations for pensions and other employee future benefits accrued in previous fiscal years, are expected to increase to $15.4 billion in 2020-21. This increase reflects losses stemming from the 2019-20 actuarial valuations of the government’s pension and benefit plans, which are amortized to expense starting in 2020-21. These 2019-20 losses were due mainly to lower long-term interest rates used to value the obligations, as well as increased costs associated with the utilization of disability and other future benefits provided to veterans. Over the horizon, net actuarial losses are forecasted to decline reflecting the increase in projected long-term interest rates.
Financial Source/Requirement
The budgetary balance is presented on a full accrual basis of accounting, recording government revenues and expenses when they are earned or incurred, regardless of when the cash is received or paid. In contrast, the financial/source requirement measures the difference between cash coming in to the government and cash going out. This measure is affected not only by the budgetary balance, but also by the government’s non-budgetary transactions. These include changes in federal employee pension liabilities; changes in non-financial assets; investing activities through loans, investments and advances; and changes in other financial assets and liabilities, including foreign exchange activities.
| Projection | ||||||||
|---|---|---|---|---|---|---|---|---|
| 2019– 2020 |
2020– 2021 |
2021– 2022 |
2022– 2023 |
2023– 2024 |
2024– 2025 |
2025– 2026 |
||
| Budgetary balance | -39.4 | -354.2 | -154.7 | -59.7 | -51.0 | -35.8 | -30.7 | |
| Non-budgetary transactions | ||||||||
Pensions and other accounts |
10.3 | 15.8 | 11.0 | 8.7 | 7.3 | 3.4 | 1.8 | |
Non-financial assets |
-4.9 | -5.4 | -2.9 | -5.5 | -4.6 | -4.1 | -3.6 | |
Loans, investments and advances |
||||||||
Enterprise Crown corporations |
-13.5 | 1.0 | -0.3 | -5.5 | -4.7 | -5.8 | 0.9 | |
Other |
-1.7 | -32.7 | -10.6 | 19.1 | -1.8 | -1.1 | -1.3 | |
Total |
-15.1 | -31.7 | -10.9 | 13.6 | -6.6 | -6.9 | -0.4 | |
Other transactions |
||||||||
Accounts payable, receivable, accruals and allowances |
7.1 | 26.9 | -30.3 | -4.3 | -3.5 | -2.8 | -2.5 | |
Foreign exchange activities |
-5.2 | 7.9 | -2.8 | -3.9 | -4.0 | -4.1 | -3.4 | |
Total |
1.8 | 34.8 | -33.1 | -8.2 | -7.5 | -6.9 | -5.9 | |
| Total | -7.8 | 13.5 | -36.0 | 8.6 | -11.3 | -14.4 | -8.1 | |
| Financial source/requirement | -47.2 | -340.6 | -190.7 | -51.1 | -62.4 | -50.2 | -38.8 | |
As shown in Table A1.7, a financial requirement is projected in each year over the forecast horizon, largely reflecting financial requirements associated with the projected budgetary balance.
A financial source is projected for pensions and other accounts for 2020-21 to 2025-26. Pensions and other accounts include the activities of the Government of Canada’s employee pension plans and those of federally appointed judges and Members of Parliament, as well as a variety of other employee future benefit plans, such as health care and dental plans, and disability and other benefits for veterans and others. The financial source for pensions and other accounts largely reflects adjustments for pension and benefit expenses not funded in the period.
Financial requirements for non-financial assets mainly reflect the difference between cash outlays for the acquisition of new tangible capital assets and the amortization of capital assets included in the budgetary balance. They also include disposals of tangible capital assets and changes in inventories and prepaid expenses. A net cash requirement of $2.9 billion is projected for 2021-22.
Loans, investments and advances include the government’s investments in enterprise Crown corporations, including Canada Mortgage and Housing Corporation, Export Development Canada, the Business Development Bank of Canada, and Farm Credit Canada. They also include loans, investments and advances to national and provincial governments and international organizations, and under government programs, including the Canada Emergency Business Account (CEBA). The projected financial requirements for 2020-21 and 2021-22 mainly reflect the disbursement of loans under CEBA and loans advanced to enterprise Crown corporations under the consolidated borrowing framework. A financial source is projected for 2022-23, largely reflecting the expected repayment of CEBA loans. Financial requirements are projected from 2023-24 to 2025-26, reflecting retained earnings of enterprise Crown corporations, as well loans provided to Crown corporations and third-parties.
In general, loans, investments and advances are expected to generate additional revenues for the government in the form of interest or additional net profits of enterprise Crown corporations, which partly offset debt charges associated with these borrowing requirements. These revenues are reflected in projections of the budgetary balance.
Other transactions include the payment of tax refunds and other accounts payable, the collection of taxes and other accounts receivable, the conversion of other accrual adjustments included in the budgetary balance into cash, as well as foreign exchange activities. A financial source is projected for 2020-21, primarily reflecting adjustments for accrued expenses not paid in the period and non-cash exchange rate impacts. Projected cash requirements over the remainder of the forecast horizon mainly reflect the payment of accounts payable, forecast increases in the government’s official international reserves held in the Exchange Fund Account, as well as projected growth in accounts receivable, in line with historical trends.
Alternative Economic Scenarios
There is still a large amount of uncertainty regarding the ultimate path of the recovery and the eventual return to normal economic activity. The outlook continues to be shaped by the path of the virus and its variants as well as by the vaccination rollout.
At the same time, Canada’s performance through the second wave over the winter was stronger than projected in the Fall Economic Statement. Indeed, the Canadian economy was more resilient during the second wave than the initial wave, suggesting that Canadian households and businesses have adapted to operating under public health restrictions.
To illustrate the consequences of different health outcomes and the associated responses of households and businesses, the Department of Finance has considered two alternative scenarios to the projections of the private sector economists which reflect downside and upside risks to the outlook.
Scenario: Slower Recovery
In this scenario, new and more contagious variants of the virus broaden their circulation in Canada, leading to tighter restrictions on businesses vulnerable to social distancing and a delay in the reopening of borders (e.g. restaurants, shopping malls, hairdressers and other personal care) until progress on vaccination can help bring down cases more sustainably. While these restrictions would be less severe than those assumed in previous downside scenarios, activity restrictions induce Canadians to consume less and add further to their accumulated savings.
Further, this scenario assumes that vaccine supply disruptions delays the projected roll out, and assumes vaccines have less efficacy against new variants. In this scenario, getting a critical mass of Canadians vaccinated would take until the end of the year either due to the rise of new variants or some delay in getting the second dose for the two-dose vaccines, resulting in delays of the return to normality.
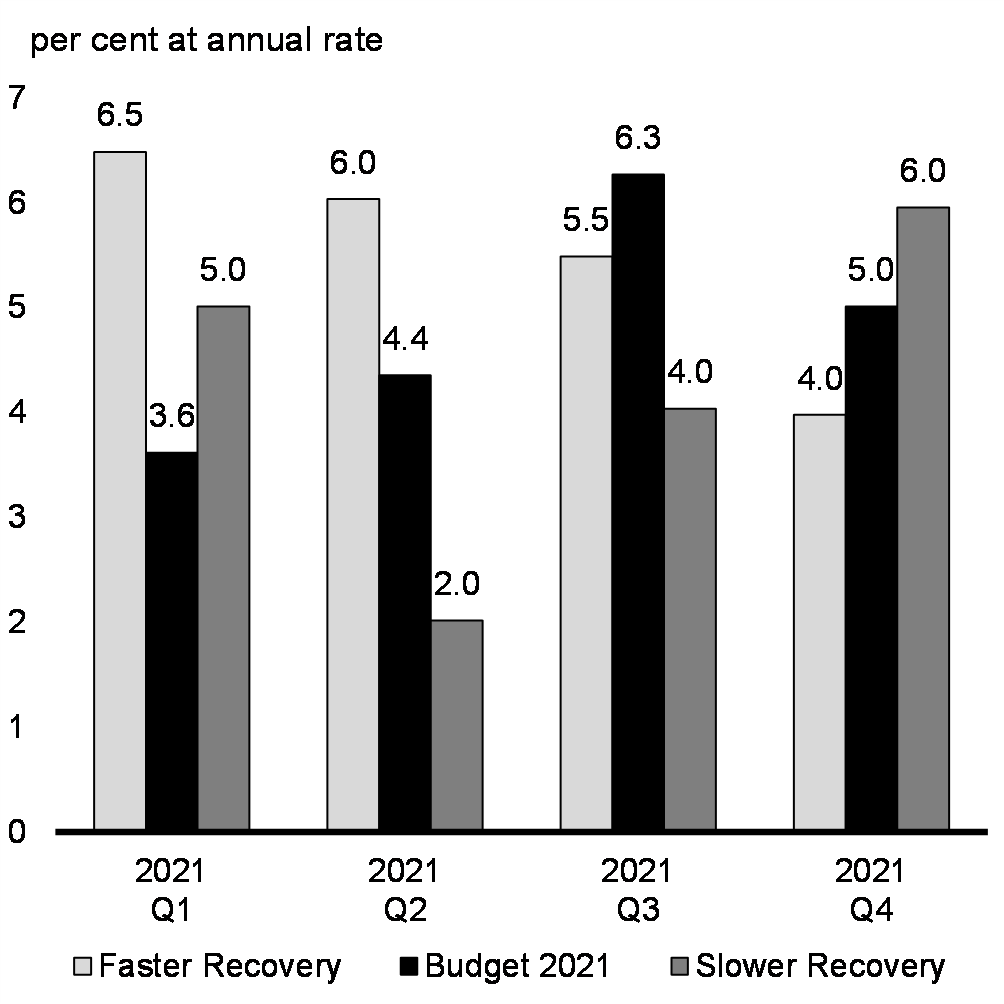
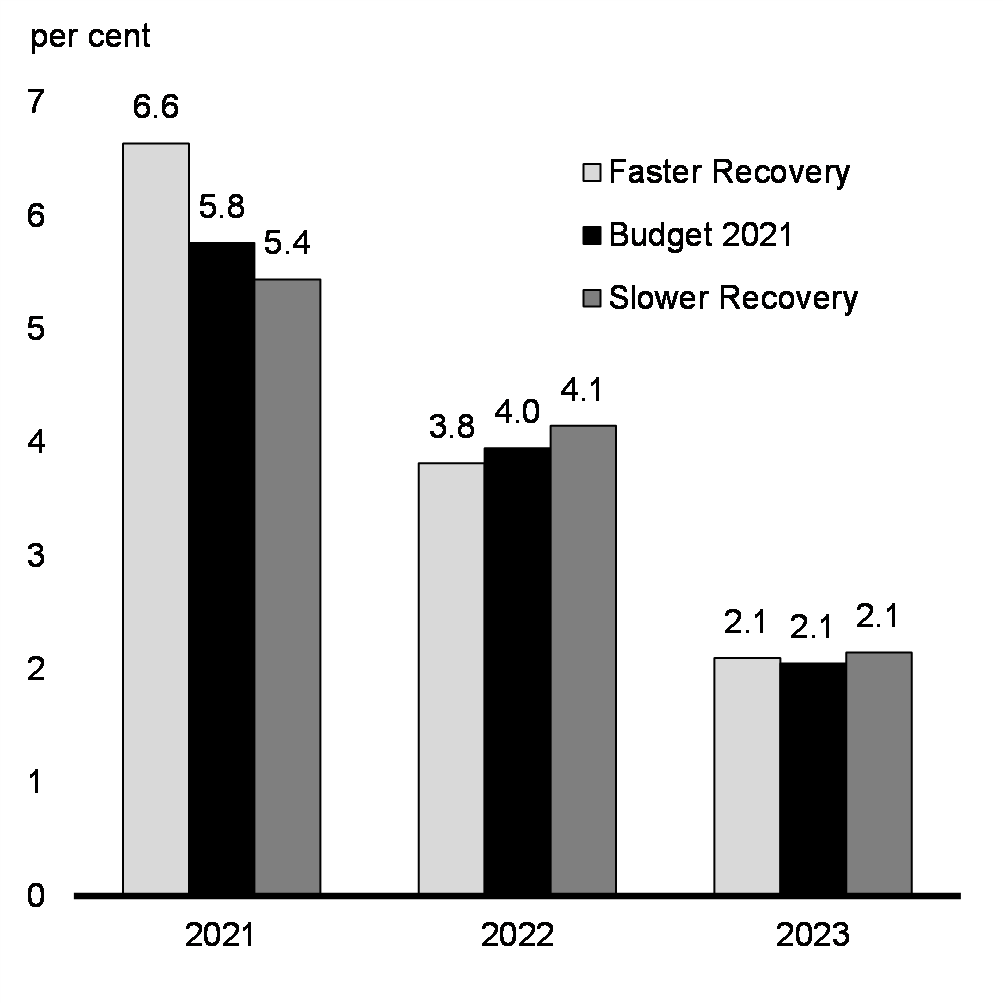
Overall, the downside risks scenario suggests a reduced pace of growth over the second and third quarters compared to the March survey outlook, with the recovery accelerating in the final quarter of 2021. This reduces the rebound in real GDP to around 5.4 per cent in 2021 but slightly increases the growth outlook for 2022 to around 4.1 per cent, compared to growth rates of, respectively, 5.8 per cent and 4 per cent expected in the March 2021 survey (Chart A1.1 and Table A1.8, below). This is still faster than the baseline forecast for 2021 of the Fall Economic Statement, which expected growth of 4.8 per cent of GDP.
Scenario: Faster Recovery
In this scenario, Canada’s diversified portfolio of vaccines allows vaccination rollout to progress faster than expected and most Canadians are vaccinated by the summer. Most importantly, COVID-19 related deaths and hospitalizations plummet rapidly as vulnerable populations are vaccinated. With hospital capacity restored, provinces are able to quickly lift the most stringent public health and border restrictions (e.g. restaurant and retail closures). Public fears of the virus start to recede by the spring and a more robust rebound occurs in the hospitality sector, quickly lifting employment and economic activity.
Further, the prospect of significant fiscal stimulus and a faster vaccination rollout in the U.S. drives demand for Canadian exports and provides upward support to global commodity prices, helping to close the remaining gaps in activity in manufacturing, mining, and energy.
Overall, the upside risks scenario suggests much faster growth in the first half of this year compared to the March survey forecast, with growth slowing thereafter, resulting in a rebound of about 6.6 per cent in 2021 followed by slightly slower growth of around 3.8 per cent in 2022.
Real GDP Growth Outlook
Quarterly Growth
Real GDP Growth Outlook
Annual Growth
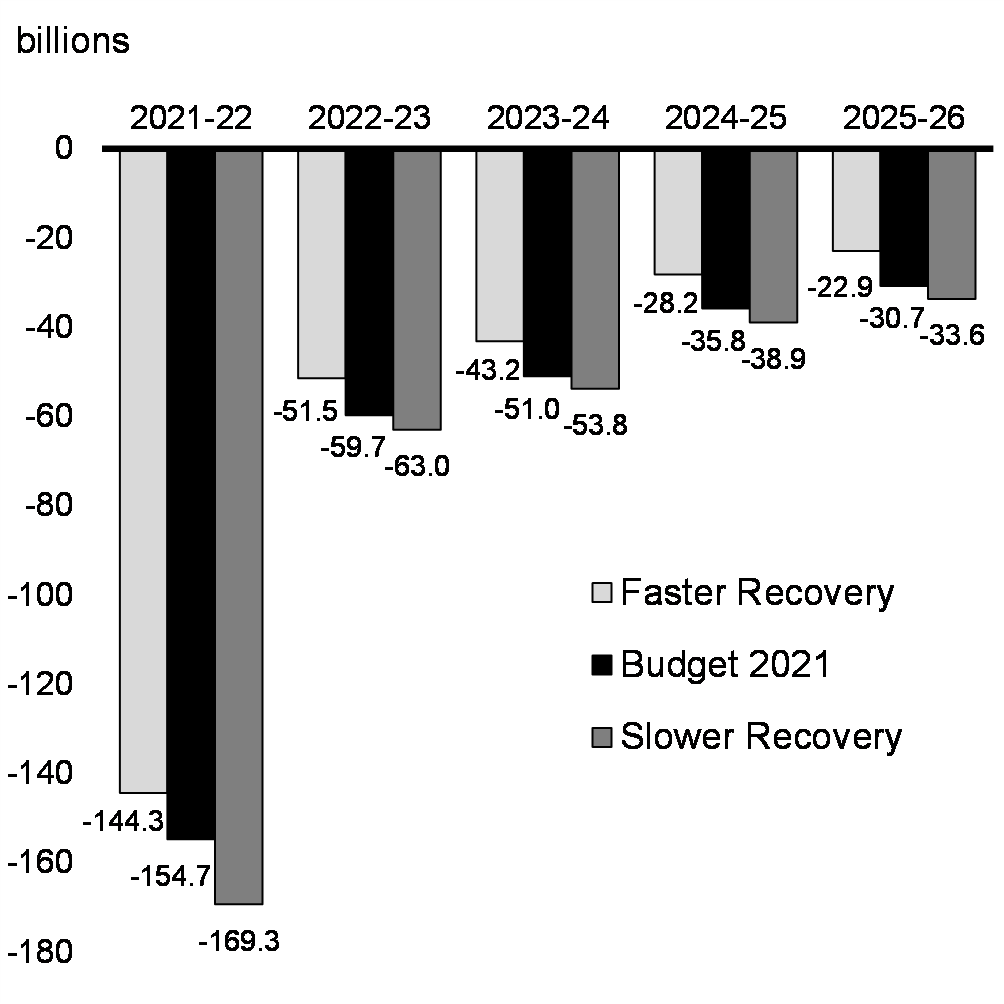
The potential impact of these alternative scenarios on the projected federal deficit and debt-to-GDP ratio is shown in Chart A1.2 below. The relative change in economic activity under both scenarios would be expected to affect tax revenues, and expenses such as Employment Insurance benefits and the government’s COVID emergency response programs including the Canada Recovery Benefit, and Canada Emergency Wage Subsidy, and, in the downside scenario, may require the government to delay the scaling down of those programs. Notably, in a slower growth scenario, the federal government’s business and income supports would need to be extended further.
In total, the downside scenario could be expected to add about $15 billion to the deficit in 2021-22, and 1.2 percentage points to the federal debt-to-GDP ratio by the end of the forecast horizon. In the upside scenario, the deficit would be reduced by approximately $10 billion in 2021-22 and the federal debt-to-GDP ratio would fall to 47 per cent by 2025-26. Under this scenario, inflation is expected to reach a peak of 2.3 per cent in 2023, within the Bank of Canada’s inflation-control target range of 1 to 3 per cent, inducing a faster normalization in policy rates.
Deficit under alternative economic scenarios
Federal Debt-to-GDP under alternative economic scenarios
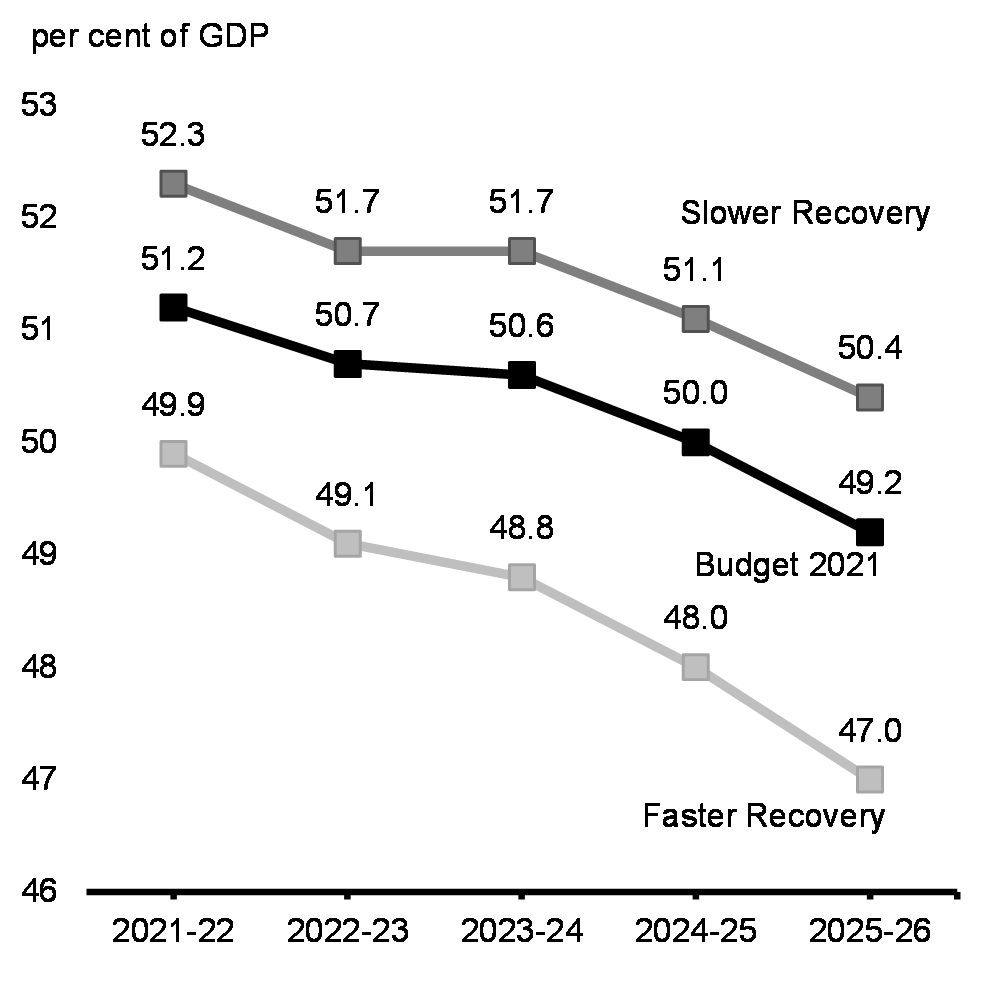
Notably, in all cases, the debt-to-GDP ratio forecasted here is lower across the planning horizon than the upper limits projected in the Fall Economic Statement, including the impact of planned stimulus. This reflects a generally better economic environment against which the recovery may unfold faster or slower.
| 2021Q1 | 2021Q2 | 2021Q3 | 2021Q4 | 2021 | 2022 | 2023 | 2024 | 2025 | |
|---|---|---|---|---|---|---|---|---|---|
| Real GDP Growth | |||||||||
Budget 2021 |
3.6 | 4.4 | 6.3 | 5.0 | 5.8 | 4.0 | 2.1 | 1.9 | 1.8 |
Scenario: Slower Recovery |
5.0 | 2.0 | 4.0 | 6.0 | 5.4 | 4.1 | 2.1 | 1.9 | 1.8 |
Scenario: Faster Recovery |
6.5 | 6.0 | 5.5 | 4.0 | 6.6 | 3.8 | 2.1 | 1.9 | 1.8 |
| GDP Inflation | |||||||||
Budget 2021 |
2.9 | 1.9 | 2.6 | 2.1 | 3.3 | 2.0 | 2.0 | 2.1 | 2.0 |
Scenario: Slower Recovery |
2.5 | 1.1 | 2.1 | 2.2 | 3.1 | 2.1 | 1.9 | 2.0 | 2.0 |
Scenario: Faster Recovery |
7.0 | 2.8 | 2.2 | 2.1 | 4.5 | 2.1 | 1.9 | 2.0 | 2.0 |
| Nominal GDP Growth | |||||||||
Budget 2021 |
6.6 | 6.3 | 9.0 | 7.2 | 9.3 | 6.0 | 4.0 | 4.0 | 3.8 |
Scenario: Slower Recovery |
7.6 | 3.2 | 6.2 | 8.3 | 8.6 | 6.3 | 4.1 | 3.9 | 3.8 |
Scenario: Faster Recovery |
13.9 | 9.0 | 7.8 | 6.2 | 11.4 | 6.0 | 4.1 | 3.9 | 3.8 |
| Nominal GDP Level ($ billions) | |||||||||
Budget 2021 |
2,408 | 2,553 | 2,657 | 2,763 | 2,869 | ||||
Scenario: Slower Recovery |
2,394 | 2,545 | 2,650 | 2,754 | 2,859 | ||||
Scenario: Faster Recovery |
2,455 | 2,603 | 2,709 | 2,815 | 2,923 | ||||
Difference between Budget 2021 and Scenario: Slower Recovery |
-14 | -8 | -7 | -9 | -9 | ||||
Difference between Budget 2021 and Scenario: Faster Recovery |
47 | 49 | 52 | 52 | 54 | ||||
| Unemployment Rate | |||||||||
Budget 2021 |
9.1 | 8.4 | 7.6 | 7.0 | 8.0 | 6.5 | 6.2 | 6.0 | 5.9 |
Scenario: Slower Recovery |
8.4 | 8.3 | 7.9 | 7.4 | 8.0 | 6.7 | 6.3 | 6.0 | 5.9 |
Scenario: Faster Recovery |
8.4 | 7.9 | 7.2 | 6.7 | 7.6 | 6.2 | 6.0 | 5.9 | 5.9 |
| 3-month Treasury Bill Rate | |||||||||
March 2021 Survey |
0.1 | 0.1 | 0.2 | 0.2 | 0.1 | 0.2 | 0.5 | 1.1 | 1.6 |
Scenario: Slower Recovery |
0.1 | 0.2 | 0.2 | 0.2 | 0.2 | 0.2 | 0.3 | 1.0 | 1.5 |
Scenario: Faster Recovery |
0.1 | 0.2 | 0.2 | 0.2 | 0.2 | 0.2 | 0.5 | 1.2 | 1.7 |
| 10-Year Government Bond Rate | |||||||||
March 2021 Survey |
1.3 | 1.5 | 1.6 | 1.6 | 1.5 | 1.8 | 2.1 | 2.5 | 2.7 |
Scenario: Slower Recovery |
1.2 | 1.4 | 1.5 | 1.6 | 1.5 | 1.8 | 2.0 | 2.3 | 2.5 |
Scenario: Faster Recovery |
1.2 | 1.6 | 1.7 | 1.8 | 1.6 | 2.0 | 2.3 | 2.6 | 2.9 |
| Sources: Statistics Canada; for the Budget 2021, Department of Finance Canada March 2021 survey of private sector economists; Department of Finance Canada calculations. | |||||||||
Supplementary Information
Sensitivity of Fiscal Projections to Economic Shocks
Changes in economic assumptions affect the projections for revenues and expenses. The following tables illustrate the sensitivity of the budgetary balance to a number of economic shocks:
- A one-year, 1-percentage-point decrease in real GDP growth driven equally by lower productivity and employment growth.
- A decrease in nominal GDP growth resulting solely from a one-year, 1-percentage-point decrease in the rate of GDP inflation (assuming that the Consumer Price Index (CPI) moves in line with GDP inflation).
- A sustained 100-basis-point increase in all interest rates.
These sensitivities are generalized rules of thumb that assume any decrease in economic activity is proportional across income and expenditure components, and are meant to provide a broad illustration of the impact of economic shocks on the outlook for the budgetary balance. The sensitivity analysis conducted in this section has been presented routinely in budgets since 1994, and is separate from the scenarios for a faster or slower recovery presented earlier in this Annex. Actual economic shocks may have different fiscal impacts. For example, they may be concentrated in specific sectors of the economy or cause different responses in key economic variables (e.g. GDP inflation and CPI inflation may have different responses to a given shock).
| Year 1 | Year 2 | Year 5 | |
|---|---|---|---|
| Federal revenues | |||
Tax revenues |
|||
Personal income tax |
-2.9 | -3.0 | -3.4 |
Corporate income tax |
-0.5 | -0.5 | -0.6 |
Goods and services tax |
-0.4 | -0.4 | -0.4 |
Other |
-0.1 | -0.1 | -0.2 |
Total tax revenues |
-3.9 | -4.0 | -4.6 |
Employment Insurance premiums |
-0.1 | -0.1 | 0.8 |
Other revenues |
-0.1 | -0.1 | -0.1 |
Total budgetary revenues |
-4.1 | -4.2 | -3.9 |
| Federal expenses | |||
Major transfers to persons |
|||
Elderly benefits |
0.0 | 0.0 | 0.0 |
Employment Insurance benefits |
1.3 | 0.9 | 1.1 |
Canada Child Benefit |
0.0 | 0.0 | 0.0 |
Total major transfers to persons |
1.3 | 0.9 | 1.1 |
Other program expenses |
-0.2 | -0.3 | -0.5 |
Public debt charges |
0.0 | 0.1 | 0.5 |
Total expenses |
1.1 | 0.8 | 1.0 |
| Budgetary balance | -5.2 | -5.0 | -4.9 |
A 1-percentage-point decrease in real GDP growth proportional across income and expenditure components reduces the budgetary balance by $5.2 billion in the first year, $5 billion in the second year and $4.9 billion in the fifth year (Table A1.9).
- Tax revenues from all sources fall by a total of $3.9 billion in the first year. Personal income tax revenues decrease as employment and the underlying tax base fall. Corporate income tax revenues fall as output and profits decrease. GST revenues decrease as a result of lower consumer spending associated with the fall in employment and personal income.
- EI premium revenues are relatively unchanged in the first two years due to the 2021 premium rate already being in effect, and the 2022 rate being frozen. EI revenues increase in the fifth year as the EI premium rate increases, which, under the seven-year break-even mechanism, adjusts to offset the increase in benefits such that the EI Operating Account balances over time.
- Expenses rise, mainly reflecting higher EI benefits (due to an increase in the number of unemployed) and higher public debt charges (reflecting a higher stock of debt due to the lower budgetary balance). This rise is partially offset by lower other program expenses (as certain programs are linked to growth in nominal GDP).
| Year 1 | Year 2 | Year 5 | |
|---|---|---|---|
| Federal revenues | |||
Tax revenues |
|||
Personal income tax |
-2.9 | -2.5 | -2.5 |
Corporate income tax |
-0.5 | -0.6 | -0.7 |
Goods and services tax |
-0.4 | -0.4 | -0.4 |
Other |
-0.1 | -0.1 | -0.2 |
Total tax revenues |
-3.9 | -3.6 | -3.7 |
Employment Insurance premiums |
0.0 | -0.1 | -0.2 |
Other revenues |
-0.1 | -0.1 | -0.1 |
Total budgetary revenues |
-4.0 | -3.8 | -4.0 |
| Federal expenses | |||
Major transfers to persons |
|||
Elderly benefits |
-0.4 | -0.7 | -0.8 |
Employment Insurance benefits |
0.1 | 0.1 | 0.2 |
Canada Child Benefit |
0.0 | -0.1 | -0.3 |
Total major transfers to persons |
-0.3 | -0.7 | -0.8 |
Other program expenses |
-0.6 | -0.6 | -1.4 |
Public debt charges |
-0.6 | 0.1 | 0.3 |
Total expenses |
-1.5 | -1.2 | -2.0 |
| Budgetary balance | -2.4 | -2.6 | -2.1 |
A 1-percentage-point decrease in nominal GDP growth proportional across income and expenditure components resulting solely from lower GDP inflation (assuming that the CPI moves in line with GDP inflation) lowers the budgetary balance by $2.4 billion in the first year, $2.6 billion in the second year and $2.1 billion in the fifth year (Table A1.10).
- Lower prices result in lower nominal income and, as a result, personal income tax revenues decrease. As the parameters of the personal income tax system are indexed to inflation, the fiscal impact is smaller than under the real shock. For the other sources of tax revenue, the negative impacts are similar under the real and nominal GDP shocks.
- EI premium revenues decrease in response to lower earnings.
- Other revenues decline slightly as lower prices lead to lower revenues from the sales of goods and services.
- Partly offsetting lower revenues are the declines in the cost of statutory programs that are indexed to inflation, such as elderly benefit payments, which puts downward pressure on federal program expenses. In addition, other program expenses are also lower as certain programs are linked directly to growth in wages and nominal GDP.
- Public debt charges decline in the first year due to lower costs associated with Real Return Bonds, then rise due to the higher stock of debt.
| Year 1 | Year 2 | Year 5 | |
|---|---|---|---|
Federal revenues |
2.1 | 2.7 | 3.6 |
Federal expenses |
-3.1 | -5.3 | -8.2 |
Of which: public debt charges |
-3.1 | -5.3 | -8.2 |
Budgetary balance |
-1.0 | -2.5 | -4.6 |
A one per cent increase in interest rates decreases the budgetary balance by $1 billion in the first year, $2.5 billion in the second year and $4.6 billion in the fifth year (Table A1.11). Higher interest rates directly impact estimated public debt charges on marketable debt in two ways. First, interest costs increase as existing debt matures and is refinanced at higher rates. Second, rising rates increase the expected cost of future borrowing needs. Public debt charges are estimated based on the current expectations for future changes in interest rates, which are subject to change based on economic conditions.
It is important to note that interest rates also directly affect other government revenue and expenses and that they typically do not change in isolation. That is, with higher interest rates, the government would realize some offsetting benefits, including:
- Higher revenues from the government’s interest-bearing assets, which are recorded as part of other revenues;
- Corresponding downward adjustments that reduce public sector pensions and employee benefits obligations, which are not incorporated in the table above; and,
- Higher government tax revenues if interest rate increases were due to stronger economic growth (also not included in the table above).
Short-term Economic Impacts of Government Support and Investment
There are two primary channels through which government spending can affect short-term output and employment. First, governments can invest in infrastructure or purchase goods and services, which translates into an immediate, dollar-for-dollar increase in final domestic expenditure. Second, governments can induce spending increases by households and businesses through tax measures or transfers. The extent to which these measures boost domestic expenditure and production will be determined by changes in saving and imports.
To estimate the economic impacts of fiscal measures, the Department of Finance allocates spending into expenditure categories, which correspond to those used in the Department’s macroeconomic and fiscal model: infrastructure investment, personal income tax and transfer measures, measures for modest- and low-income households, government spending measures (such as government support for research, training, and innovation), and corporate income tax measures. Each of these categories has a different fiscal multiplier, a summary measure that takes into account the channels by which spending affects economic activity, including direct, indirect and induced impacts, and leakages to saving and imports.
Table A1.12 shows the total value of support and investments included in the economic impact assessment. It is expected that support and investments will raise the level of real GDP by 2 per cent by the second year (Table A1.13). This is expected to translate into an increase in employment of more than 330 thousand jobs created or maintained by 2022-2023.
| 2021- 2022 |
2022- 2023 |
2023- 2024 |
|
|---|---|---|---|
Fall Economic Statement 20201 |
21.6 | 1.3 | 1.8 |
| Actions since FES 2020 and Budget 2021 Investments | 49.3 | 28.3 | 23.8 |
Recovery Plan Total (accrual basis) |
70.9 | 29.6 | 25.6 |
Recovery Plan Total (cash basis) |
81.7 | 35.6 | 32.1 |
Measures excluded from impact assessment2 |
-6.6 | -1.3 | -1.7 |
Total Value for Economic Impact Assessment |
75.1 | 34.3 | 30.4 |
| Note: Totals may not add due to rounding. 1 Includes investments in FES 2020 Chapter 3 and the extension of CEWS/CERS to June 2021. 2 Actions that have no impact on GDP (e.g., contingencies, international initiatives) are excluded. |
|||
| 2021– 2022 |
2022– 2023 |
2023– 2024 |
|
|---|---|---|---|
Real GDP (per cent) |
1.6 | 2.0 | 1.9 |
Employment (jobs created or maintained, thousands) |
315 | 334 | 280 |
Policy Actions Taken since the 2020 Fall Economic Statement
Since 2016, the government has provided a transparent overview of all off-cycle spending. The investments (Table A1.14) ensure that Canadians are continually well served by the programs they rely on and that government operations carry on as usual.
| 2020– 2021 | 2021– 2022 | 2022– 2023 | 2023– 2024 | 2024– 2025 | 2025– 2026 | |
|---|---|---|---|---|---|---|
| Government Operations, Fairness and Openness | 92 | 476 | 170 | 149 | 149 | 150 |
Global Affairs Canada Adjustments for Non-Discretionary Cost Fluctuations |
26 | 89 | 92 | 74 | 74 | 74 |
| Funding provided to Global Affairs Canada for non-discretionary cost increases affecting missions abroad, such as changes in exchange rates and inflation. This will allow Canada’s missions to continue delivering a high standard of services to support the needs of Canadians. | ||||||
Establish Pandemic-related safety measures in Elections1 |
0 | 110 | 0 | 0 | 0 | 0 |
| Temporary amendments to the Canada Elections Act to ensure the health and safety of electors and election workers during a general election if it takes place during the pandemic, including introducing a 3-day polling period. | ||||||
Price and Volume Inflation Protection for Federal Banking and Postage |
0 | 6 | 0 | 0 | 0 | 0 |
| Funding for Public Services and Procurement Canada for credit and debit card and postage costs incurred when mailing cheques to Canadians on behalf of the federal government. | ||||||
Public Inquiry into the Tragedy in Nova Scotia |
2 | 12 | 8 | 1 | 0 | 0 |
Less: Costs to be Recovered |
-1 | -6 | -4 | 0 | 0 | 0 |
Less: Funds Sourced From Existing Departmental Resources |
-1 | 0 | 0 | 0 | 0 | 0 |
| Funding for the Privy Council Office, to support a joint federal-provincial public inquiry into the April 2020 tragedy in Nova Scotia. | ||||||
Price and Volume Inflation Protection for Federal Real Property |
1 | 14 | 14 | 14 | 14 | 14 |
| Funding for Public Services and Procurement Canada to maintain current office, common use accommodation, and related real property service levels for federal departments and agencies. | ||||||
CRA administration costs to deliver the COVID recovery benefits. |
63 | 199 | 0 | 0 | 0 | 0 |
Less: Funds Previously Provisioned in the Fiscal Framework |
-45 | 0 | 0 | 0 | 0 | 0 |
| Funding for the CRA to administer COVID recovery benefits including the Canada Recovery Benefit, Sickness Benefit, and Caregiving Benefit. | ||||||
Resolving Complex Tax Disputes and Litigation |
47 | 52 | 59 | 60 | 61 | 61 |
| Funding to bolster legal resources at the Department of Justice and the CRA. These resources will support the government's efforts to recover tax revenue in high-complexity cases and protect the integrity of the tax system. | ||||||
| Growth, Innovation, Infrastructure and the Environment | 12 | 650 | 999 | 1,300 | 784 | 403 |
| A Healthy Environment and a Healthy Economy Climate Plan Measures – Announced December 11, 20202 | ||||||
Creating the Strategic Innovation Fund Net Zero Accelerator |
0 | 267 | 398 | 780 | 785 | 404 |
| Funding for Innovation, Science and Economic Development Canada of $3 billion (cash basis) over five years to create a Net Zero Accelerator within the Strategic Innovation Fund. The Net Zero Accelerator will help Canada meet its climate change goals by supporting projects that will rapidly expedite decarbonization projects, scale-up clean technology and accelerate Canada’s industrial transformation. | ||||||
Integrating Climate Considerations in Government Decision-Making |
0 | 2 | 0 | 0 | 0 | 0 |
| Funding for Environment and Climate Change Canada to develop an analytical lens to integrate climate mitigation and adaptation considerations into federal decisions on policies, programs and proposals. | ||||||
Green and Inclusive Community Buildings |
0 | 400 | 600 | 500 | 0 | 0 |
Year-over-year reallocation of funding3 |
0 | 0 | -150 | 0 | 75 | 75 |
| Funding for Infrastructure Canada to support retrofits, repairs or upgrades of existing public buildings and the construction of new public buildings that serve communities across Canada. | ||||||
Net-Zero Challenge for Large Industrial Emitters |
0 | 1 | 1 | 1 | 1 | 1 |
| Funding for Environment and Climate Change Canada to launch a Net-Zero Challenge for large industrial emitters to encourage companies to develop and implement plans to transition their facilities to net-zero greenhouse gas emissions by 2050. | ||||||
Returning Carbon Pricing Proceeds |
0 | 37 | 74 | 73 | 74 | 74 |
Less: Funds Sourced From Existing Departmental Resources |
0 | -2 | 0 | 0 | 0 | 0 |
Less: Fuel Charge Proceeds Booked in the Fiscal Framework |
0 | -5 | 0 | 0 | 0 | 0 |
Less: Estimates of OBPS Proceeds Not Yet Booked in the Fiscal Framework |
0 | -108 | -159 | 0 | 0 | 0 |
| Funding for Environment and Climate Change Canada to continue to administer the Low Carbon Economy funds and return federal carbon pricing proceeds to provinces that do not meet federal carbon pricing benchmark stringency requirements as well as funding for the Canada Revenue Agency to return a portion of carbon fuel charge proceeds collected in New Brunswick directly to the Government of New Brunswick. | ||||||
Advancing Smart Renewable Energy and Grid Modernization |
0 | 85 | 293 | 293 | 293 | 0 |
| Funding to Natural Resources Canada to support renewable power generation projects such as wind and solar, and the deployment of grid modernization technologies such as power storage. This will support emissions reduction and the electrification of the economy. | ||||||
Supporting the Net Zero Advisory Body |
1 | 6 | 4 | 1 | 1 | 1 |
| Funding for Environment and Climate Change Canada to support the Net-Zero Advisory Body, which is an independent expert group that will provide advice to the Government of Canada on the best pathways to achieve net-zero greenhouse gas emissions by 2050. | ||||||
Promoting the Demonstration of Clean Technologies |
0 | 60 | 130 | 160 | 175 | 225 |
| Funding to Sustainable Development Technology Canada to support start-ups and to scale-up companies to enable pre commercial clean technologies to successfully demonstrate feasibility as well as to support early commercialization efforts. | ||||||
Transitioning Diesel-Reliant Indigenous Communities onto Clean Energy |
0 | 0 | 60 | 60 | 60 | 60 |
| Funding to advance the Government’s commitment to ensure that rural, remote and Indigenous communities that currently rely on diesel have access to clean and reliable energy by 2030. | ||||||
Supporting the Adoption of Clean Technologies in the Agriculture Sector |
0 | 16 | 34 | 34 | 34 | 34 |
| Funding to support the agriculture industry in developing transformative clean technologies and help farmers adopt commercially available clean technology. | ||||||
Less: Funds Provisioned in the 2020 Fall Economic Statement for Climate Plan |
-1 | -92 | -437 | -622 | -638 | -395 |
| Other Measures | ||||||
Federal Carbon Pricing Backstop and Litigation |
20 | 18 | 0 | 0 | 0 | 0 |
Less: Funds Sourced From Existing Departmental Resources |
-8 | -8 | 0 | 0 | 0 | 0 |
| Funding for Environment and Climate Change Canada to further develop and implement the Output-Based Carbon Pricing System and for legal costs associated with defending the Greenhouse Gas Pollution Pricing Act against various legal challenges. | ||||||
Wood Buffalo National Park Action Plan |
0 | 17 | 23 | 21 | 0 | 0 |
Less: Funds Previously Provisioned in the Fiscal Framework |
0 | -5 | -5 | 0 | 0 | 0 |
Less: Funds Sourced From Existing Departmental Resources |
0 | -12 | -18 | -21 | 0 | 0 |
Less: Year-Over-Year Reallocation of Funding |
0 | -26 | 2 | 21 | 0 | 0 |
| Funding for the Parks Canada Agency and Environment and Climate Change Canada to continue to implement federal commitments under the Wood Buffalo National Park World Heritage Site Action Plan. | ||||||
| Labour Markets, Health, Safety and Economic Prosperity of Canadians | 0 | 654 | 0 | 0 | 0 | 0 |
Enhanced Border and Quarantine Measures |
0 | 1,059 | 0 | 0 | 0 | 0 |
Less: Funds Previously Provisioned in the Fiscal Framework |
0 | -165 | 0 | 0 | 0 | 0 |
| Funding of $895 million in 2021-22 to the Public Health Agency of Canada to support strengthened border health and quarantine measures in response to the COVID-19 pandemic. | ||||||
Canada Emergency Wage Subsidy Parameters From March 14 to June 5, 2021 |
0 | 13,860 | 0 | 0 | 0 | 0 |
Less: Funds Previously Provisioned in the Fiscal Framework |
0 | -14,100 | 0 | 0 | 0 | 0 |
Canada Emergency Rent Subsidy and Lockdown Support Parameters From March 14 to June 5, 2021 |
0 | 2,125 | 0 | 0 | 0 | 0 |
Less: Funds Previously Provisioned in the Fiscal Framework |
0 | -2,125 | 0 | 0 | 0 | 0 |
| To provide certainty and continued support for workers, businesses and other affected organizations in the face of ongoing challenges presented by the pandemic, this measure extended the existing rate structures for the wage subsidy, the rent subsidy and Lockdown Support from March 14 to June 5, 2021. In particular, the maximum wage subsidy rate for active employees was kept at 75%; the maximum rent subsidy rate was kept at 65%; and Lockdown Support was kept at 25%. | ||||||
| Tax Policy | 242 | 43 | 2 | 1 | 0 | 0 |
Adjust Certain Deductions for Employment Insurance and COVID-19 Benefits |
2 | 3 | 2 | 1 | 0 | 0 |
| Temporarily allow Employment Insurance and Quebec Parental Insurance Plan benefit recipients to deduct eligible expenses for the Child Care Expense Deduction and the Disability Supports Deduction against this benefit income, to align with the treatment of CERB and other COVID-19 emergency income. | ||||||
CERB Repayment for Self-employed Individuals and Interest Relief on 2020 Tax Debt |
240 | 40 | 0 | 0 | 0 | 0 |
| In February 2021, the Government of Canada announced that self-employed individuals who applied for the CERB and would have qualified based on their gross income will not be required to repay the benefit, provided they also met all other eligibility requirements. The Government of Canada also announced targeted interest relief on income tax debt for the 2020 tax year for Canadians who received COVID-related income support benefits. | ||||||
| Trade, International Relations and Security | 1 | 4 | 4 | 4 | 4 | 4 |
Renewal of Operating Funding for the National Security and Intelligence Committee of Parliamentarians |
0 | 4 | 4 | 4 | 4 | 4 |
| Funding for the National Security and Intelligence Committee of Parliamentarians to continue its mandate to review national security and intelligence matters in Canada. | ||||||
Support for the Office of the Intelligence Commissioner |
1 | 0 | 0 | 0 | 0 | 0 |
| Funding for the Office of the Intelligence Commissioner to enable it to meet the legislated requirements of the Intelligence Commissioner Act. | ||||||
(Net) Fiscal Impact of Measures Discussed in Tax Measures: Supplemental Information (Annex 6) |
2 | 7 | -5 | 0 | -10 | -20 |
(Net) Fiscal Impact of Non-Announced Measures in this Budget |
-509 | -2,102 | -2,109 | -317 | -269 | -243 |
| The net fiscal impact of measures that are not announced is presented at the aggregate level, and would include provisions for anticipated Cabinet decisions not yet made (including the use of such provisions from previous budgets or updates) and funding decisions related to national security, commercial sensitivity, contract negotiations and litigation issues. | ||||||
| Net Fiscal Impact – Total Policy Actions Taken Since the 2020 Fall Economic Statement | -160 | -268 | -939 | 1,138 | 659 | 295 |
| Note: Totals may not add due to rounding. 1. Timing of estimated costs is notional and would depend on timing of federal election. 2. Supporting the Production and Use of Clean Fuels was also announced as part of the Climate Plan on December 11, 2020 and is included in Chapter 5. 3. Recent year-over-year reallocation shown for information. Not included in totals. |
||||||
COVID-19 Economic Response Plan
Since March 2020, the government has committed over $345 billion – 15.7 per cent of 2020 GDP – to support Canadians through the pandemic, with major investments in health care, procuring vaccines and personal protective equipment, in income support and responding to businesses’ urgent needs. Altogether, these investments by the federal government represent more than 8 out of every 10 dollars spent in Canada to fight COVID-19 and support Canadians.
Table A1.15 below updates the overview of Canada’s COVID-19 Response Plan detailed in Chapters 1 and 2 of the Fall Economic Statement 2020, with new COVID response measures included in this Budget.
| Net Fiscal Impact (Accrual) | ||||||
|---|---|---|---|---|---|---|
| Impact Value1 | 2019–2020 | 2020–2021 | 2021–2022 | Future Years2 | ||
| Protecting Health and Safety | ||||||
Safe Restart Agreement |
19,909 | - | 19,909 | - | 0 | |
Safe Return to Class |
2,000 | - | 2,000 | - | 0 | |
Vaccines and Therapeutics |
14,340 | - | 7,520 | 6,530 | 826 | |
PPE and Medical Equipment |
5,352 | 200 | 3,331 | 1,821 | 289 | |
Long-Term Care |
1,340 | - | 824 | 516 | 1 | |
Other Public Health Support |
9,579 | 382 | 6,830 | 2,025 | 308 | |
Helping Health Care Systems Recover3 |
4,000 | - | 4,000 | - | 0 | |
Canada’s COVID-19 Immunization Plan3 |
1,000 | - | 1,000 | 0 | 0 | |
Supporting the Mental Health of Those Most Affected by COVID-19 |
140 | - | - | 140 | 118 | |
Supporting Indigenous Communities in the Fight Against COVID-19 |
1,239 | - | - | 1,225 | 6 | |
Safe Return to School on Reserve |
112 | - | - | 112 | 0 | |
International COVID-19 Response and Recovery |
375 | - | - | 375 | 0 | |
| Total - Protecting Health and Safety | 59,385 | 582 | 45,414 | 12,744 | 1,547 | |
Of which: |
||||||
Policy Actions in FES 2020 |
52,520 | 582 | 40,414 | 10,892 | 1,424 | |
Measures in Budget 2021 |
7,040 | - | 5,000 | 1,852 | 124 | |
| Direct Support Measures | ||||||
Canada Emergency Wage Subsidy |
110,545 | - | 84,590 | 25,955 | - | |
Canada Emergency Rent Subsidy and Lockdown Support |
8,405 | - | 4,065 | 4,340 | - | |
Canada Emergency Recovery Benefit |
73,056 | 6,505 | 66,551 | - | - | |
Enhancements to Employment Insurance4 |
13,046 | - | 3,240 | 9,806 | 2,905 | |
Canada Recovery Benefit4 |
26,794 | - | 14,462 | 12,332 | 69 | |
Canada Recovery Sickness Benefit4 |
738 | - | 456 | 282 | 15 | |
Canada Recovery Caregiver Benefit4 |
3,546 | - | 1,953 | 1,593 | 22 | |
Canada Emergency Business Account - Incentive |
13,822 | - | 12,618 | 1,205 | - | |
Other Direct Support Measures (FES 2020) |
34,460 | 106 | 31,276 | 1,715 | 812 | |
Additional Direct Support Measures in Budget 2021 |
1,829 | - | - | 1,879 | 1,104 | |
| Total - Direct Support Measures | 286,242 | 6,611 | 219,141 | 59,117 | 4,926 | |
Of which: |
||||||
Policy Actions in FES 2020 |
269,797 | 6,611 | 226,873 | 34,960 | 1,515 | |
Impact of Re-estimated Costs |
-10,014 | - | -7,974 | -2,040 | - | |
Measures in Budget 2021 |
26,459 | - | 241 | 28,224 | 3,411 | |
| Total - Protecting Health and Safety and Direct Support Measures | 345,628 | 7,193 | 264,555 | 71,861 | 6,473 | |
| Tax and Customs Duty Payment Liquidity (in FES 2020) | 85,050 | 56 | 2,938 | 15 | -5 | |
| Business Credit Availability Program and Other Credit Liquidity Support | 81,889 | - | 5,989 | 4,453 | 2,592 | |
Of which: |
||||||
Policy Actions in FES 2020 |
83,400 | - | 6,355 | 4,689 | 2,424 | |
Impact of Re-estimated Costs |
-1,511 | - | -366 | -236 | 168 | |
| Total - COVID-19 Economic Response Plan | 512,516 | 7,249 | 272,129 | 76,329 | 9,060 | |
Of which: |
||||||
Policy Actions in FES 20205 |
490,716 | 7,249 | 275,227 | 50,556 | 5,358 | |
Impact of Re-estimated Costs |
-11,525 | - | -8,340 | -2,276 | 168 | |
Measures in Budget 2021 |
33,325 | - | 5,241 | 28,049 | 3,534 | |
| Note: Numbers may not add due to rounding. 1 The impact value reflects projected cash expenditures and liquidity support primarily in 2020-21 (some measures also include projected expenditures in 2019-20, and 2021-22). The fiscal (budgetary) impact on an accrual basis is lower, owing to cash-accrual accounting differences and the fact that some of these measures relate to loans and tax deferrals, for which only provisions for potential losses, and forgone interest and penalties would affect the budgetary balance, respectively. 2 2022-2023 to 2025-2026. 3 Announced in March 2021. 4 Includes the cost of extensions and changes announced in February 2021. 5 Net fiscal impact, after amounts provisioned in the 2020 Economic and Fiscal Snapshot for Anticipated Decisions. |
||||||
Report a problem on this page
- Date modified: